Line/Area Chart
Create Line/Area Chart: This video contains how to create Line/Area Chart in AIV.
Steps to create Line/Area chart in dashboard:
-
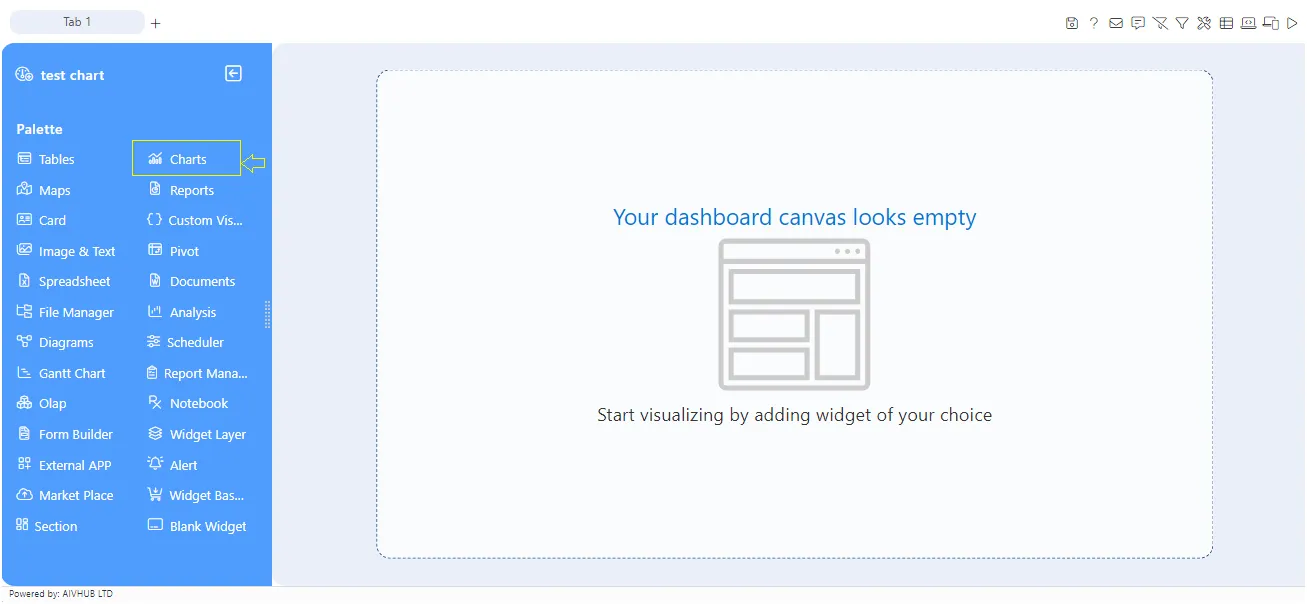
Click on the Charts icon from the Left-vertical menu, as shown in the figure below:
-
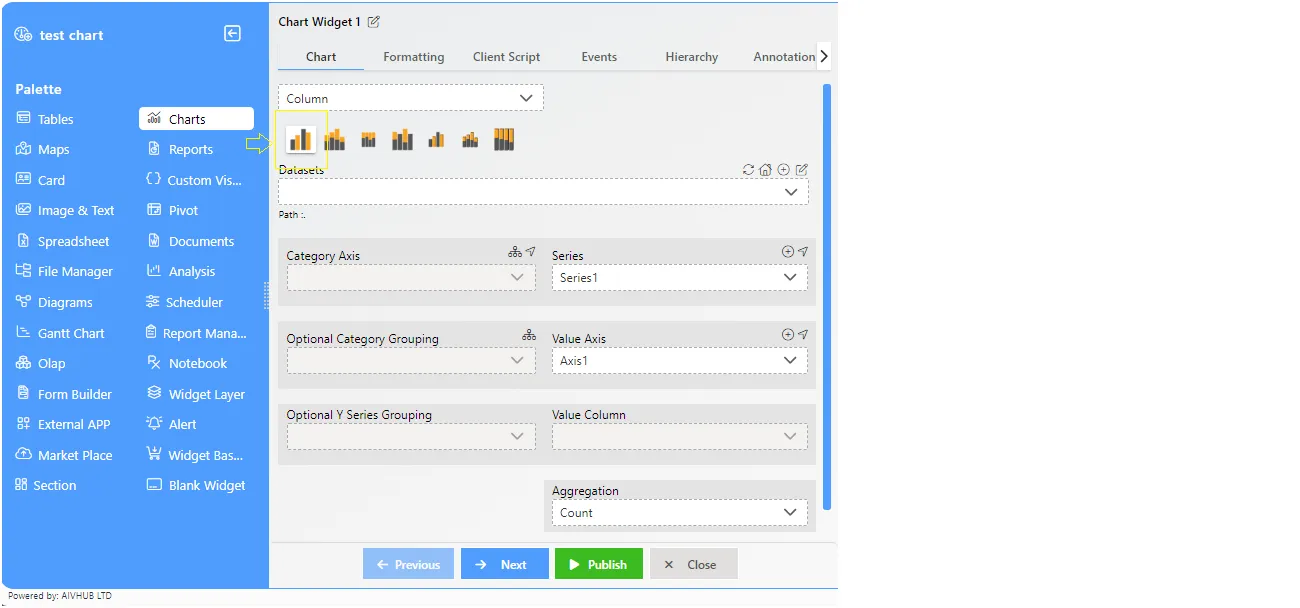
The Line/Area chart edit menu appears as show below:
-
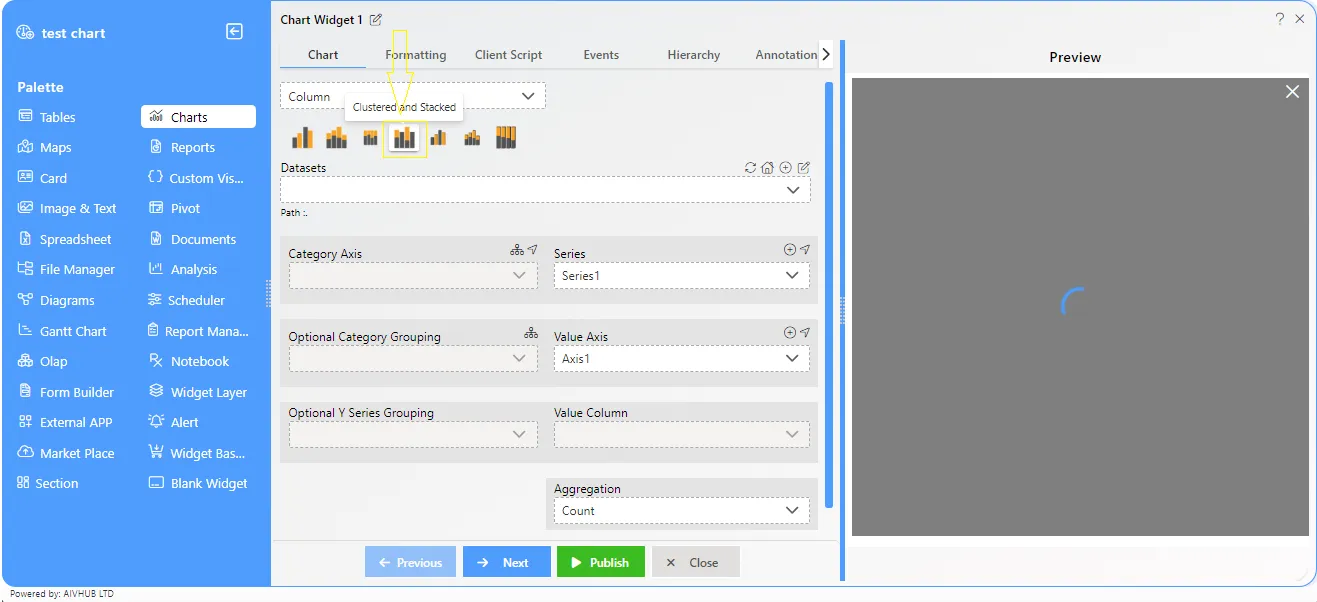
The chart: Column and chart type: Clustered selected by default.
-
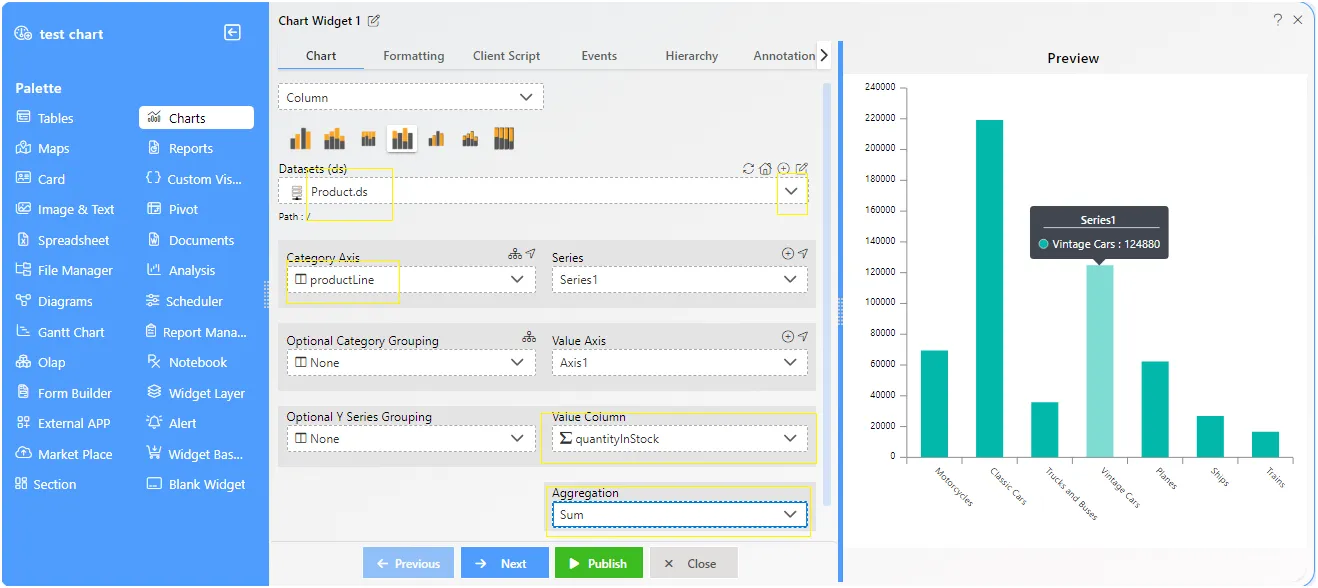
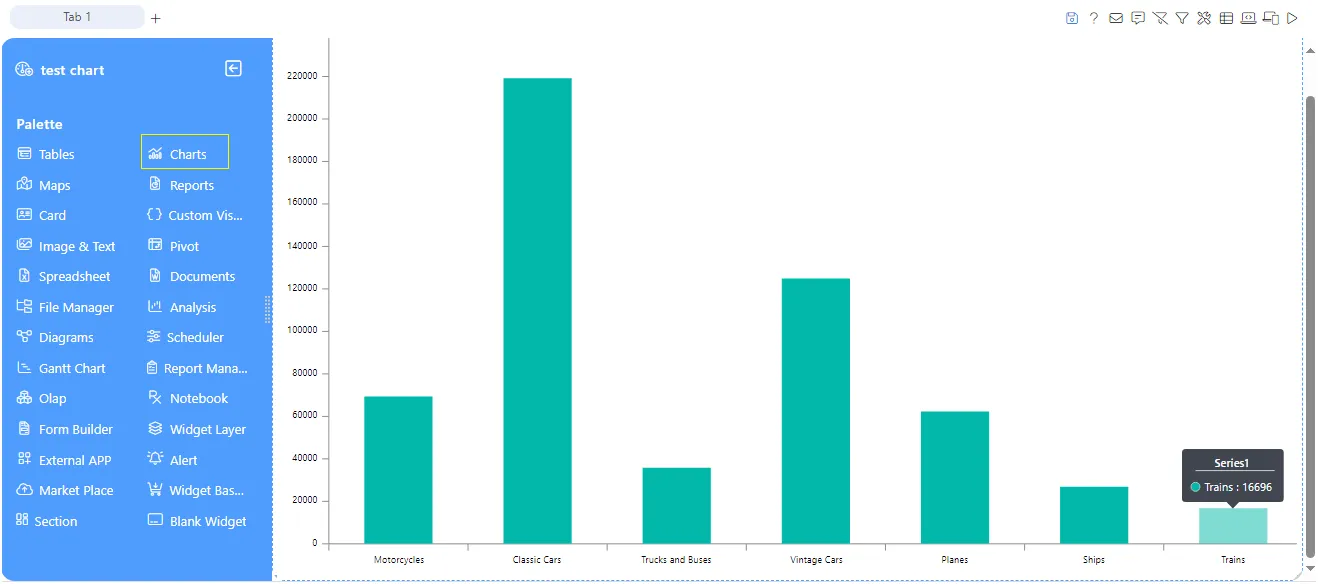
Insert the data to add the column chart as shown in below figure:
- Datasets: Product.ds
- Category Axis: productLine
- Value Column: quantityInStock
- Aggregation: Sum
-
Click on the Publish Button to complete the exercise.
-
The output of the Column chart below:
In order to understand in detail about Line/Area Chart, click on the following links:-
Create Stacked Line/Area Chart
Formatting
Event
Hierarchy
Annotation
Settings