Optional Category grouping
Overview
This document explains how to use Optional Category Grouping in X-Y charts. This setting can be applied to Column, Bar, Line, and Area charts.
Use Case: This feature is useful for visualizing chart data grouped by specific categories, such as region, product type, or other groupings.
Optional Category Grouping: This video explains how to use Optional Category Grouping in the AIV application.
Steps to sort and group the data on the category axis:
-
Click the Charts icon from the left vertical menu, as shown below:
-
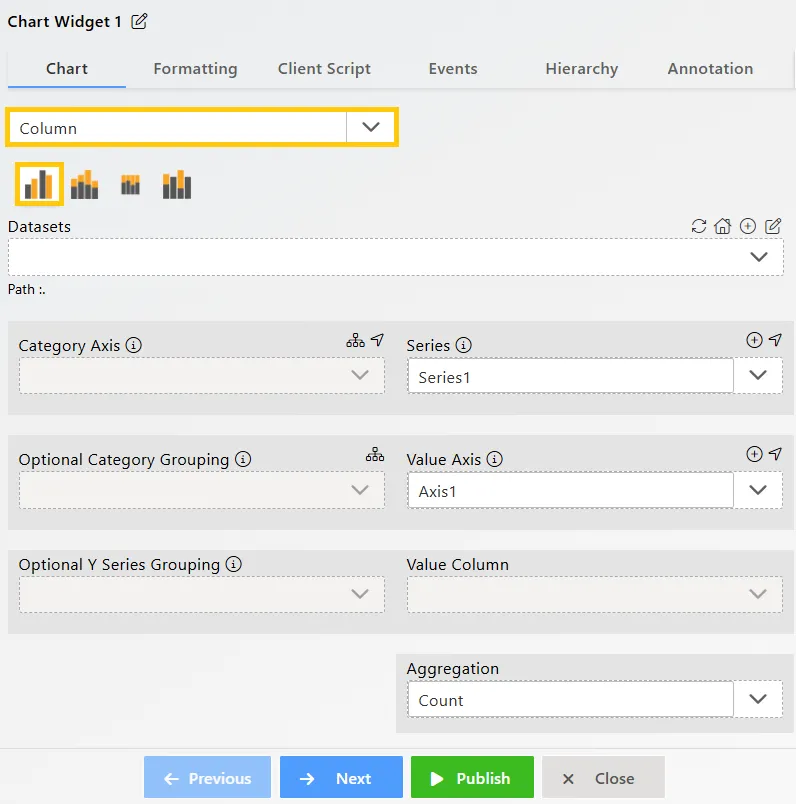
The Chart Edit menu box will appear, and by default, the Clustered Column chart will be selected.
-
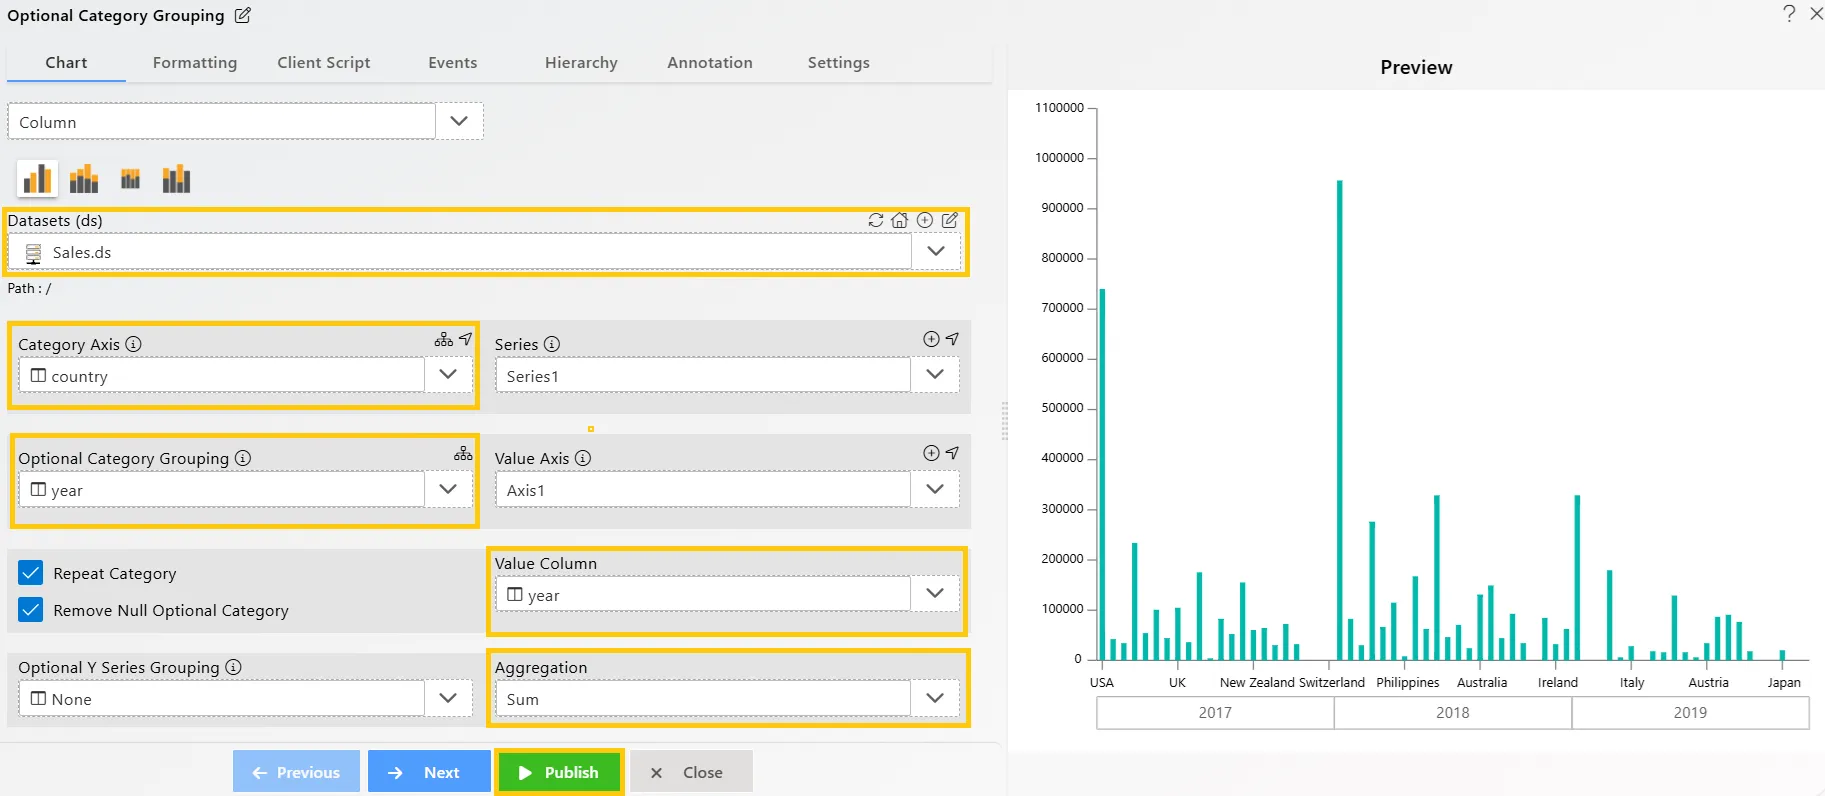
Enter the following details for the Column or Bar Chart Widget:
-
Datasets (ds): Sales.ds
-
Category Axis: country
-
Optional Category Grouping: year
-
Value Column: quantityOrdered
-
Aggregation: Sum
-
-
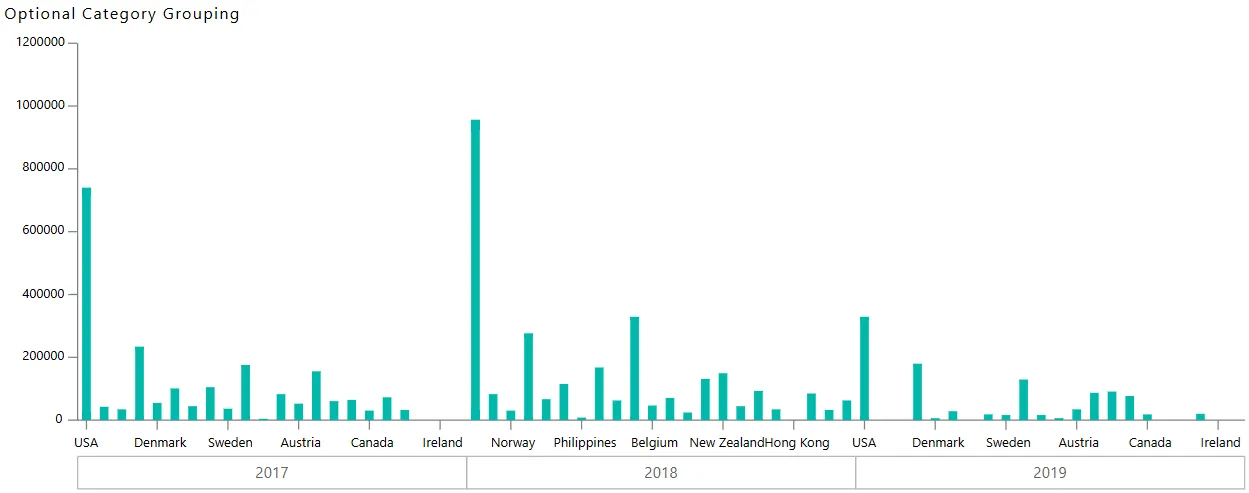
Click on the Publish button, then the Preview icon, and finally click on the SAVE AND EXIT button to view the Column Chart as shown below:
-
Edit the chart widget by clicking the
 icon located in the top-right corner of the widget, as shown below:
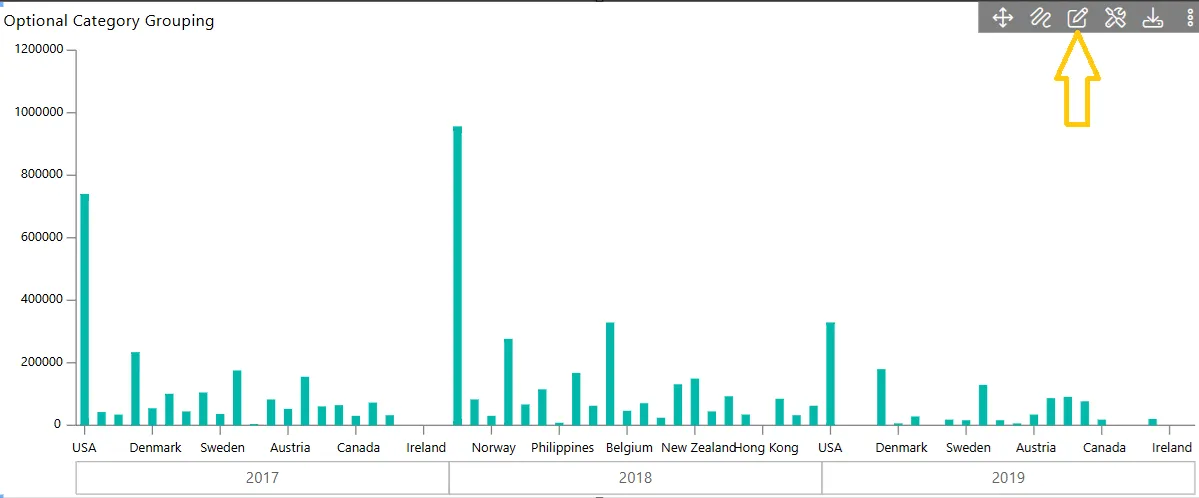
-
Click on the
 icon next to Optional Category Grouping. A pop-up will appear, as shown below:
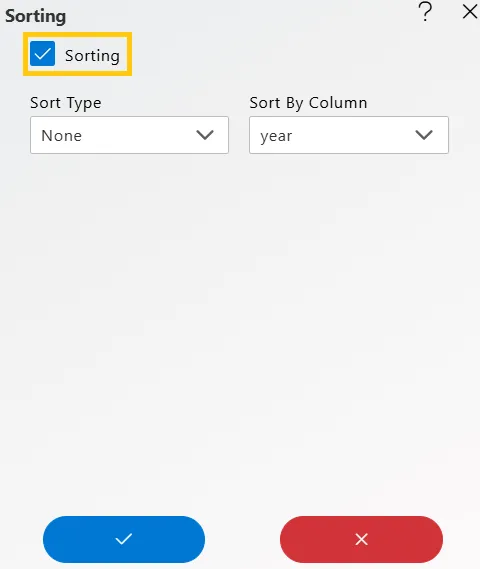
-
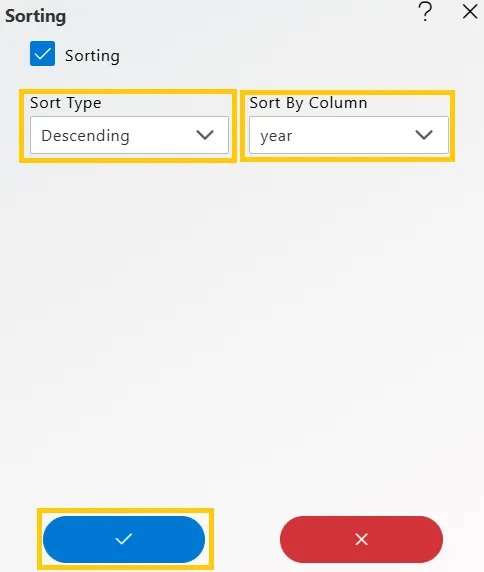
Check the Sorting box (when the user checks the Sorting box, Sort Type - None is selected by default). The user can then select options as per their requirement. Here, the following options are used:
-
Sort Type: Descending
-
Sort By Column: Year
-
-
Click on the Publish button, then the Preview icon, and finally click on the SAVE AND EXIT button. The Column Chart will display the year on the category axis in descending order, as shown below:
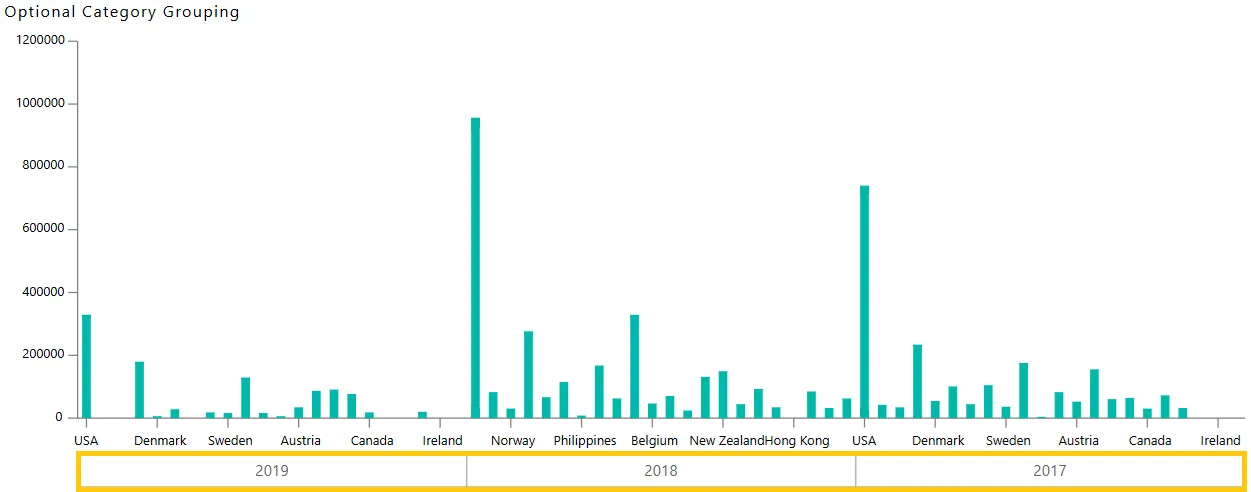
In this way, you can create both column and bar charts with optional category grouping in the AIV application.