Adhoc Analysis
This document provides a detailed guide on creating an Adhoc Analysis Report. Users can perform real-time data analysis without needing to save their work by following the instructions in this section. If needed, they can also download a copy of the analysis report for future reference or sharing. This feature enables efficient data exploration and convenient access to analysis results.
Adhoc analysis : This video provides an overview of how to perform adhoc analysis within the application.
Objective
Create an Adhoc Analysis report.
Prerequisites
-
For this example, the sales.ds dataset is used.
-
Download the required sample files from the link adhoc_analysis.zip
-
Upload sales.ds to the Dataset Section.
-
Refer to this link for detailed steps on uploading files in the application.
Steps to Create Adhoc Analysis
-
Go to Hamburger
 icon > Documents > Adhoc Analysis, then click on the list view
  icon to open the Analysis.
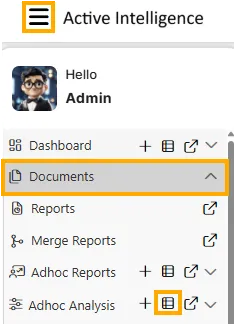
-
There are three ways to create an Adhoc Analysis in the application:
I. Click on the
 icon next to the create folder icon in the bottom toolbar.
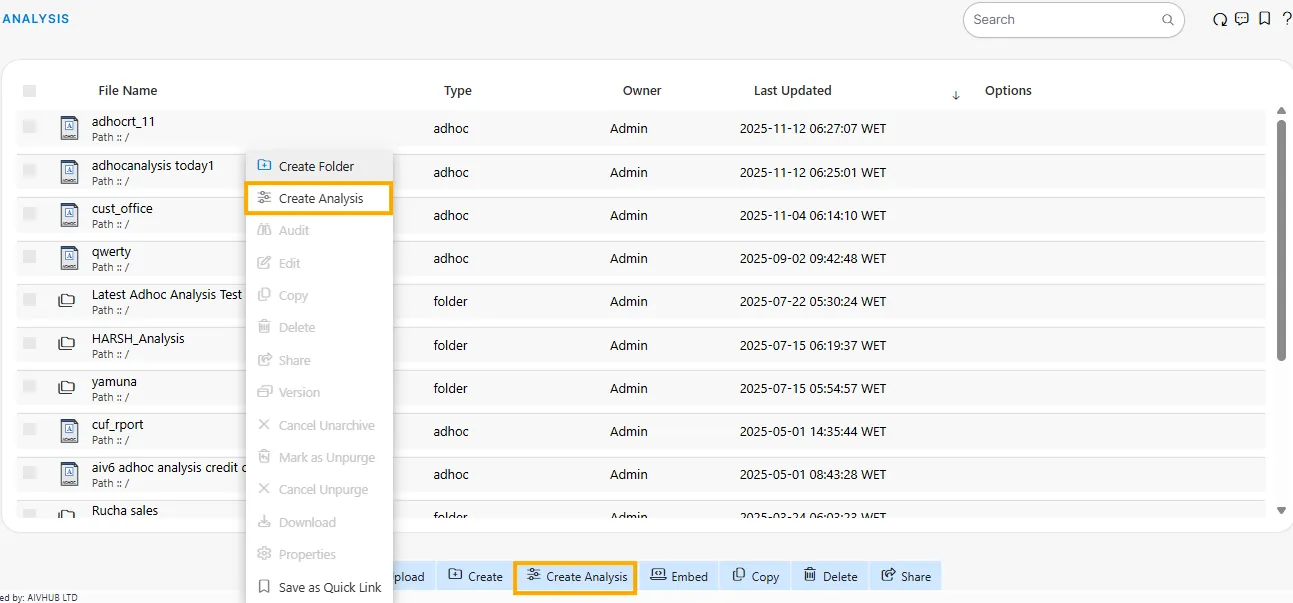
II. Right-click on any empty space in the list view and select Create Analysis.
III. Go to the Hamburger
icon > Documents > Adhoc Analysis, then click on the Create Analysis  icon.
icon.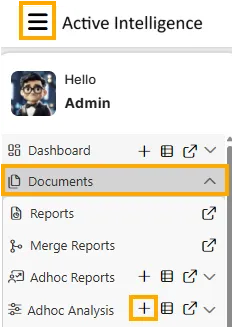
-
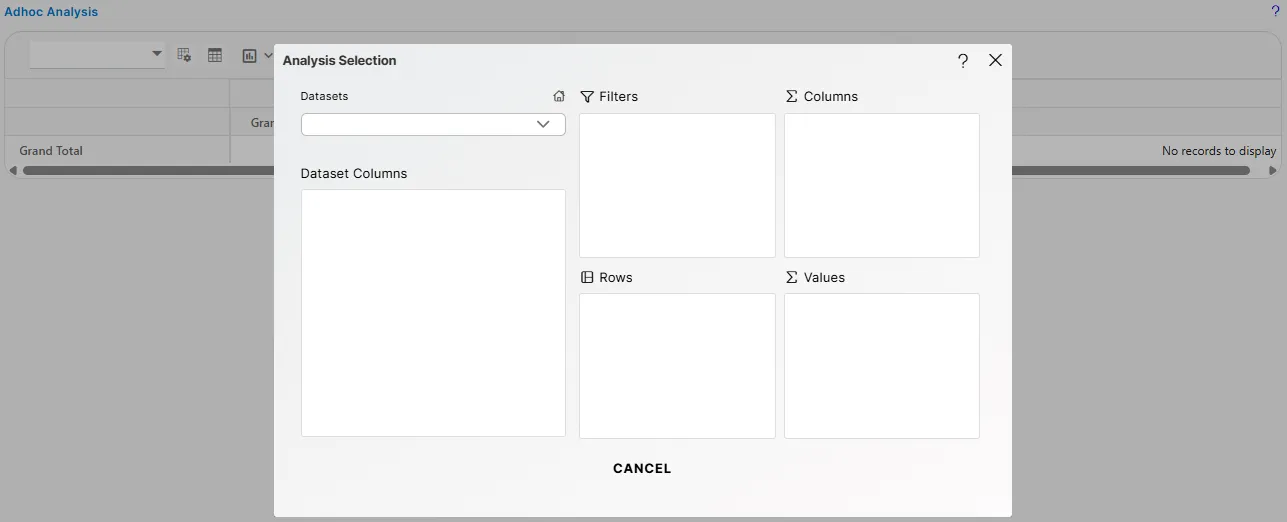
After clicking on Create Analysis (using either method), Analysis Selection dialog box will open.
-
Enter the following details in the analysis section box:
-
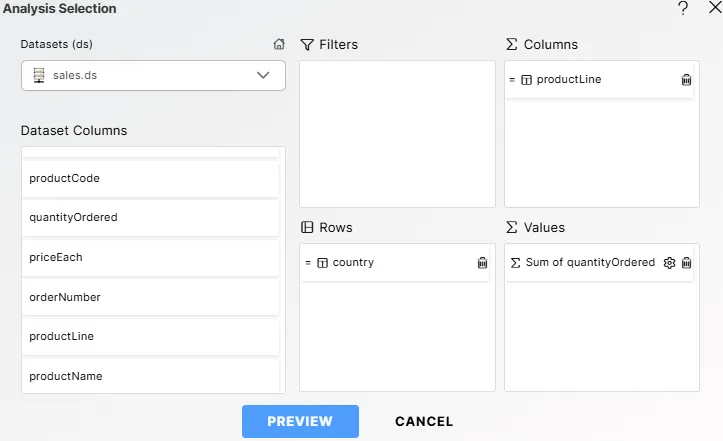
Dataset: From the Datasets dropdown, select sales.ds.
-
Columns: Drag and drop productLine from the Dataset Columns panel into the Columns section.
-
Rows: Drag and drop country from the Dataset Columns panel into the Rows section.
-
Values: Drag and drop quantityOrdered into the Values section. When the configuration box appears, set the Type to Sum.
-
-
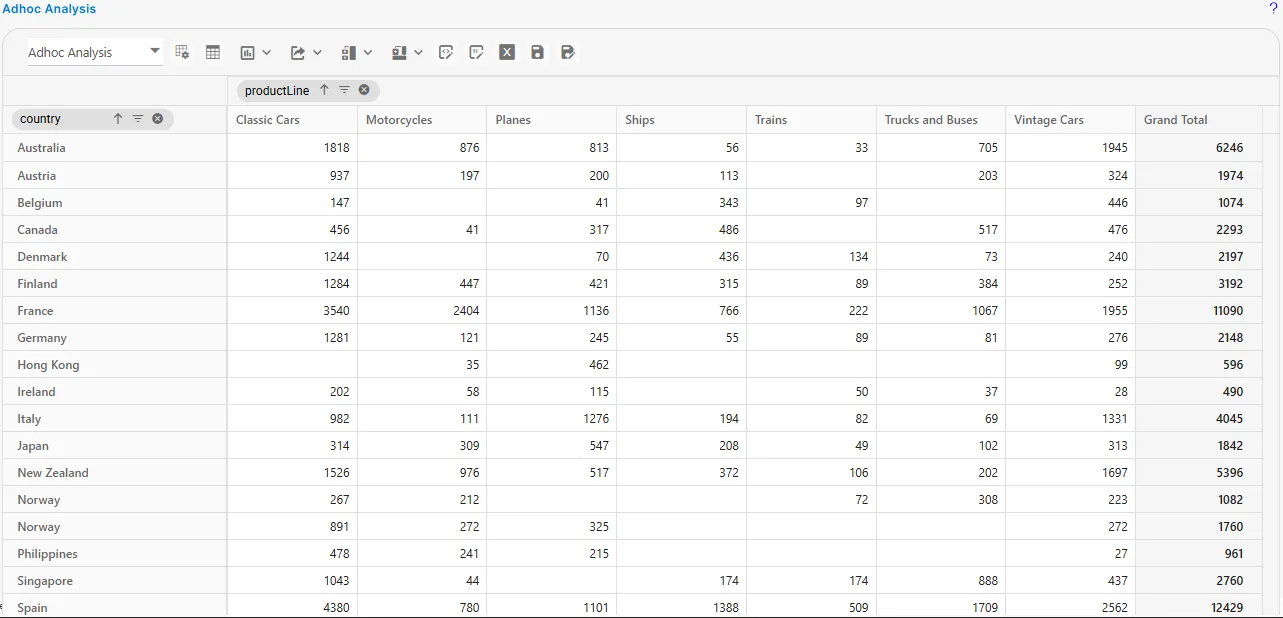
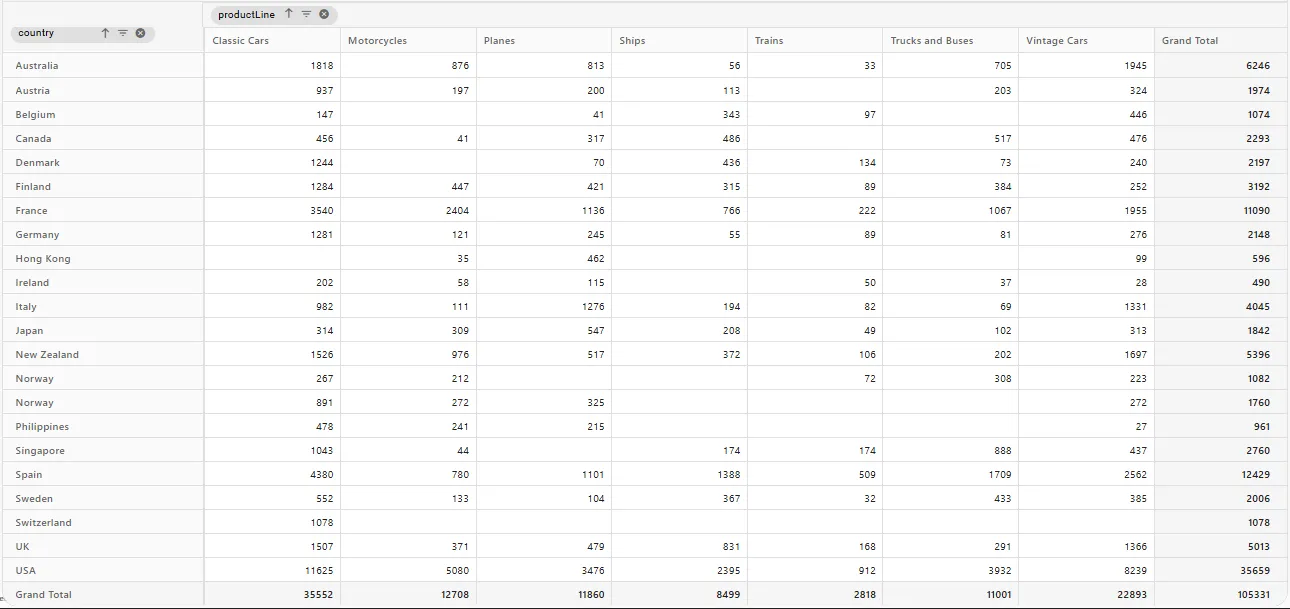
Click on the
 button to view the preview of the Adhoc Analysis.
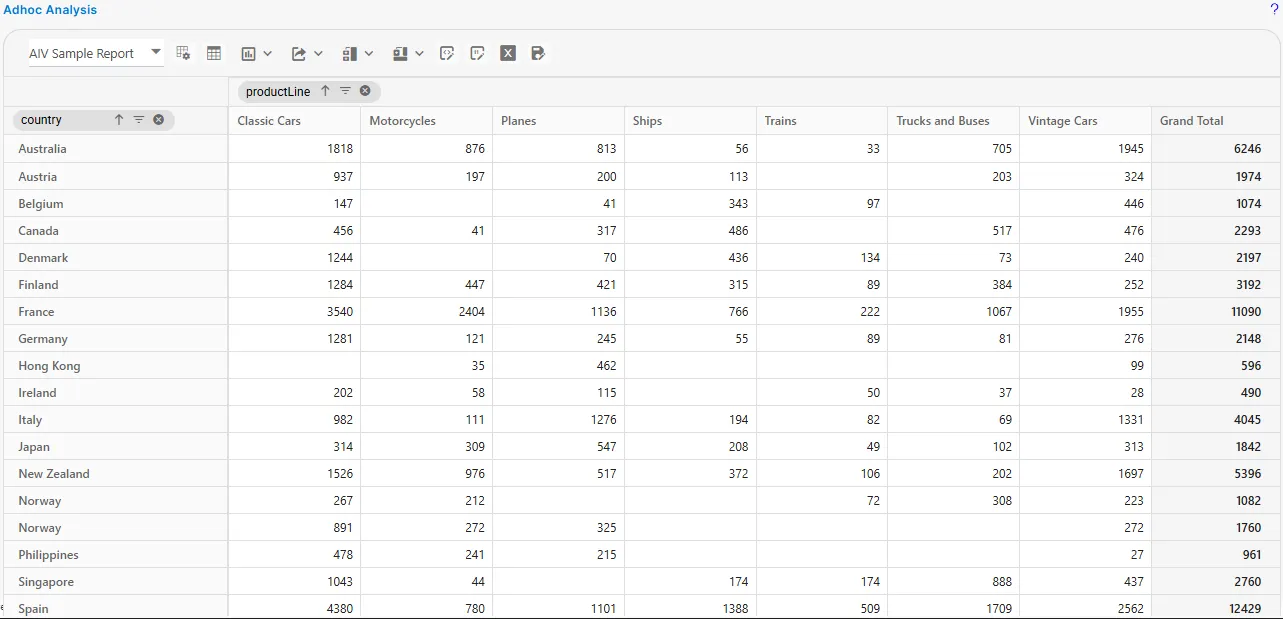
-
The analysis will have a default name, AIV Sample Report. Users can modify the analysis using the icons located at the top-left corner.
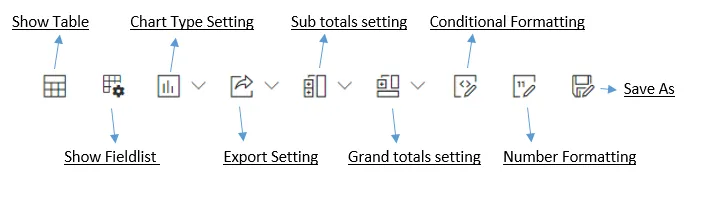
Save As
-
Initially, the Adhoc Analysis will be named AIV Sample Report. To save the analysis with a new name, click on the
 icon.
icon. -
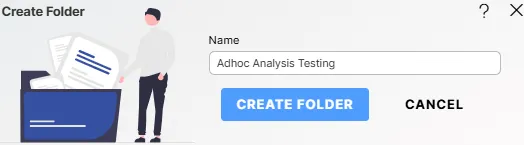
If you need a new folder, click on the Create Folder button next to the Save As button. A Create Folder dialog box will appear. Enter the folder name (e.g., Adhoc Analysis Testing) and click on the Create Folder button.
-
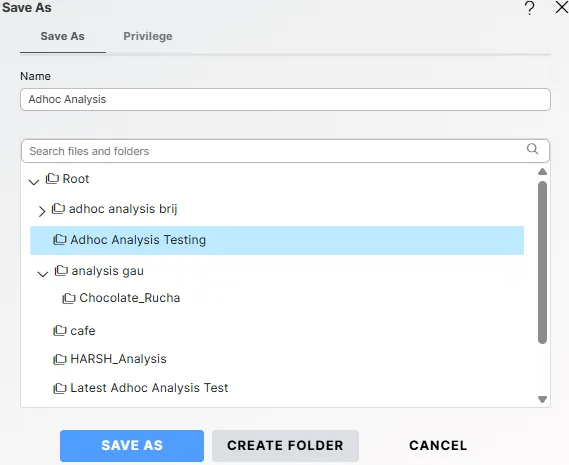
After creating the folder, enter a unique name for the analysis, select the desired folder from the tree view, and click the Save As button.
-
A success message will appear once the analysis is saved.

-
The saved analysis will then appear in the Analysis list.
Show Fieldlist
-
When the user clicks on the
 icon, they can modify the data used to create the analysis. For example, countrycode has been selected in place of country.
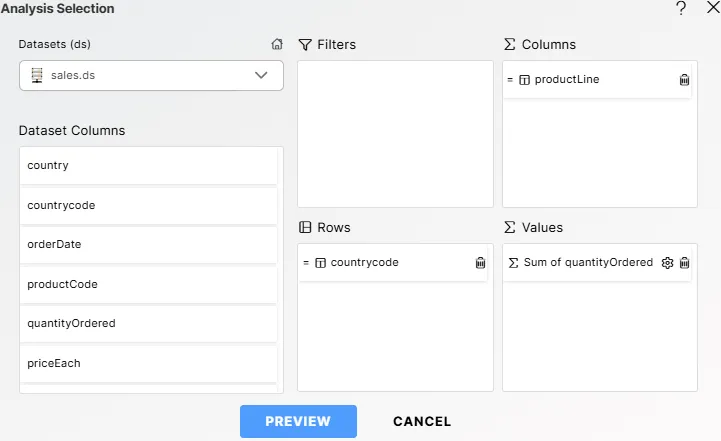
Chart Type Settings
-
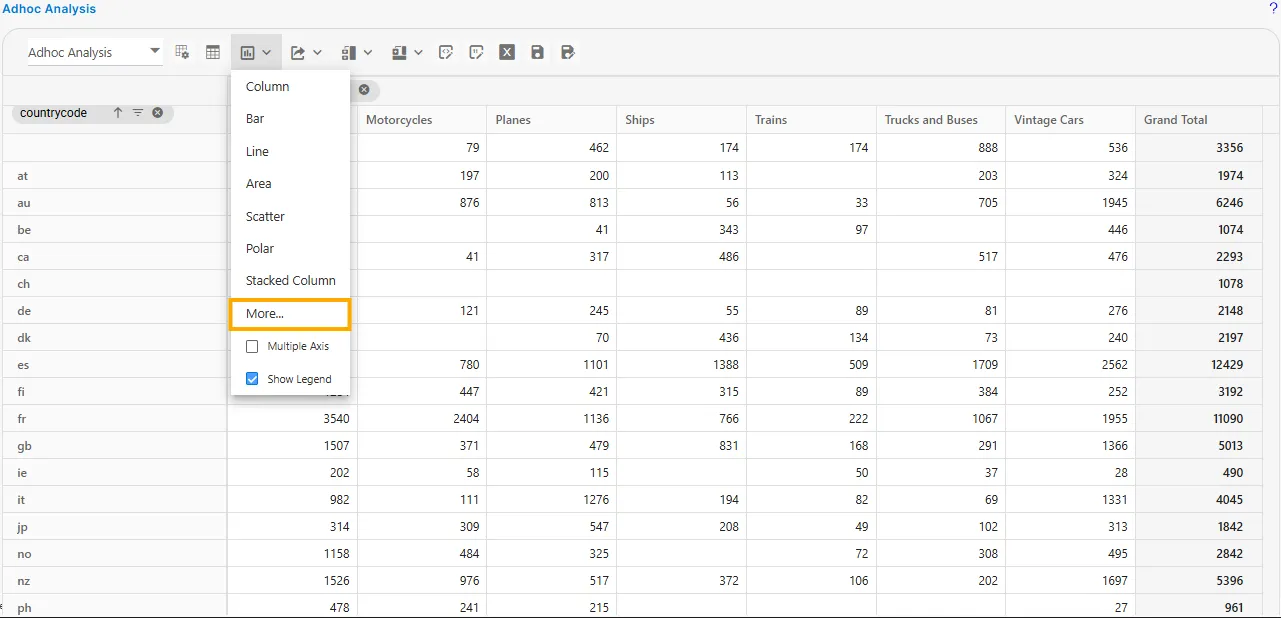
Click on the Chart Type Settings option to open the drop-down menu:
-
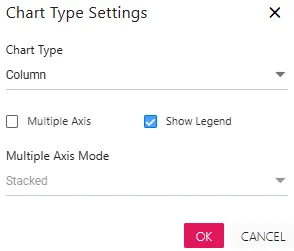
When the user selects More from the drop-down menu, additional chart options will be displayed. Enter the following details:
-
Chart Type: Column
-
Show Legend: This option is checked by default. Users can uncheck it if needed.
-
-
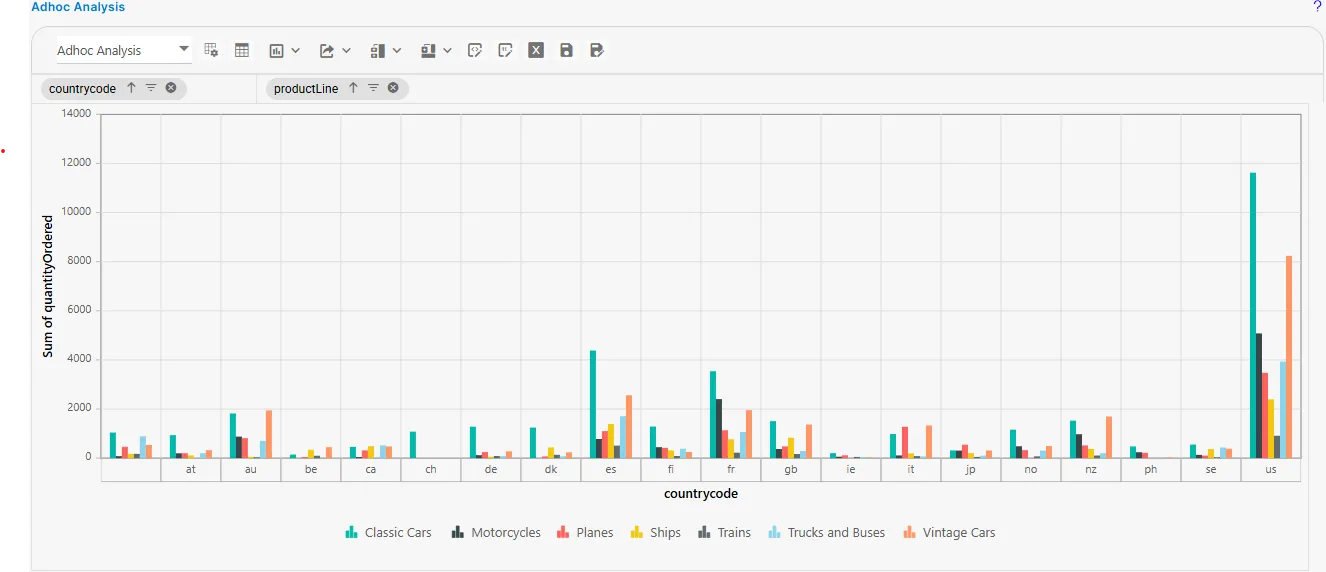
Click OK, and your analysis window will appear as shown below:
Show Table
-
When the user clicks on the
 icon, the table will be displayed again in the analysis window.
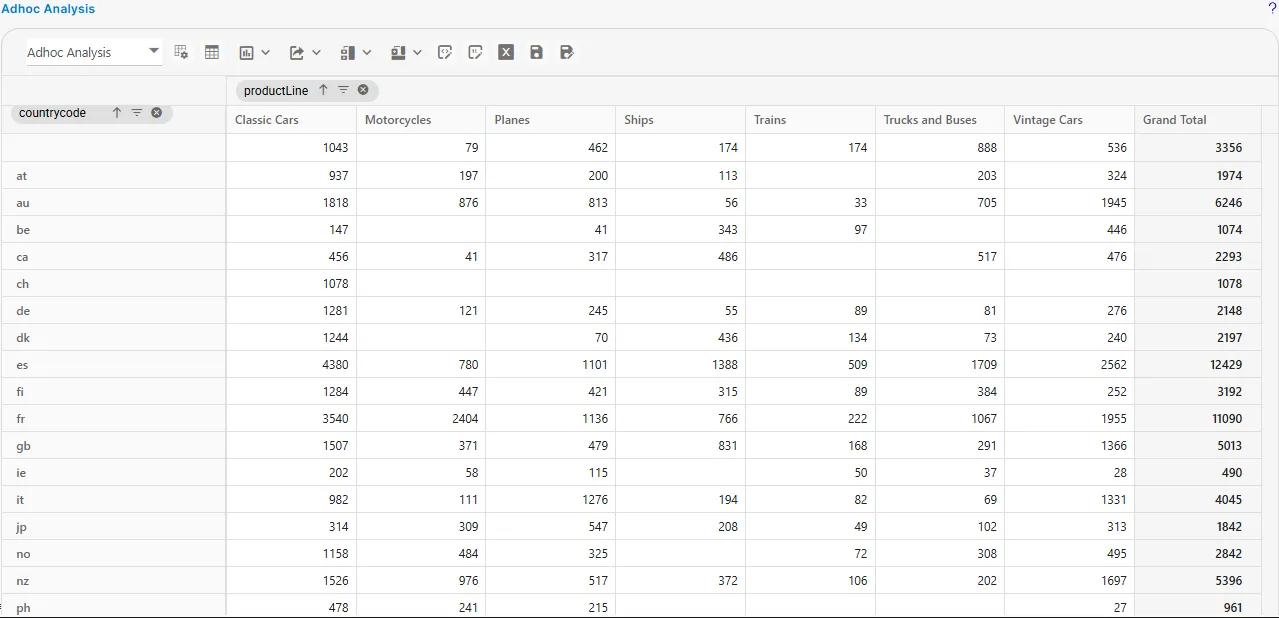
Export Analysis
-
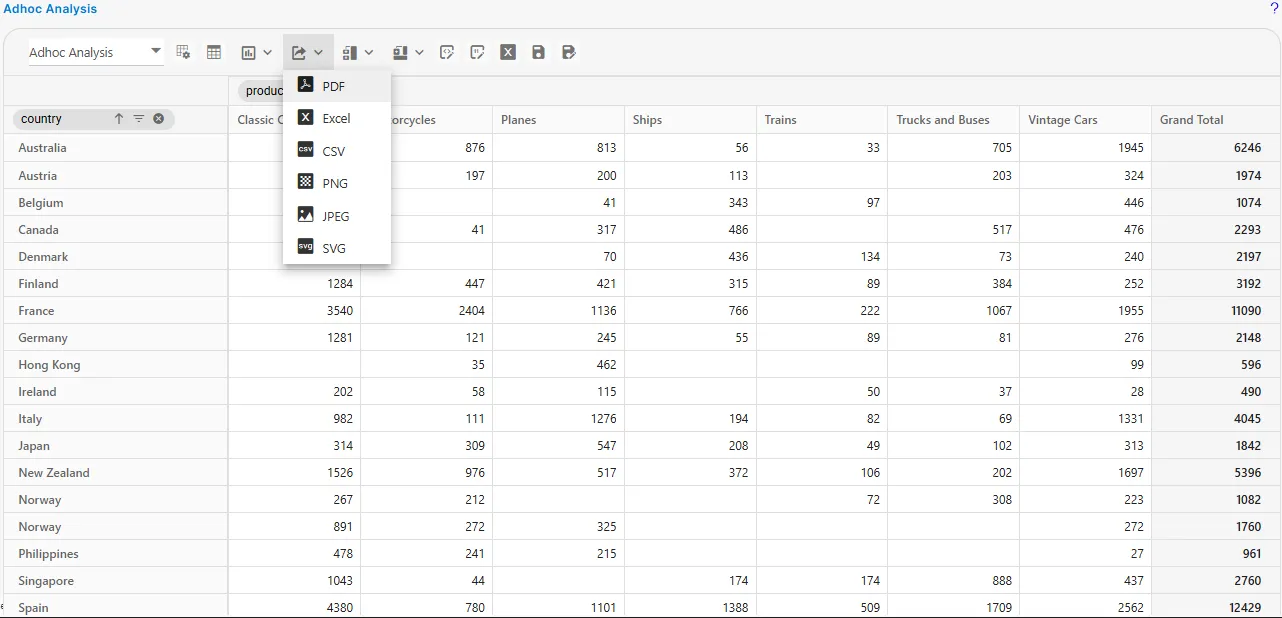
Users can export the analysis in various formats by clicking on
 icon. The available export formats include PDF, Excel, CSV, PNG, JPEG, and SVG.
 -
For example, when the user selects PDF from the dropdown menu, the browser displays a standard “Save As” dialog box, allowing the user to choose the file name and download location before saving the file.
Subtotals
-
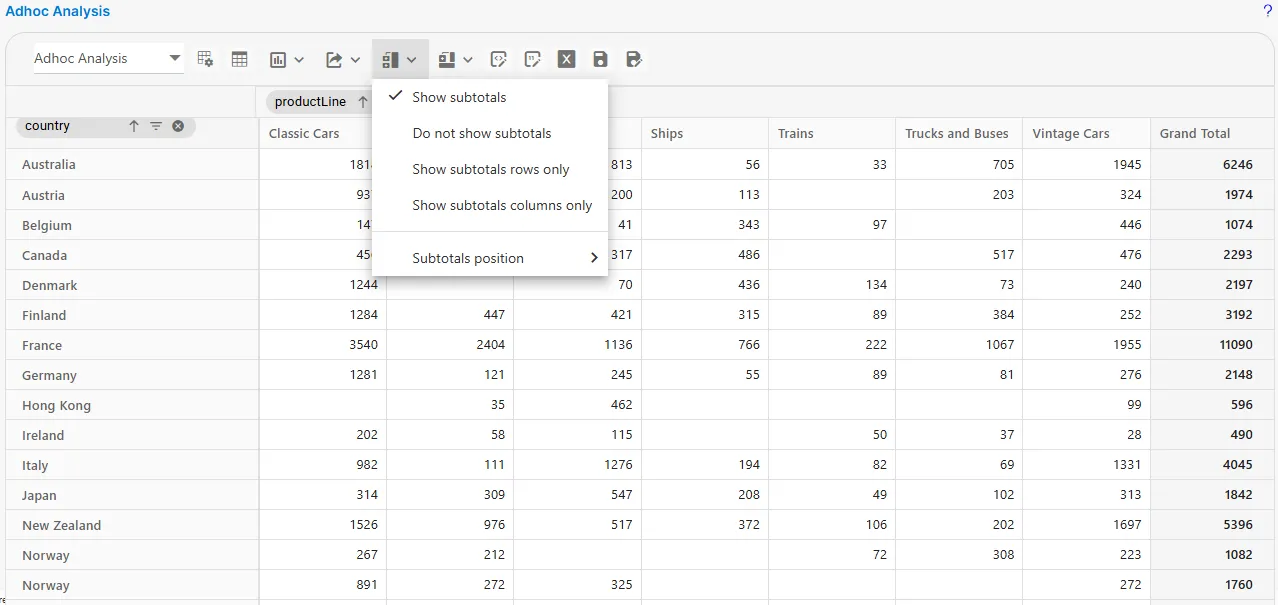
Users can manage subtotals by clicking on the
 icon, which provides options to Show subtotals, Do not show subtotals, Show subtotals rows only, and Show subtotals columns only.
 -
Users can adjust the Subtotals Position, choosing from Auto (default), Top, or Bottom.
Grand Totals
-
Users can manage Grand Totals through the
 icon, with options to show or hide grand totals, or display them only for rows or only for columns.
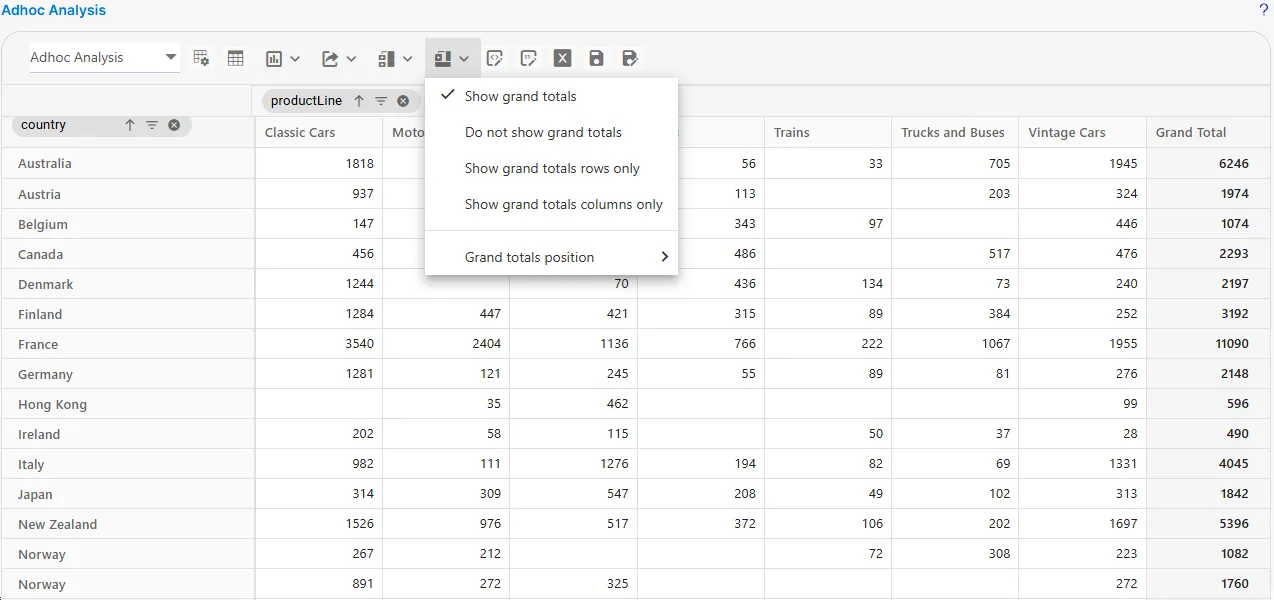
-
Users can also adjust the Grand Total Position, choosing whether grand totals appear automatically (default), at the top, or at the bottom.
Conditional Formatting
-
The Conditional Formatting feature allows users to change the appearance of table cells based on specific rules. Multiple conditions can be applied to the same table.
-
When the user selects
 icon > Add Condition, a configuration dialog appears. Enter the required details.
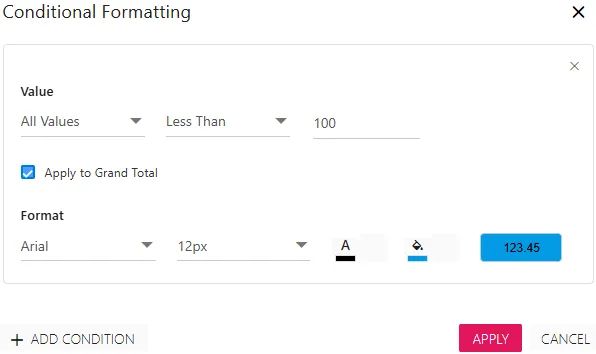
-
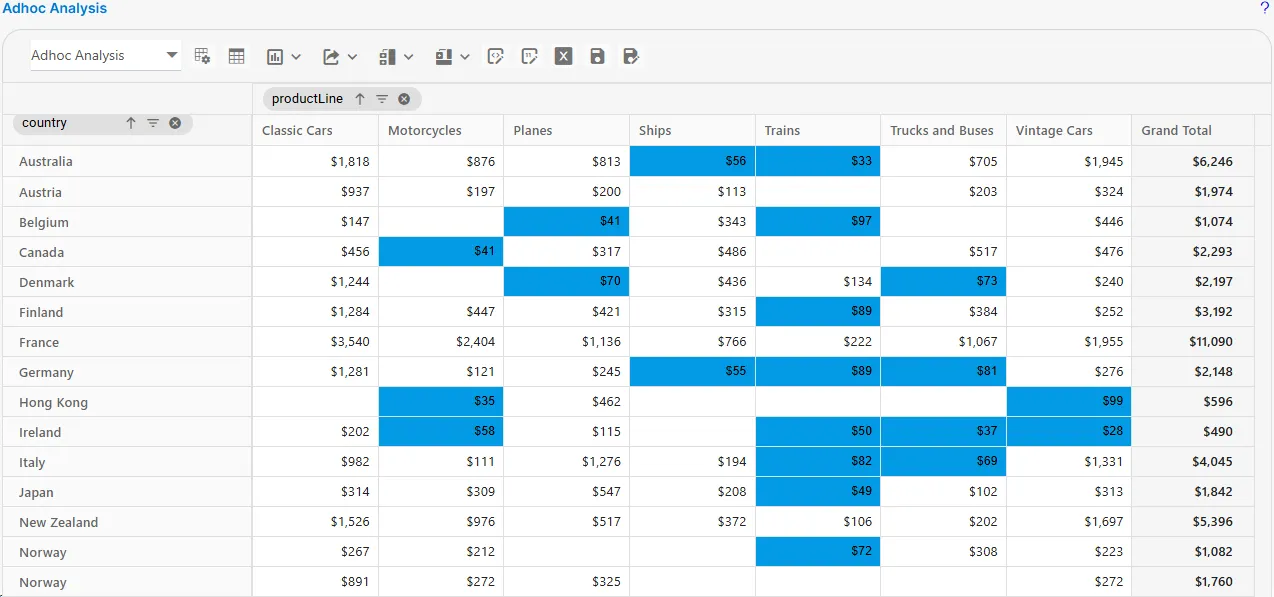
After clicking APPLY, the analysis view updates based on the defined rules.

Number Formatting
-
When a user clicks the
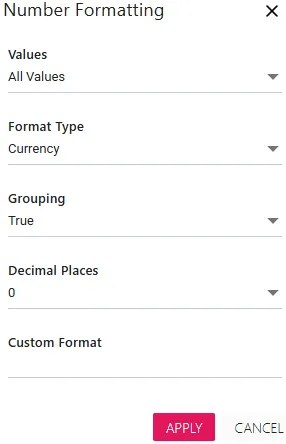
 icon, the following menu appears. Enter the required details as shown below:
-
Values: This dropdown provides two options. All Values and quantityOrdered. Users can select the appropriate option based on their requirements.
-
Format Type: This dropdown contains four formatting options. Number, Currency, Percentage, and Custom. Users can choose any format as needed.
-
Grouping: Allows users to enable or disable grouping by selecting True or False.
-
Decimal Places: Allows users to specify the number of digits to display to the right of the decimal point.
-
Custom Format: When the user selects Custom from the Format Type dropdown, the Custom Format field becomes active. Users can manually enter a formatting pattern to define how the numeric values should appear in the analysis.
-
-
When the user clicks the APPLY button, the analysis screen updates based on the selected number formatting settings.
Save
- When a user clicks the
 icon, the entire analysis file is saved.