Trend Line
General Property: This video contains how to use general property of trendline for chart in AIV.
- A Trendline is a line drawn over chart’s highs or under chart’s lows to show the prevailing direction of price. Trendlines are a visual representation of support and resistance in any time frame. They show direction and speed of price, and also describe patterns during periods of data contraction.
- Once the user clicks on the Plus icon (+), a new Trend Line gets added in the charts and the four control menu appear as shown in figure below:
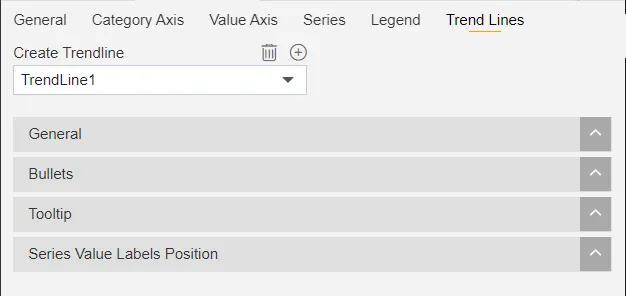
- General controls the TrendLine appearance related functions:
-
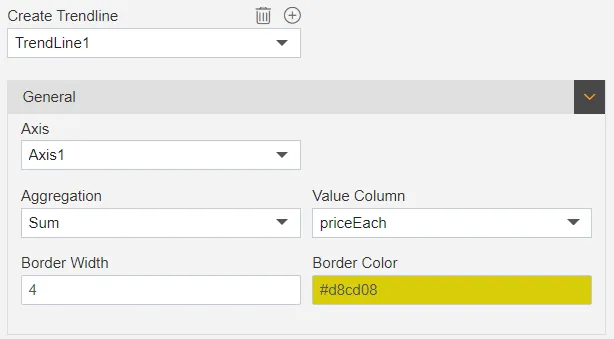
Axis: In this option, user can select the available axis in widget.
-
Aggregation: This type of display is useful if you want to present summarized results in charts.
- Following types of aggregation are available:
-
Count.
-
Sum.
-
Avg.
-
Distinct Count.
-
Cumulative Count.
-
Cumulative Sum.
-
Absolute Sum.
-
Max.
-
Min.
-
First.
-
Last.
-
Value Column: Used to select the value column for Trend Line.
-
Border Width: to make changes to the width of the border of the trend line.
-
Border Color: to make changes to the color of the border of the trend line.