Value Line
Value Axis Line: This video contains how to use Value Axis Line of Chart in AIV.
-
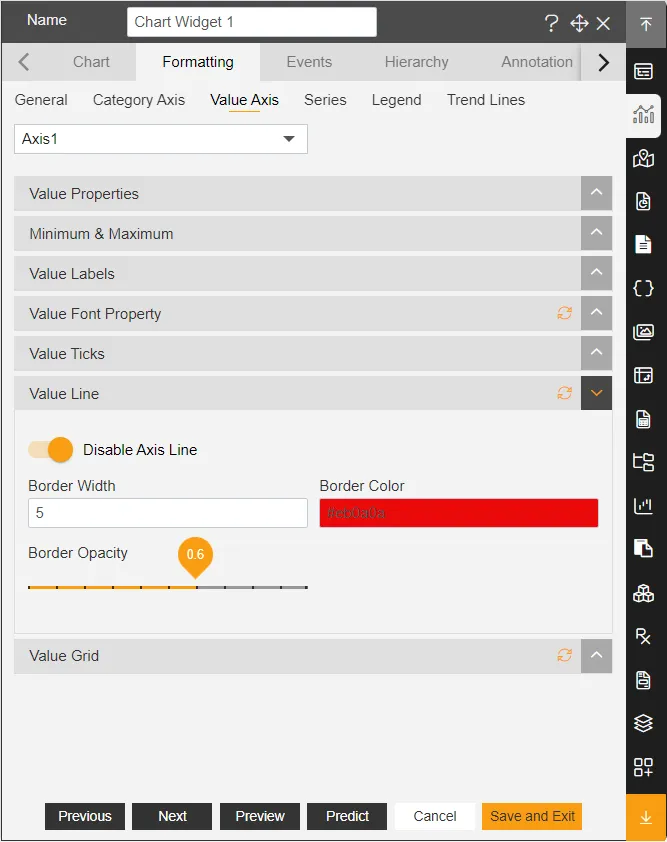
In Formatting Property click on Value Axis Property.
-
The toggle button is enabled by default that’s why it shows disabled Axis Line in below Figure.
-
Enter following details in Value Line:
- Border Width: 5
- Border Color: #eb0a0a
- Border Opacity: 0.6
-
The Border width is used to set the width of line.
-
Border opacity is used to set the visibility of the value axis line in chart.
-
Border Color is used to control the color of the value axis line, from color, user can also control the opacity and choose color from color code.
-
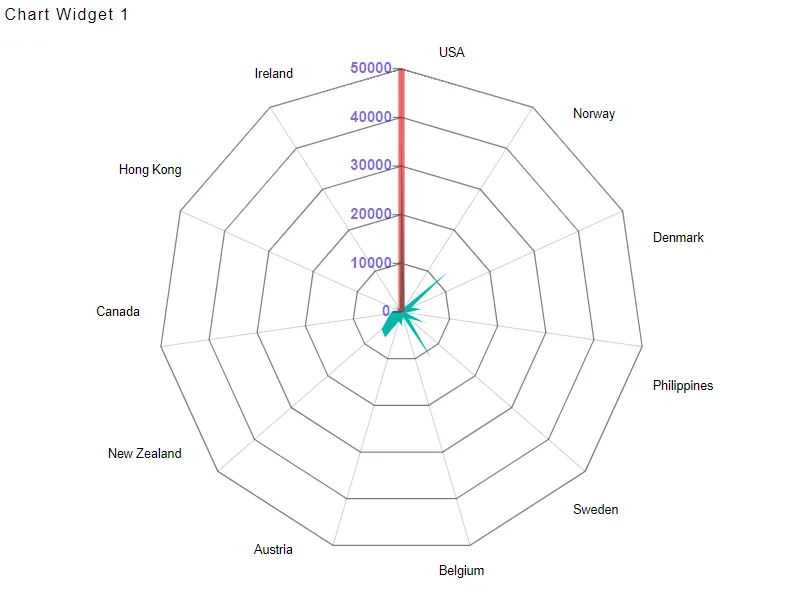
Click on Publish button.
-
Now, match your Radar chart with the below example, it should look like the figure below:
To know more about other Value Axis property click on below links:-
Value Axis Font Property
Min & MAx Value Property
Value Axis Labels
Value Axis Property
Value Axis Ticks
Value Grid