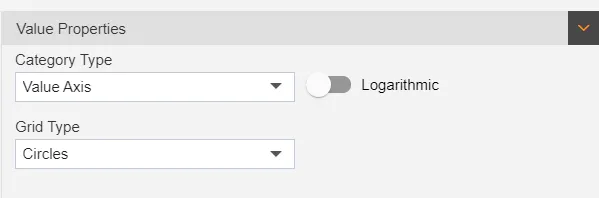
Value Properties
Value Axis Property: This video contains how to use Value Axis Properties of Chart in AIV.
- Category Font Property: used to make changes in the value axis data.
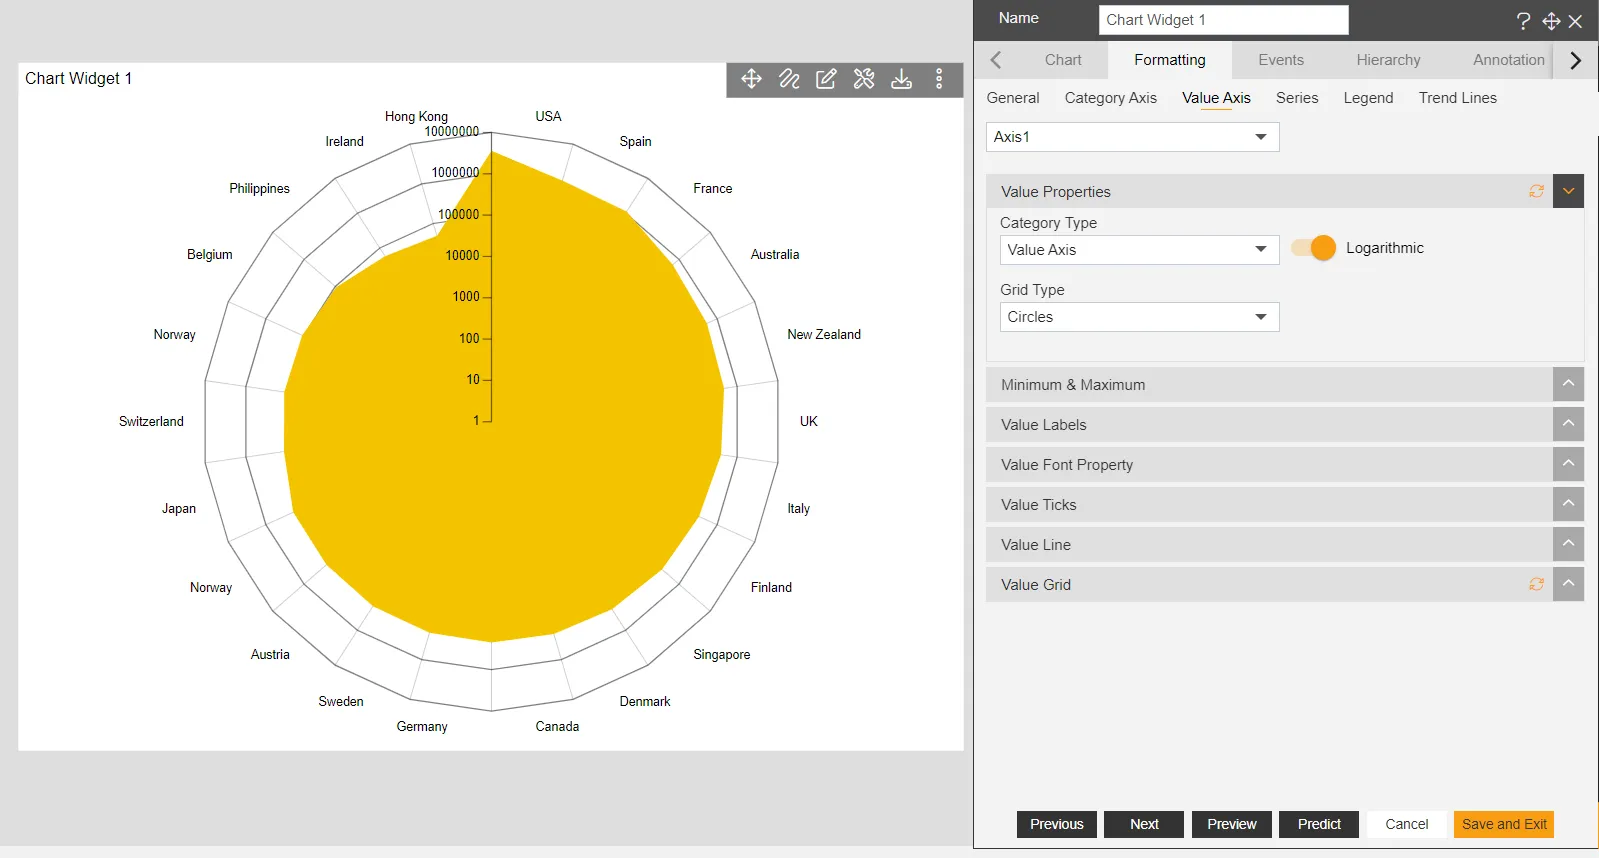
- Go to Edit Menu > Formatting tab > Value Axis > Value Properties.
- Logarithmic: user can enable this when user wants the value axis data to be in logarithmic format.
-
Category Type: This dropdown contains Value Axis & Duration Axis.
-
Value Axis: by selecting this option user can see their value format. (Value Axis is selected as default)
-
Grid Type: There is 2 option in this dropdown: Circles & Polygons. User can select any of this as required.
-
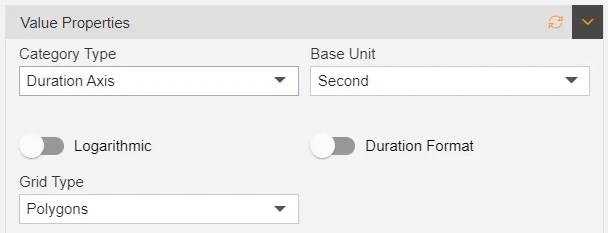
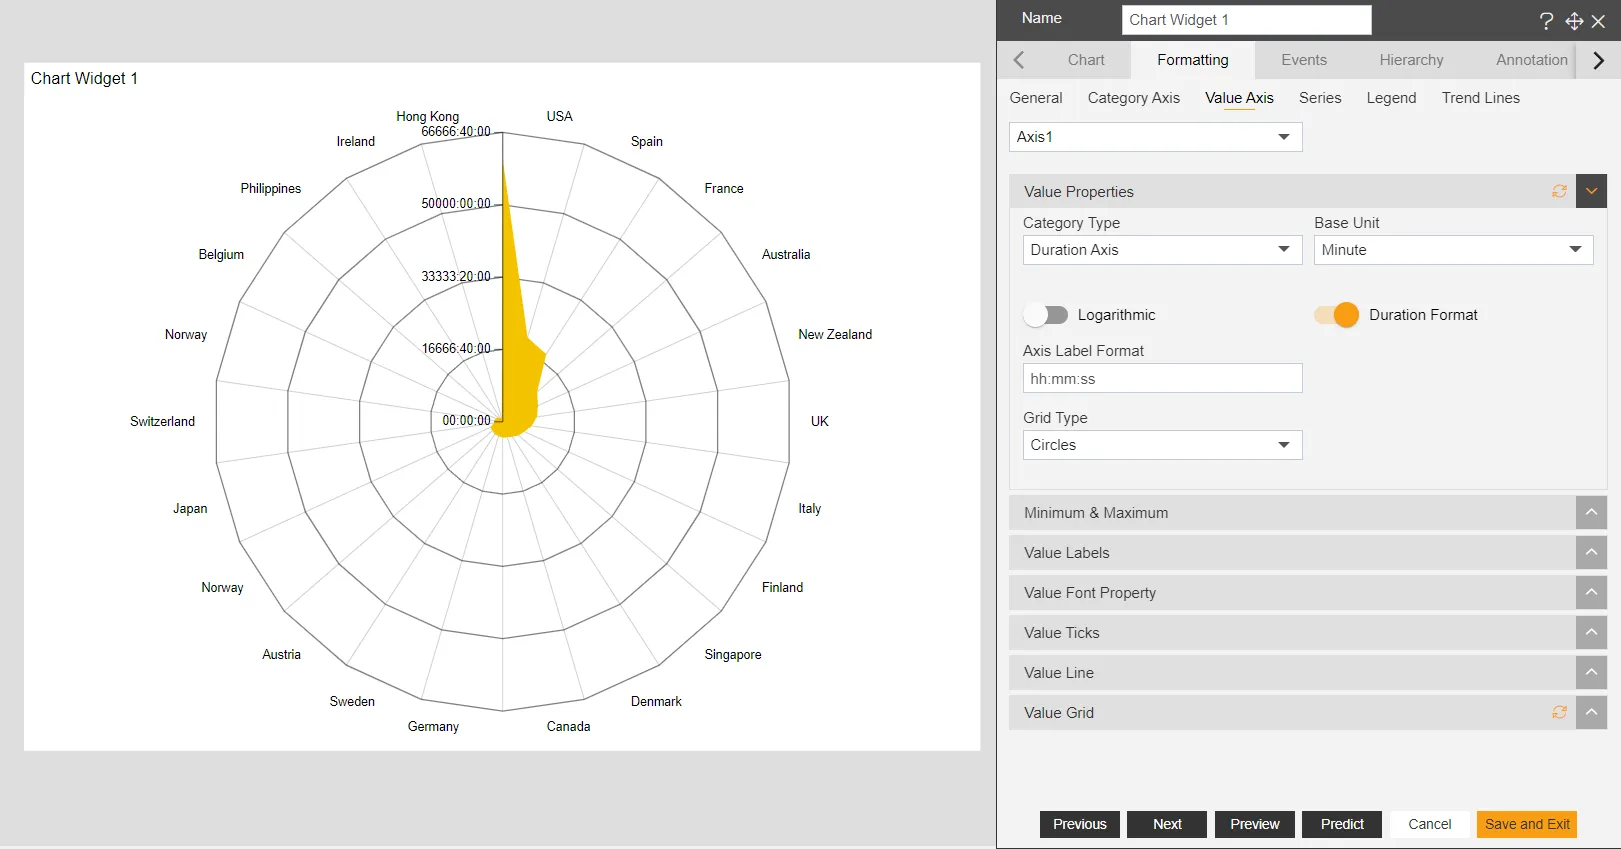
Duration Axis: by selecting this option user can see their data in duration format.
-
When user selects Duration Axis other option appears as shown in the image below:
-
Base Unit: This function has 3 option in dropdown: Second, Minute & Hour. User can select that option as they decide that they want data in which format.
-
When user enables Duration Format option, new box will appear as shown:
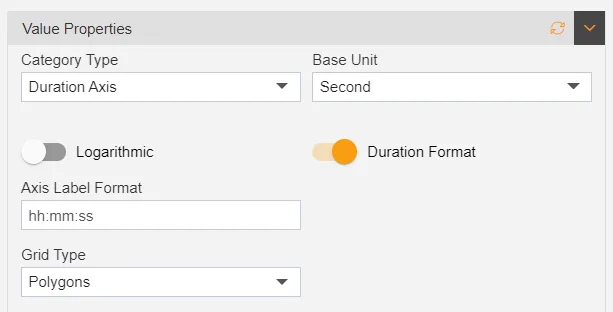
- Axis Label Format: User can set this format as required.
To know more about other Value Axis property click on below links:-
Value Axis Font Property
Min & Max Value Property
Value Axis Labels
Value Axis Line
Value Axis Ticks
Value Grid