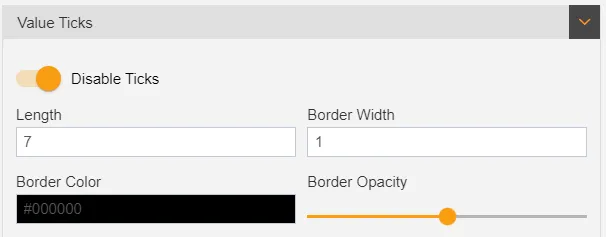
Value Ticks
Value Axis Ticks: This video contains how to use Value Axis Ticks of Chart in AIV.
-
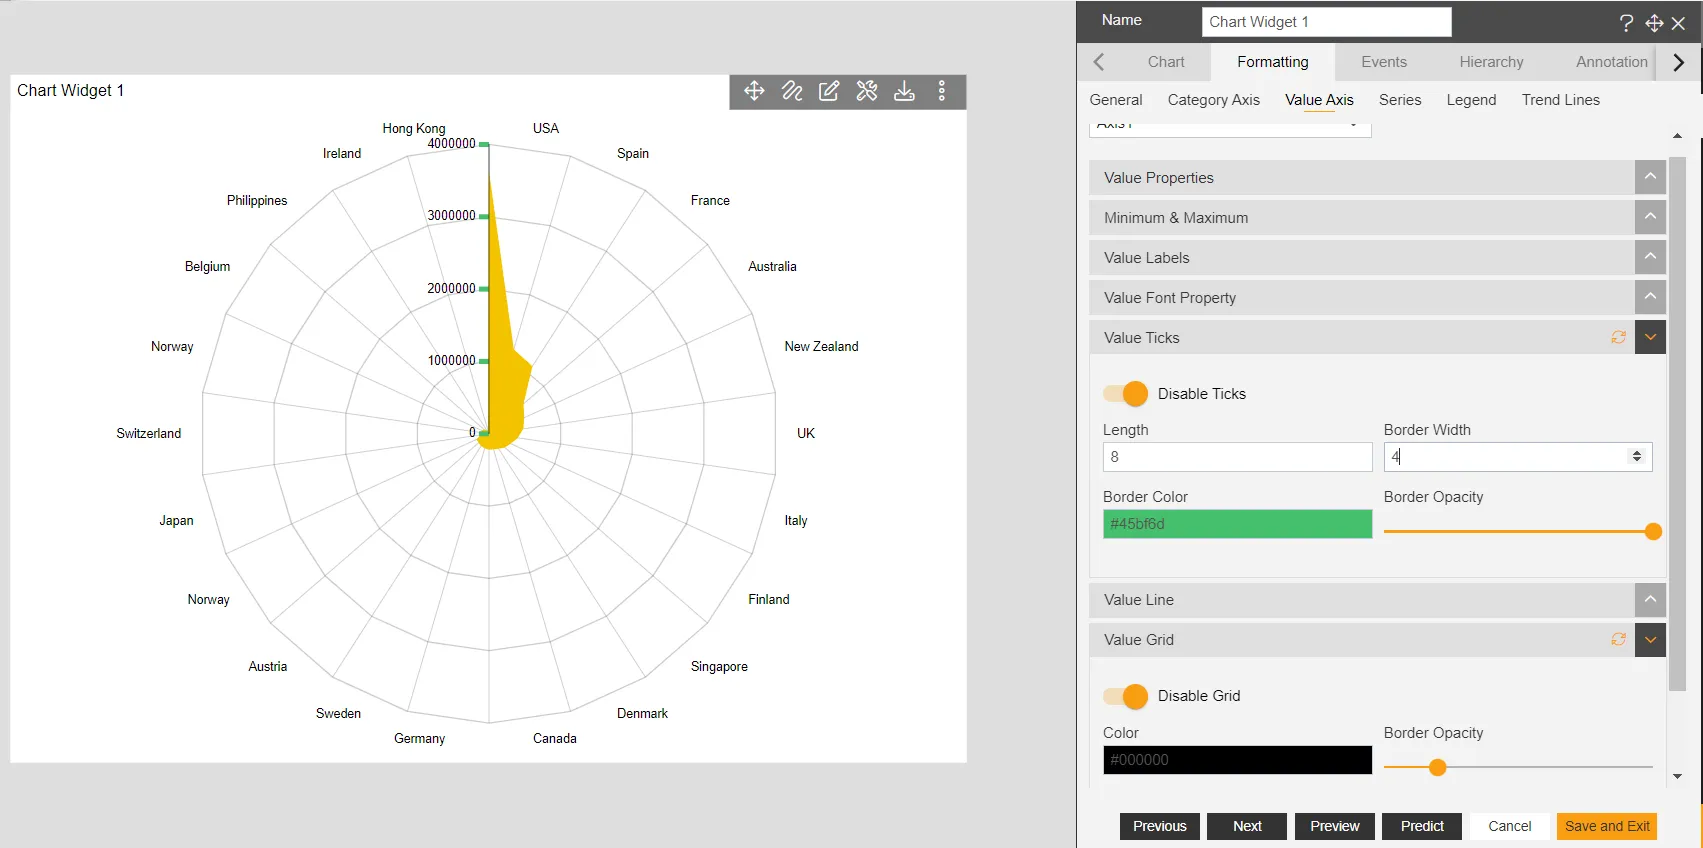
Value Ticks: used to show the ticks on the radar chart.
-
Go to Edit Menu > Formatting tab > Value Axis > Value Ticks
-
Value Ticks are enable as default.
-
Length: by using this option user can set the length of Ticks on Value Axis.
-
Border Width: by using this user can make the changes on the width of Value Ticks.
-
Border Color: used to set the color of value ticks. User can select any color from the color palette.
-
Border Opacity: user can set the visibility of the value ticks.
To know more about other Value Axis property click on below links:-
Value Axis Font Property
Min & MAx Value Property
Value Axis Labels
Value Axis Property
Value Axis Line
Value Grid