Layer to layer filter
Introduction
This document explains how to apply filters across the layers and what are the ways where the user can perform layer-to-layer filtering. In a dashboard, you can create multiple visualization solutions by using tabs & Layers. It is possible to create multiple visualizations for single solution in a single dashboard and you can also show Multiple visualizations of different domains in a single dashboard using the tabs as well as layers feature provided in the Application.
Objective
The objective of this document is to guide a user to perform layer-to-layer filtering in the dashboard in multiple ways.
Prerequisites
User will required following dataset to understand tab to tab filter scenarios:
- sales.cds dataset
- Parameter sales.ds dataset
Download above dataset by [clicking here](PROVIDE DATASET ZIP LINK HERE). extract this file and upload dataset in dataset section using drag and drop.
Use case
Generally, the best practice is to show multiple visualizations for a whole solution in a single dashboard. there might be scenarios where the information we want to display in a dashboard is very high and we can not accommodate all the visualization widgets in a single window. in such cases, we should group the number of visualizations into some categories and create visualizations in different tabs for each category. By doing this we are making sure all the required information is presented in a single dashboard and the user can relate each category’s data with the other category by switching tabs.
We have a sample dashboard to explain this scenario, kindly click on this link to go to the sample dashboard.

1. By using auto link
This option will only work if you are using same dataset across all the tabs.
-
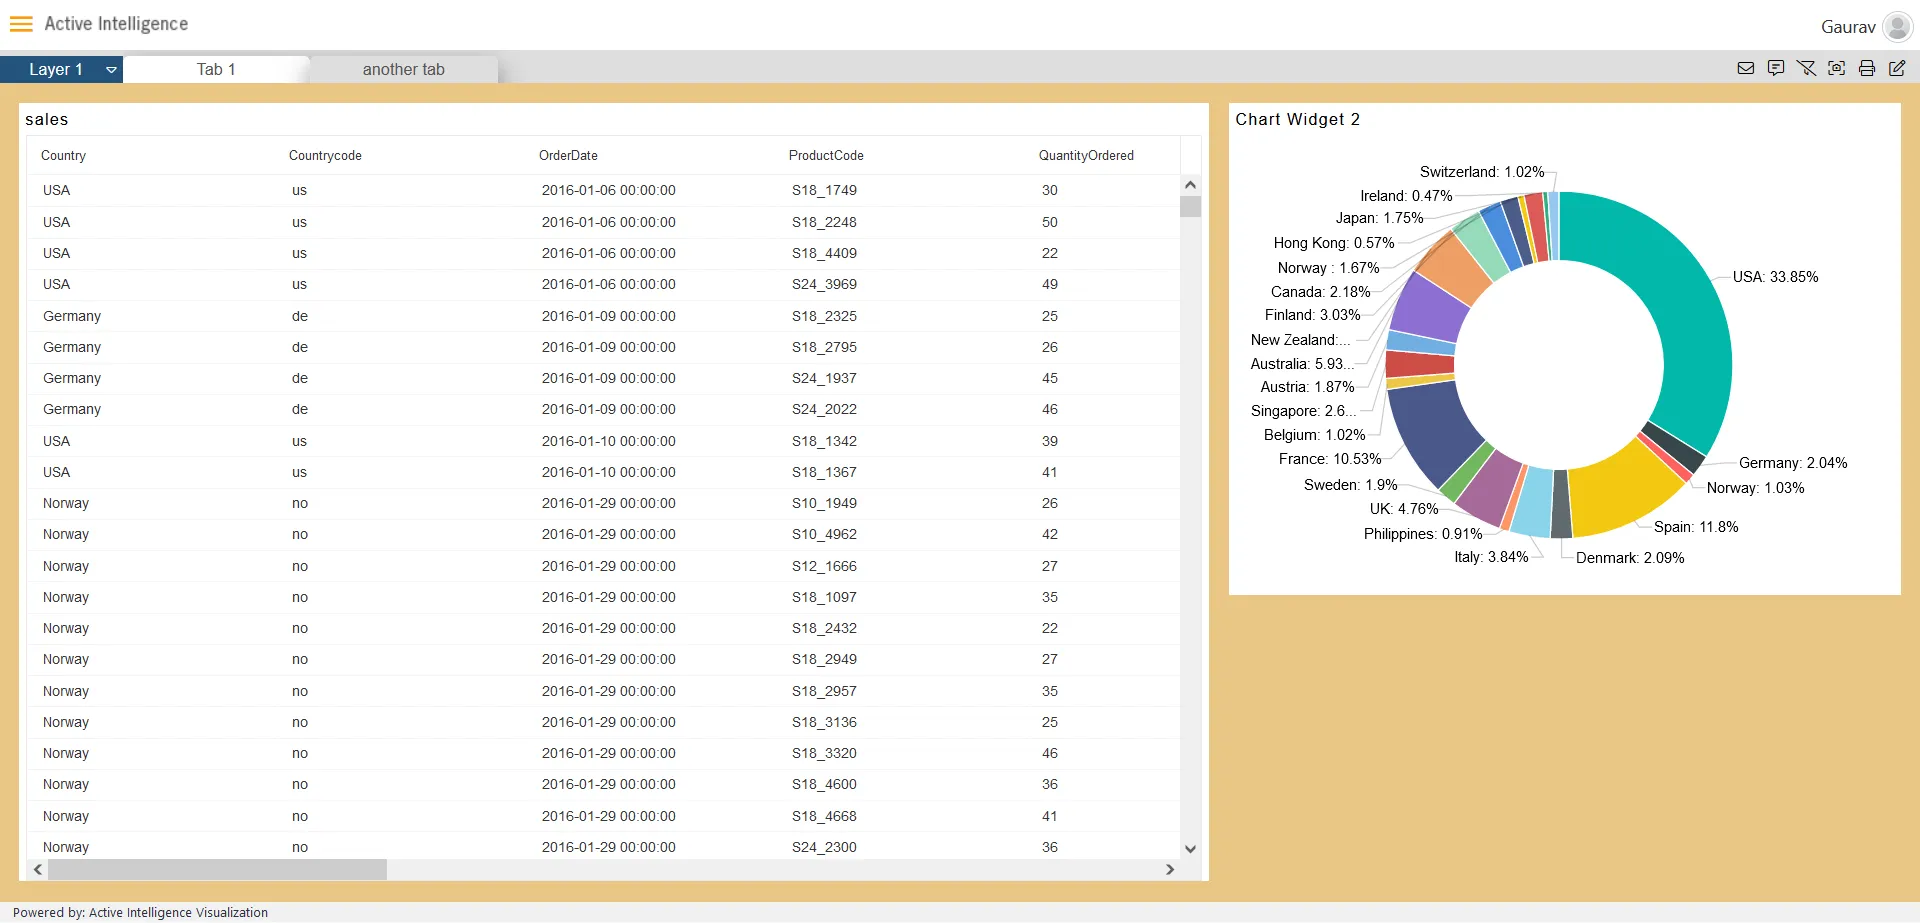
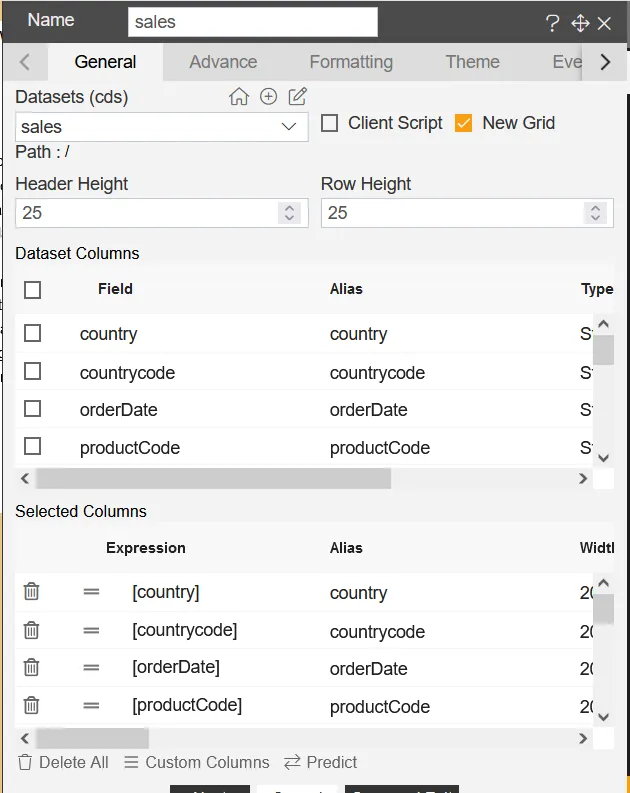
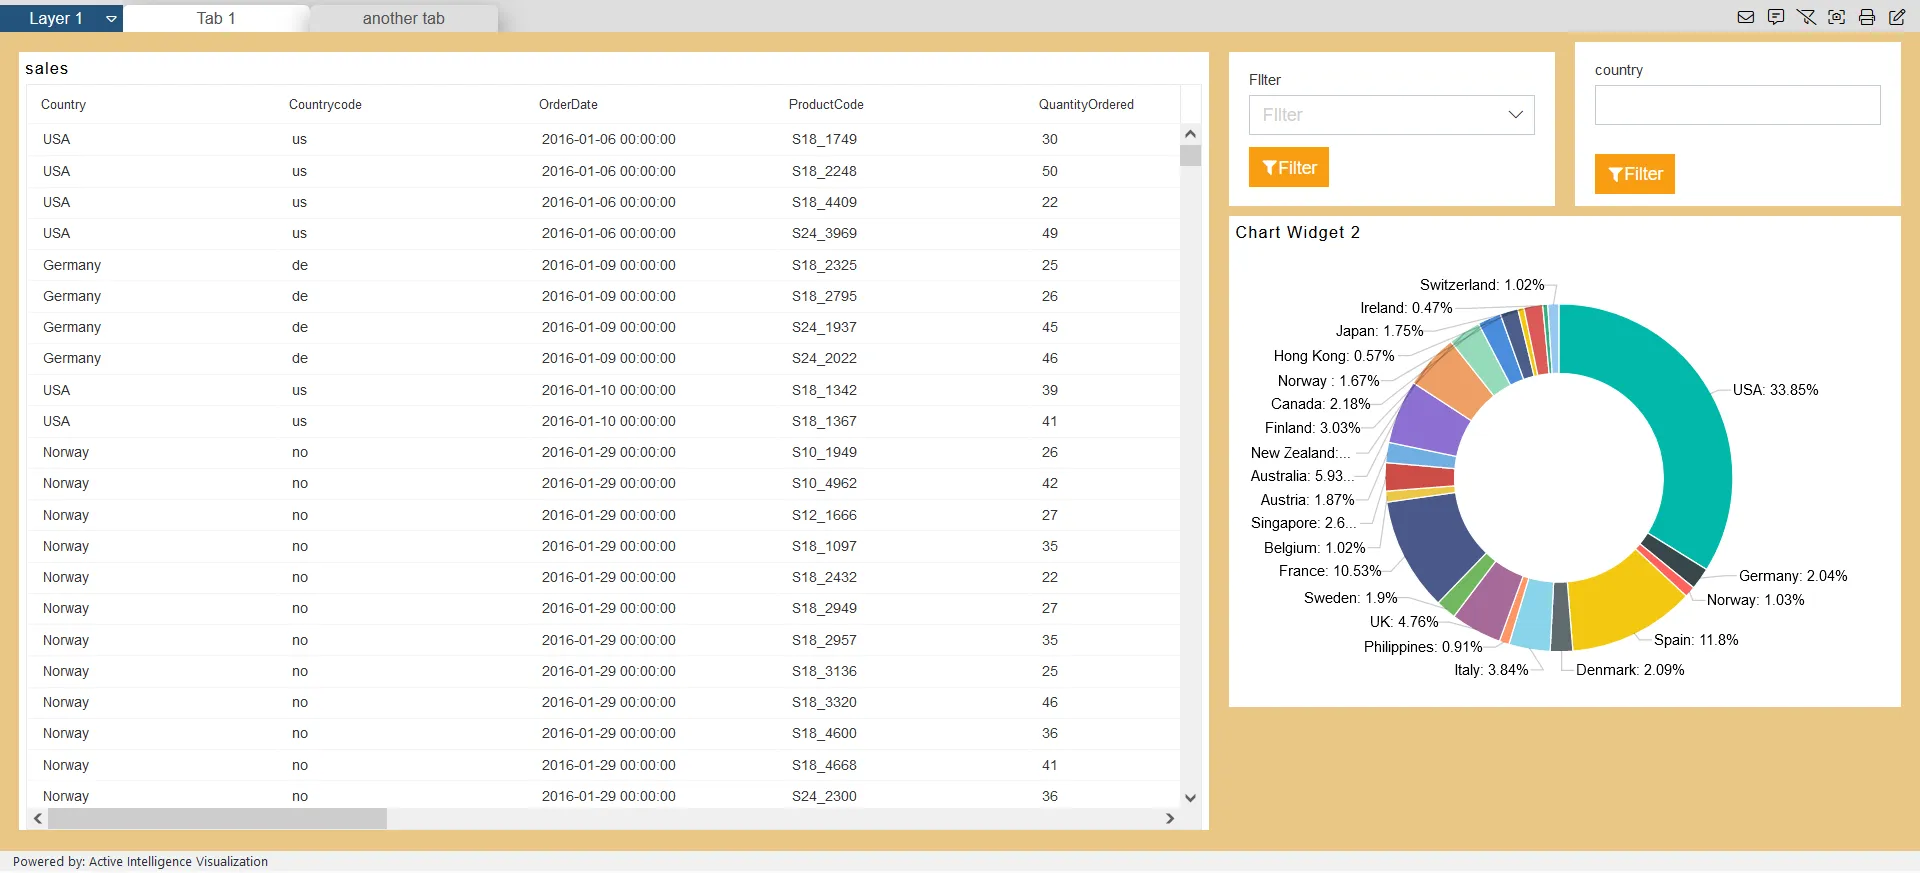
Create a new dashboard and add a new table widget using sales.cds dataset.
-
Select all columns form the Dataset Columns, as you select all the columns the selected columns will appear in the selected columns box.
-
Click on save and exit to save the changes.
-
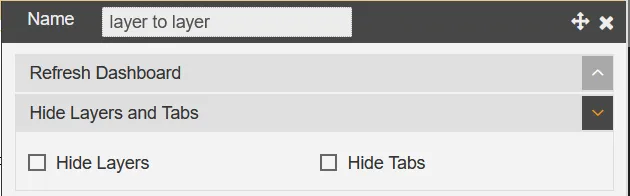
Now, If layers are not visible then click on the dashboard settings from the top-right coner and select the Hide Layers and Tabs settings option and uncheck the Hide Layers option.
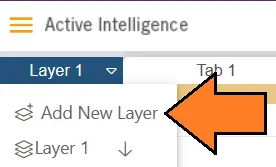
- Add new layer using the top-right corner layer icon, Click on the Add New Layer button.
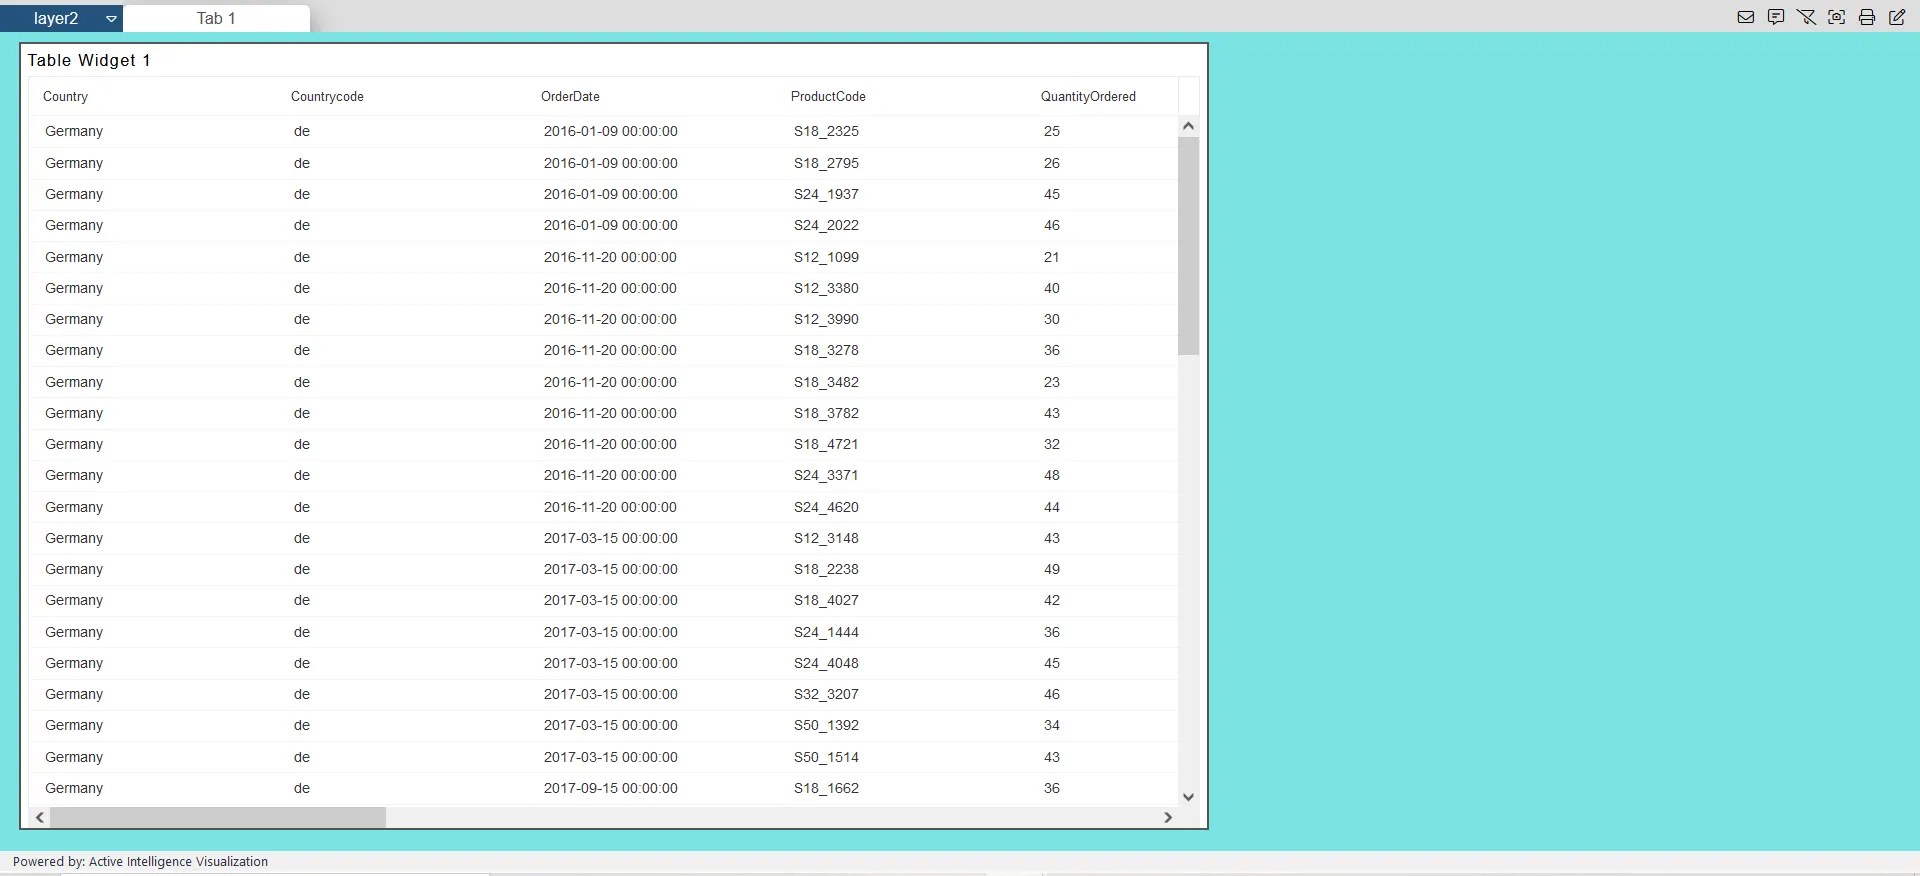
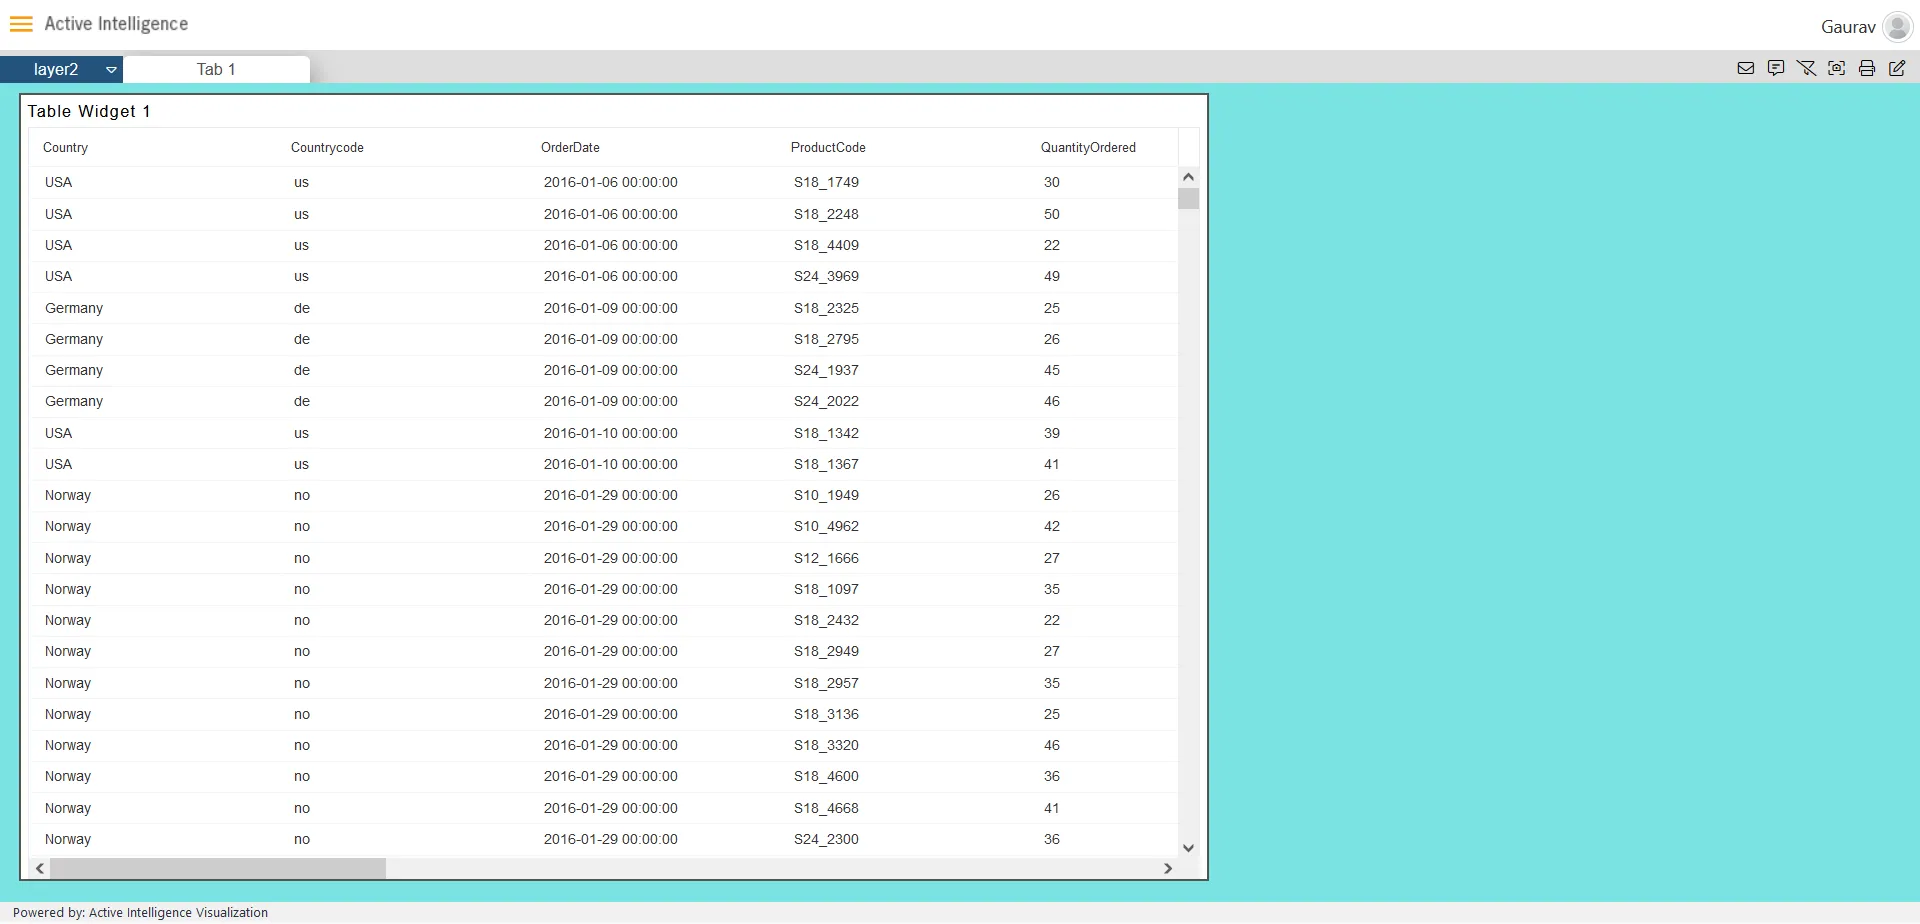
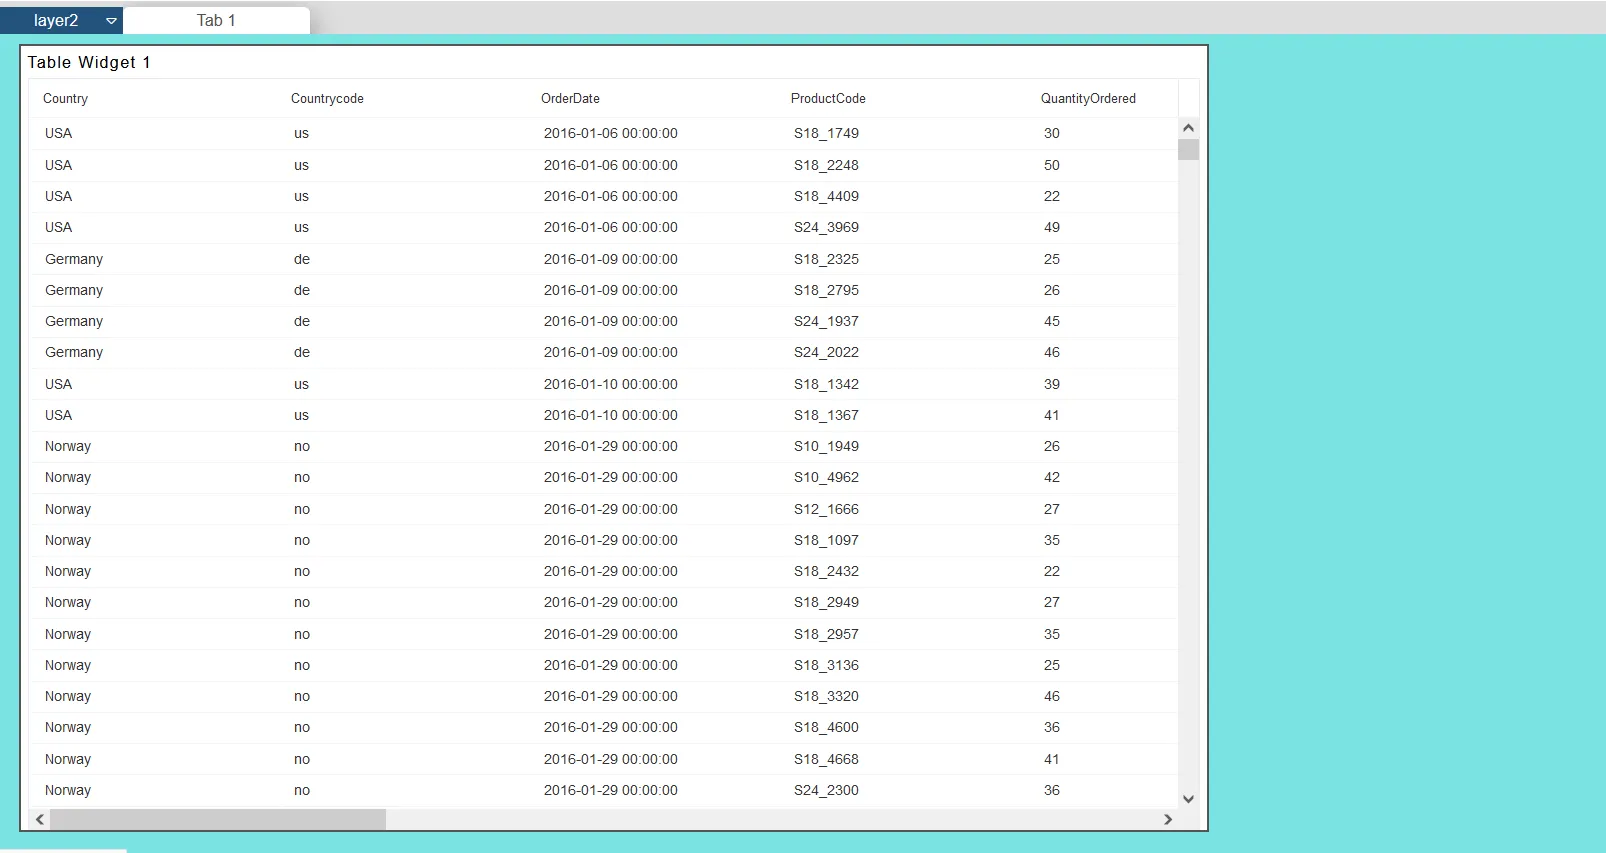
- From the Layer 2, Add table widget using the sales.cds dataset. (We are using the same dataset used in the Layer 1)
-
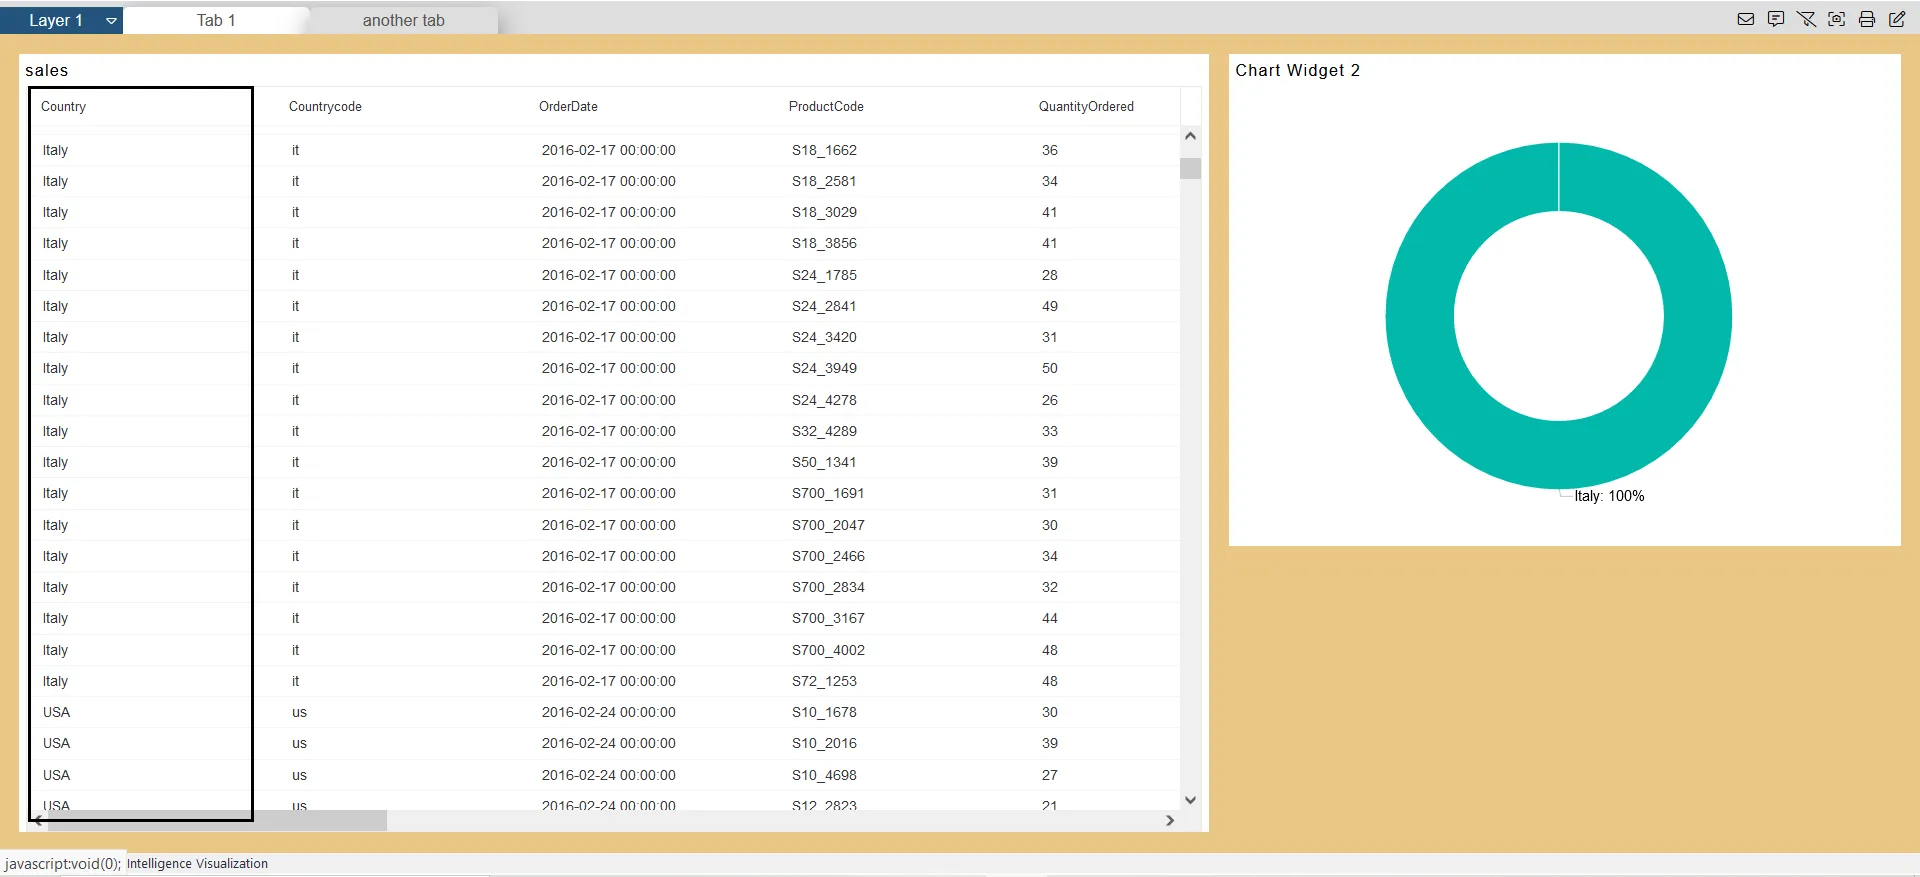
Now, Go to the Layer 1 and select any country from the table widget of tab 1, and it will filter the same country in the table widget of the Layer 2.
-
As you can see in the below screens, we have selected the field Italy from Country and the widget from the layer 2 took that selected value.
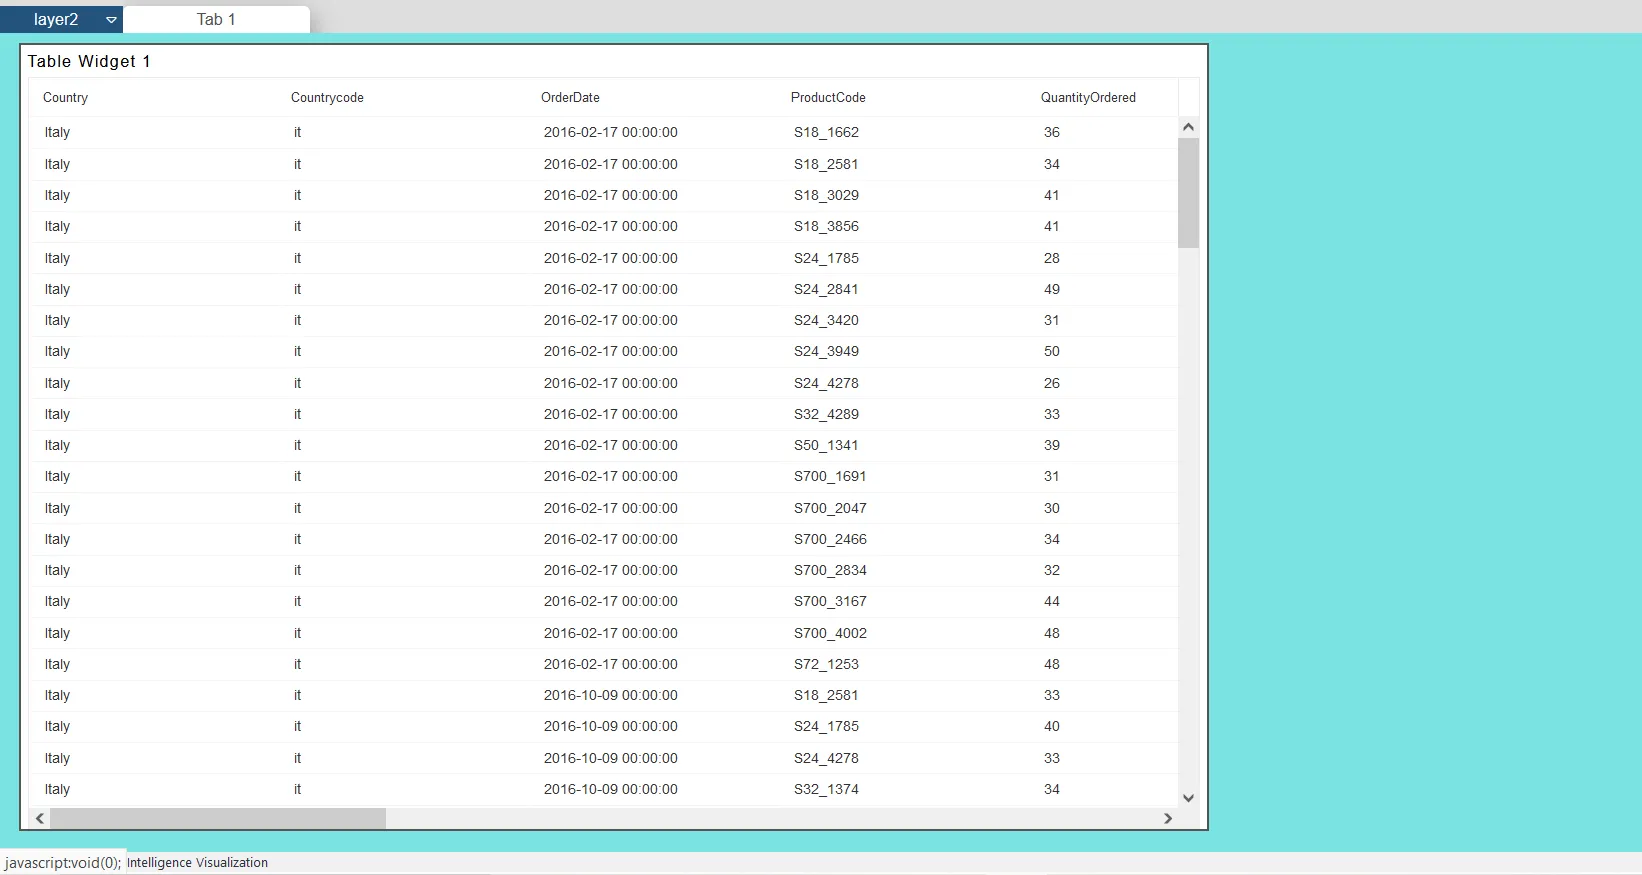
- The widget from tab 1 of the second layer took the country like Italy, as shown in the figure below
- That is how autolink is working. if you have used the same dataset in all the tabs to create a widget, all the widgets are automatically linked with each other. this auto link feature is enabled by default for each widget in the application.
- To disable auto link, hover on any widget and you will see a setting icon, click on that icon and setting window will open.
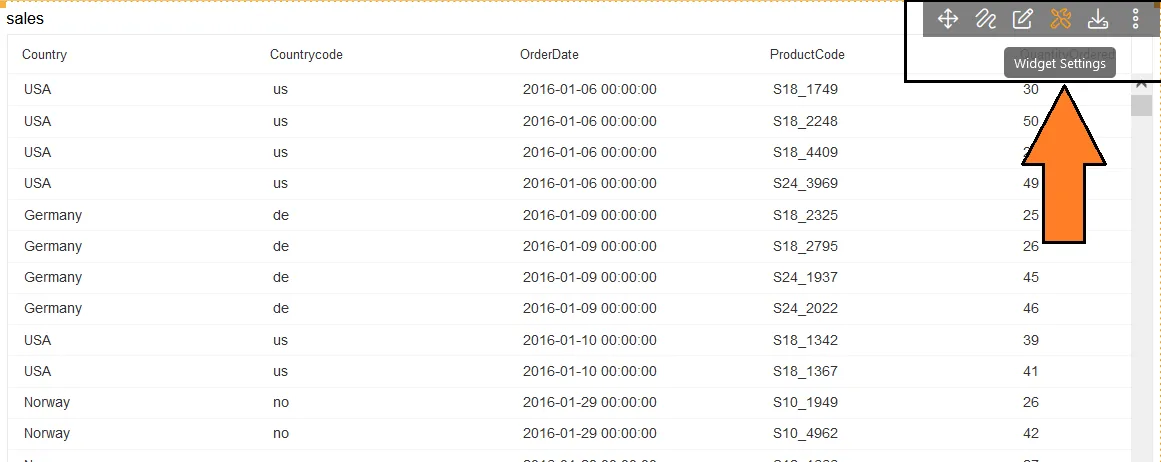
-
Expand Dynamic Auto link option and deselect Auto link option and click on save and exit to save the changes.
-
Go to dashboard preview mode and again click on column chart values and check this time chart in tab 2 is filtered. clear this filter and go to tab 2 and click on any slices of pie chart and go to tab 1.
- But this time, column chart is not filtered as we have disabled Auto link option from settings option.
- Same way if you do not want your widget to get filter by auto link, go to settings and disable it.
2. Dynamic widget link
This Feature will be usefull when you have different datasets across the dashboard and still you want to filter each widget from any one widget in dashboard.
-
Let’s consider above dashboard example, disable auto link in both the widget and save the changes.
-
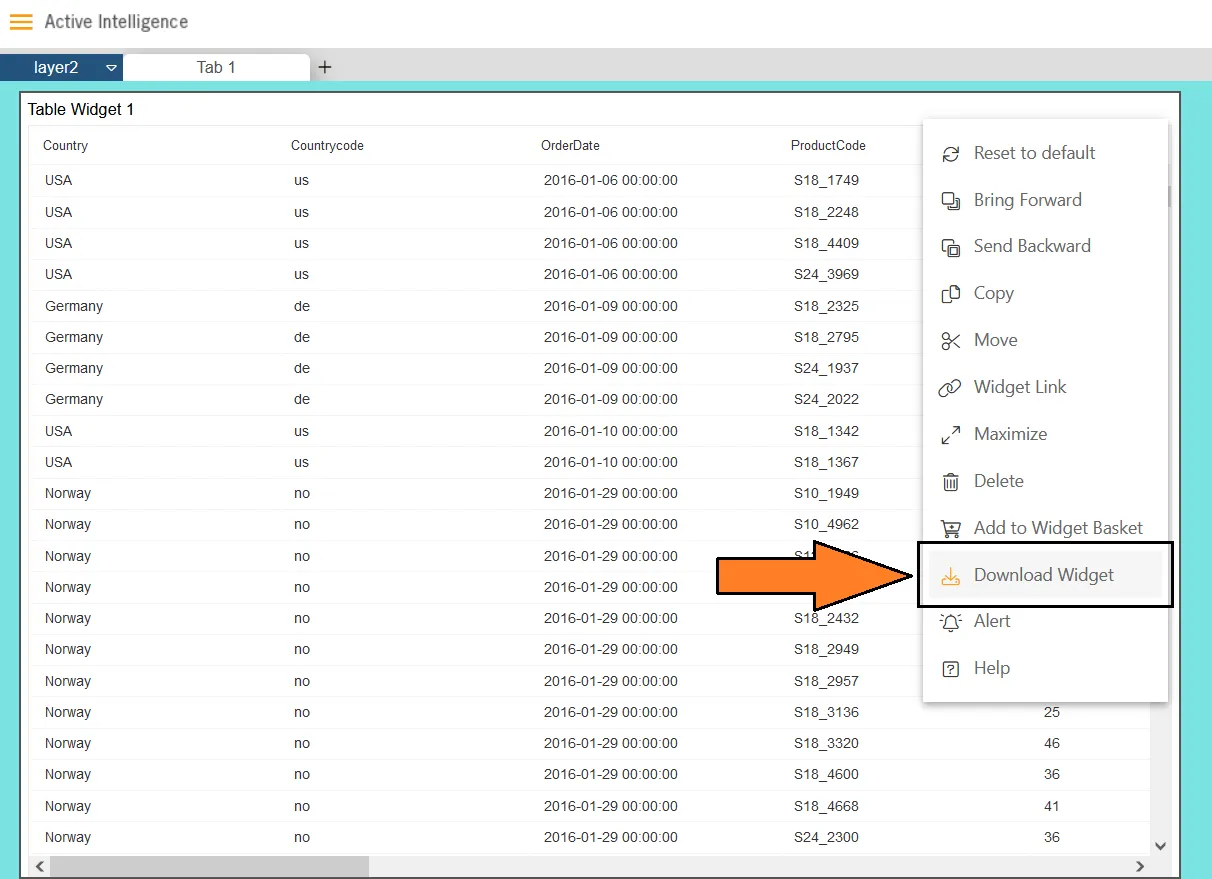
Go to Layer 2 and select the tab1, click on the elipses of the widget and click on the Widget Link button, as shown in the figure below:
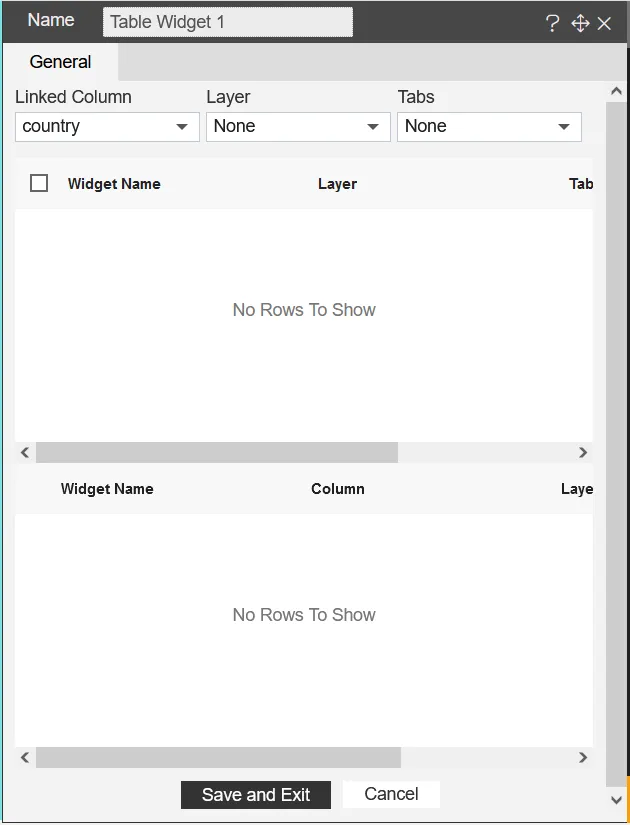
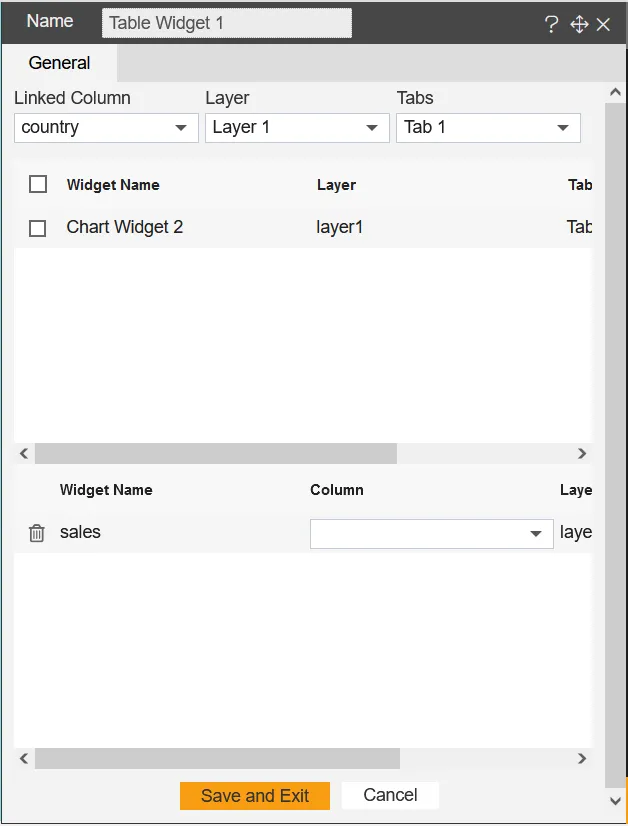
- The Dynamic link widget settings look like the below figure:
- Select the Linked Column as Country, Layer as Layer1, Tabs as Tab1 as we select the layer 1 property, and all the widgets of [layer 1, Tab 1] names will appear in the grid under the controls, as shown in the figure below:
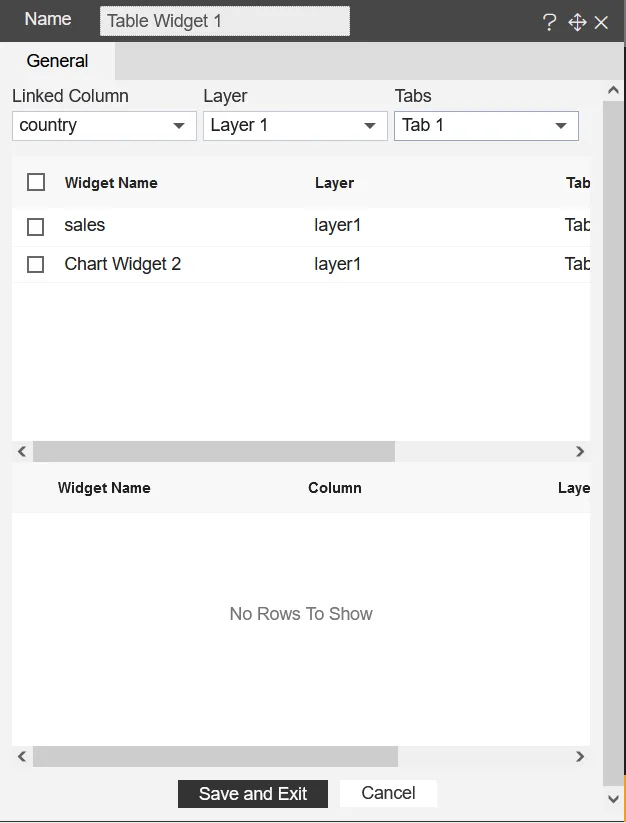
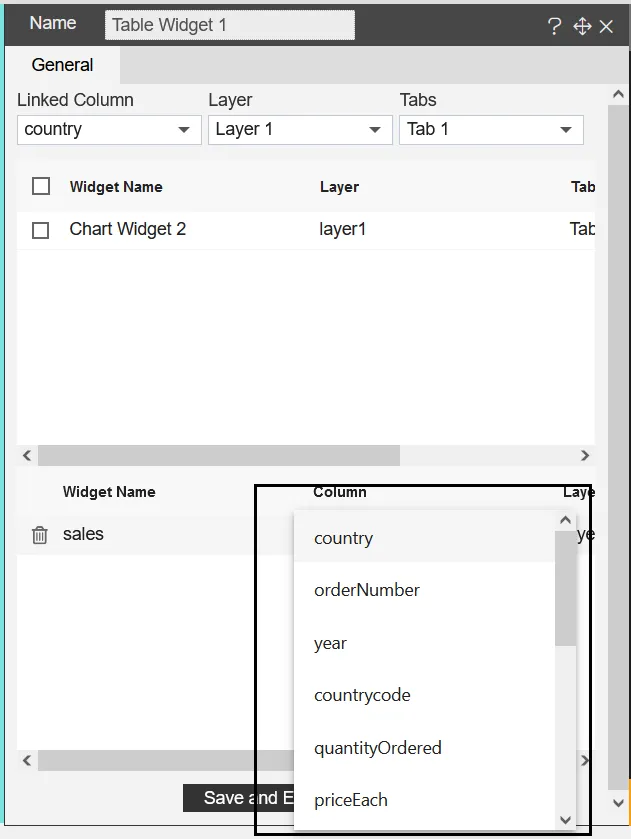
- Now, as we select the sales widget from the upper grid view, the widget will appear in the bottom grid view, as shown in the figure:
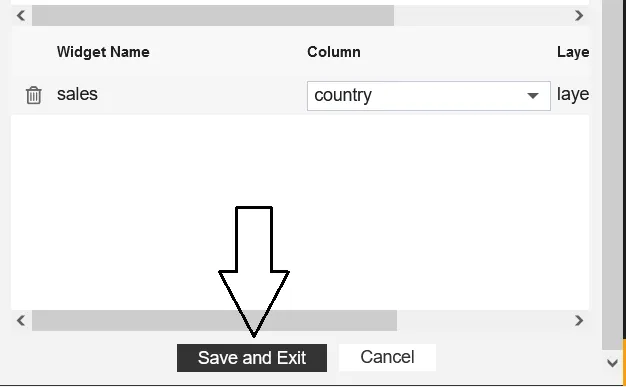
- Select the Column from the Sales widget as shown in the figure below:
- Click on the Save and Exit button, as shown in the figure below:
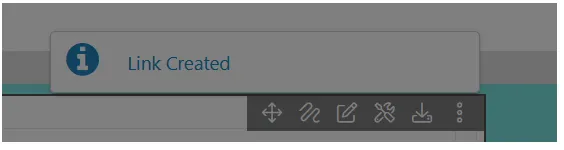
- As we click on the Save and Exit button, the widget Link Created appear on the screen.
- Click on any value in the country column from the table widget exist in the Tab 1 of Layer 2, as shown in the figure below:
- As we select the value from the layer 2 and layer 1’s widget in tab1 shows the value in the tab1’s widget, as shown in the figure below:
3. Extending Filter scope
This Feature will be useful when it is required to filter widgets across the tab with dedicated filter.
-
We will be using the previous dashboard to work on this scenario.
-
open the dashboard and add filter in the dashboard, as shown in the figure below:
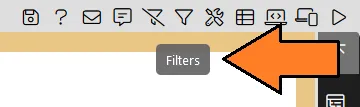
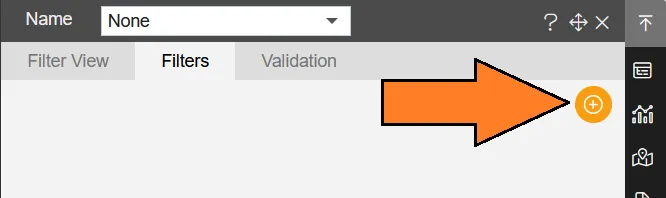
- Click on the Filter icon from the top-right menubar, as shown in the figure below:
- As you get in the Filter settings, click on the (+)plusicon to add the filter, as shown in the figure below:
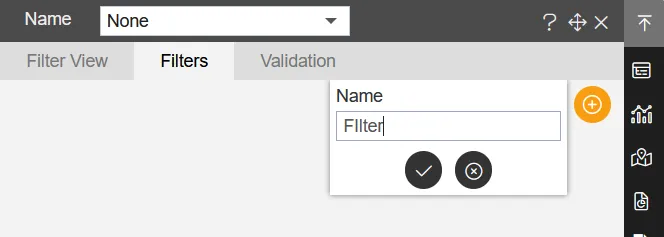
- Add name as Filter then click on the Check icon, User can add any name as required.
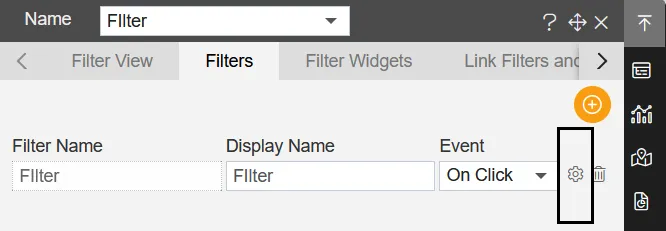
- As the filter gets added, click on the setting icon to add the fields into it.
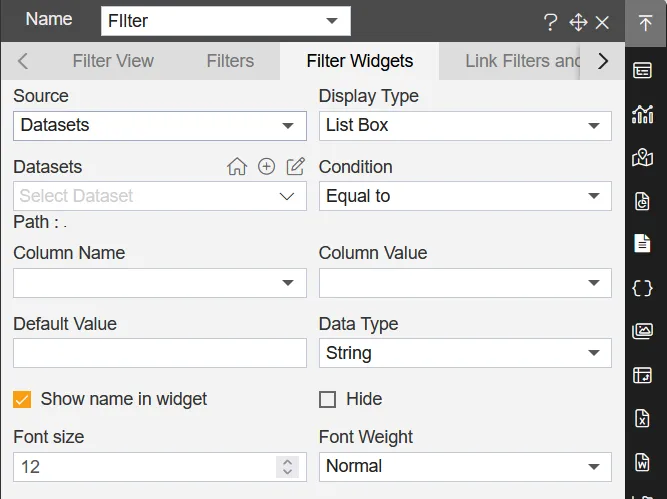
- The Filter widget tab will show the dataset connection controls, as shown in the figure below:
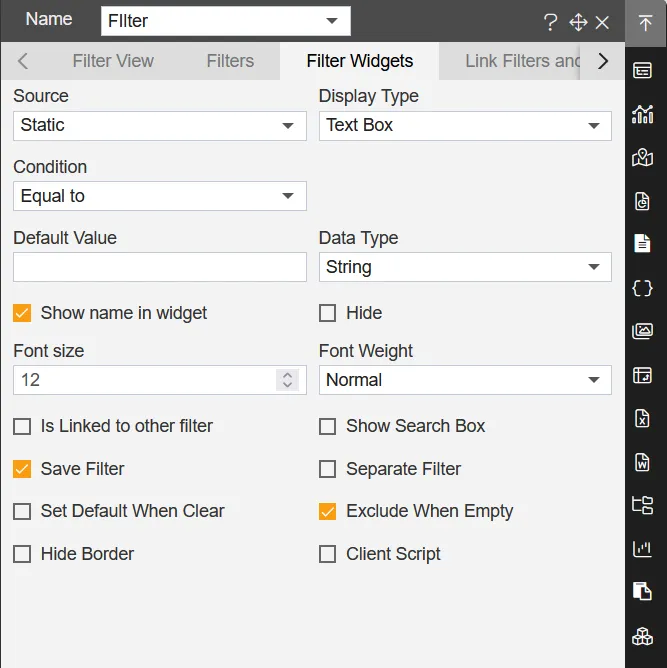
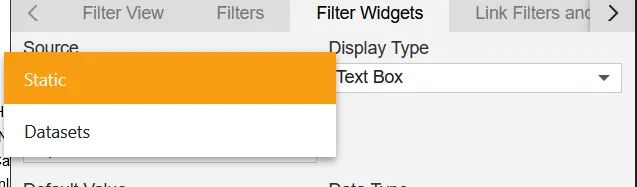
- From the source we have two types 1. Static and 2. Datasets
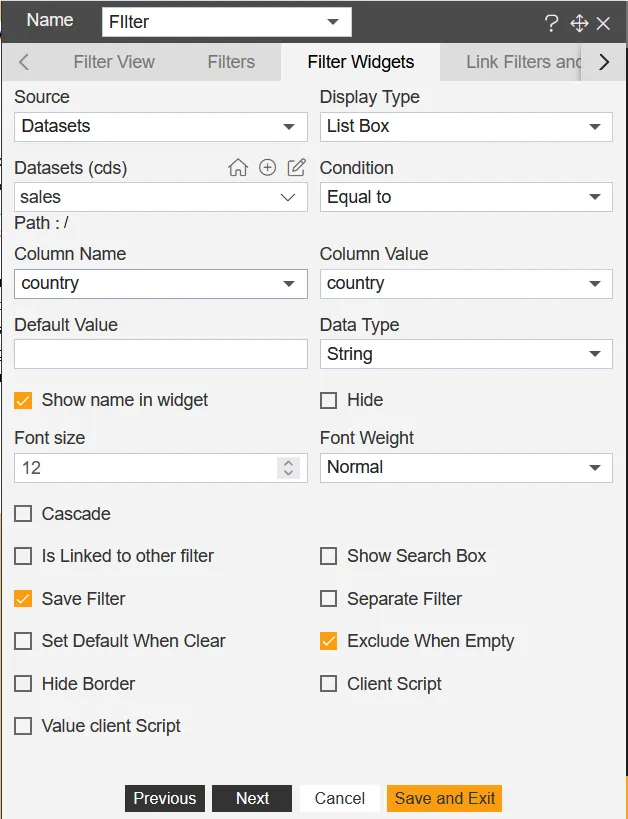
- Select the Source as Dataset and choose the Display type as ListBox.
- Select the Dataset as Sales and Column name as country.
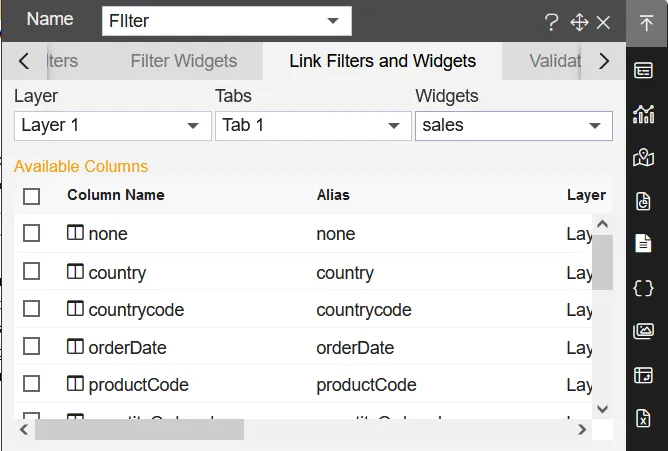
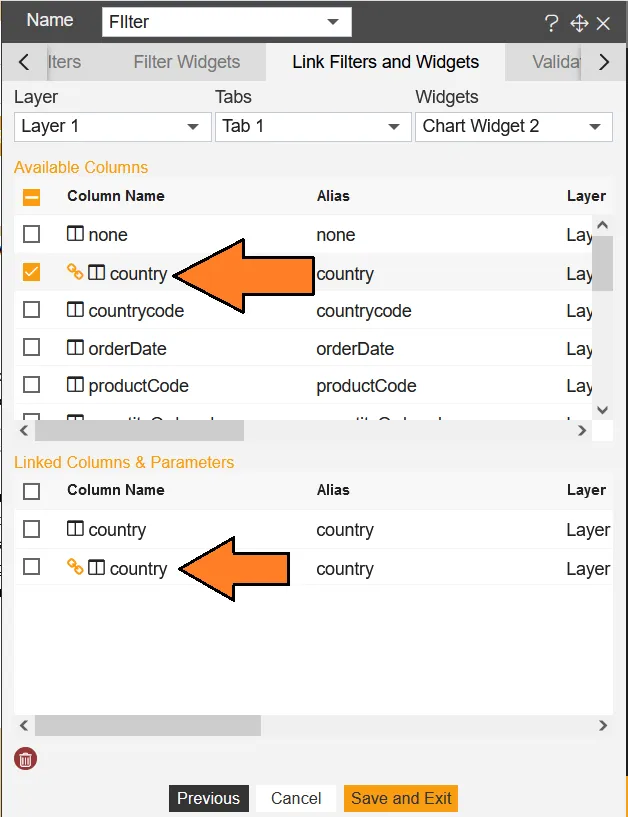
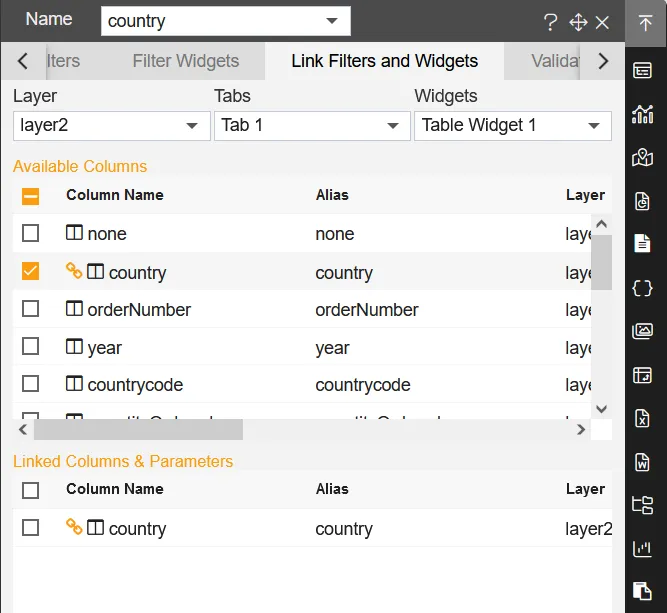
- Click on the tab of Link Filter and Widgets, As shown in the figure below:
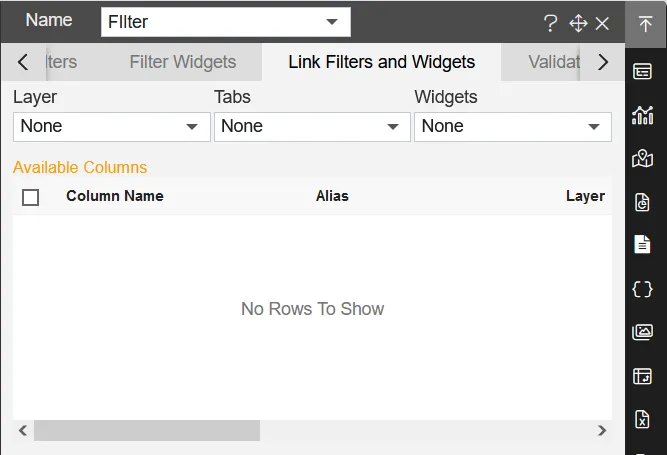
- Select layer as Layer 1 and Tabs as Tab 1 and Widget as Sales.
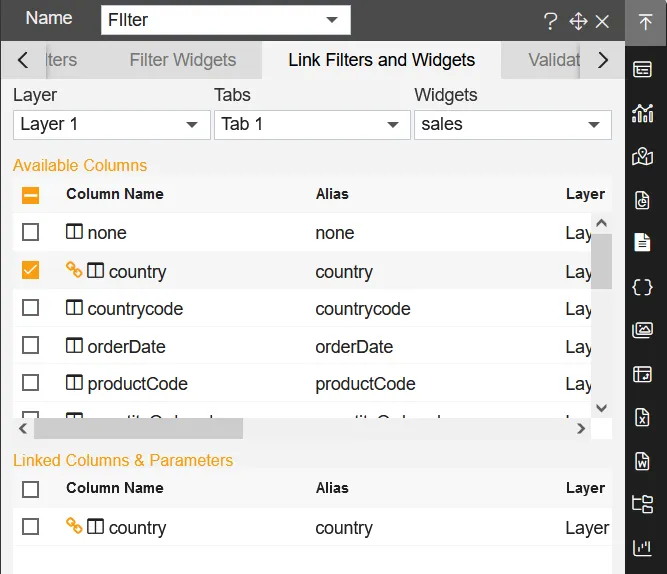
- Select the country column from the Available columns, as we select the country column, it appear in the Linked Columns & Parameter box, as shown in the figure below:
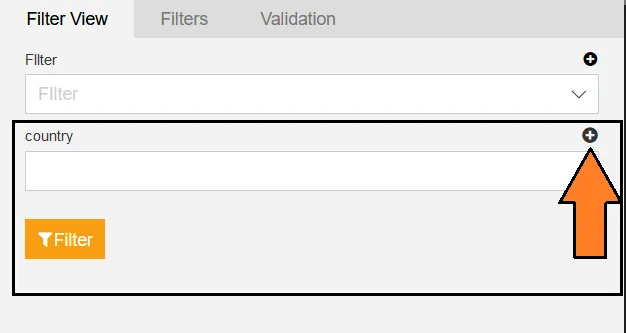
- Click on the filter view and click on the (+)Plus icon on the top-right corner in the filter view.
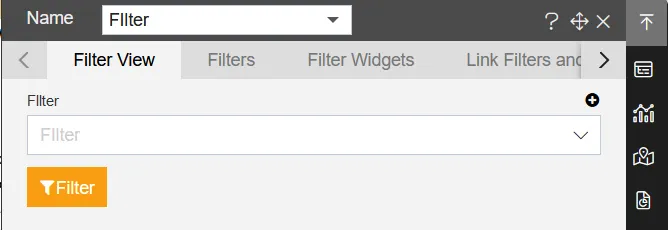
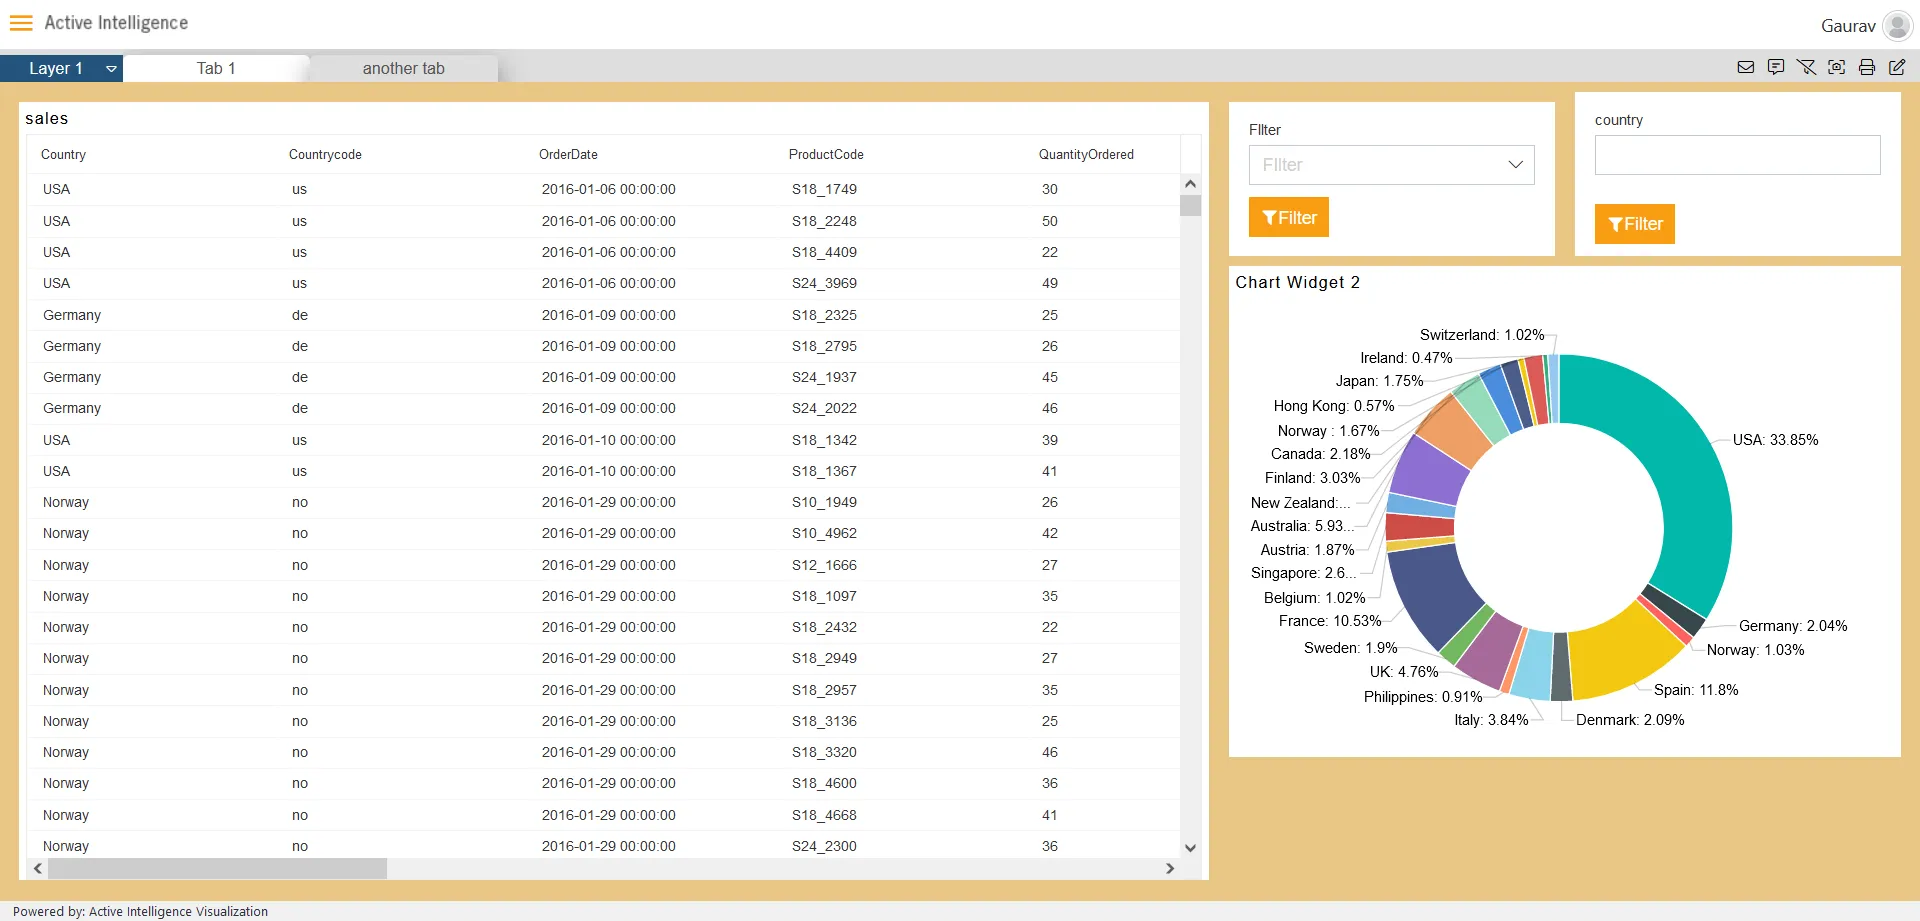
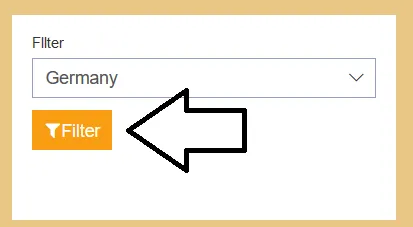
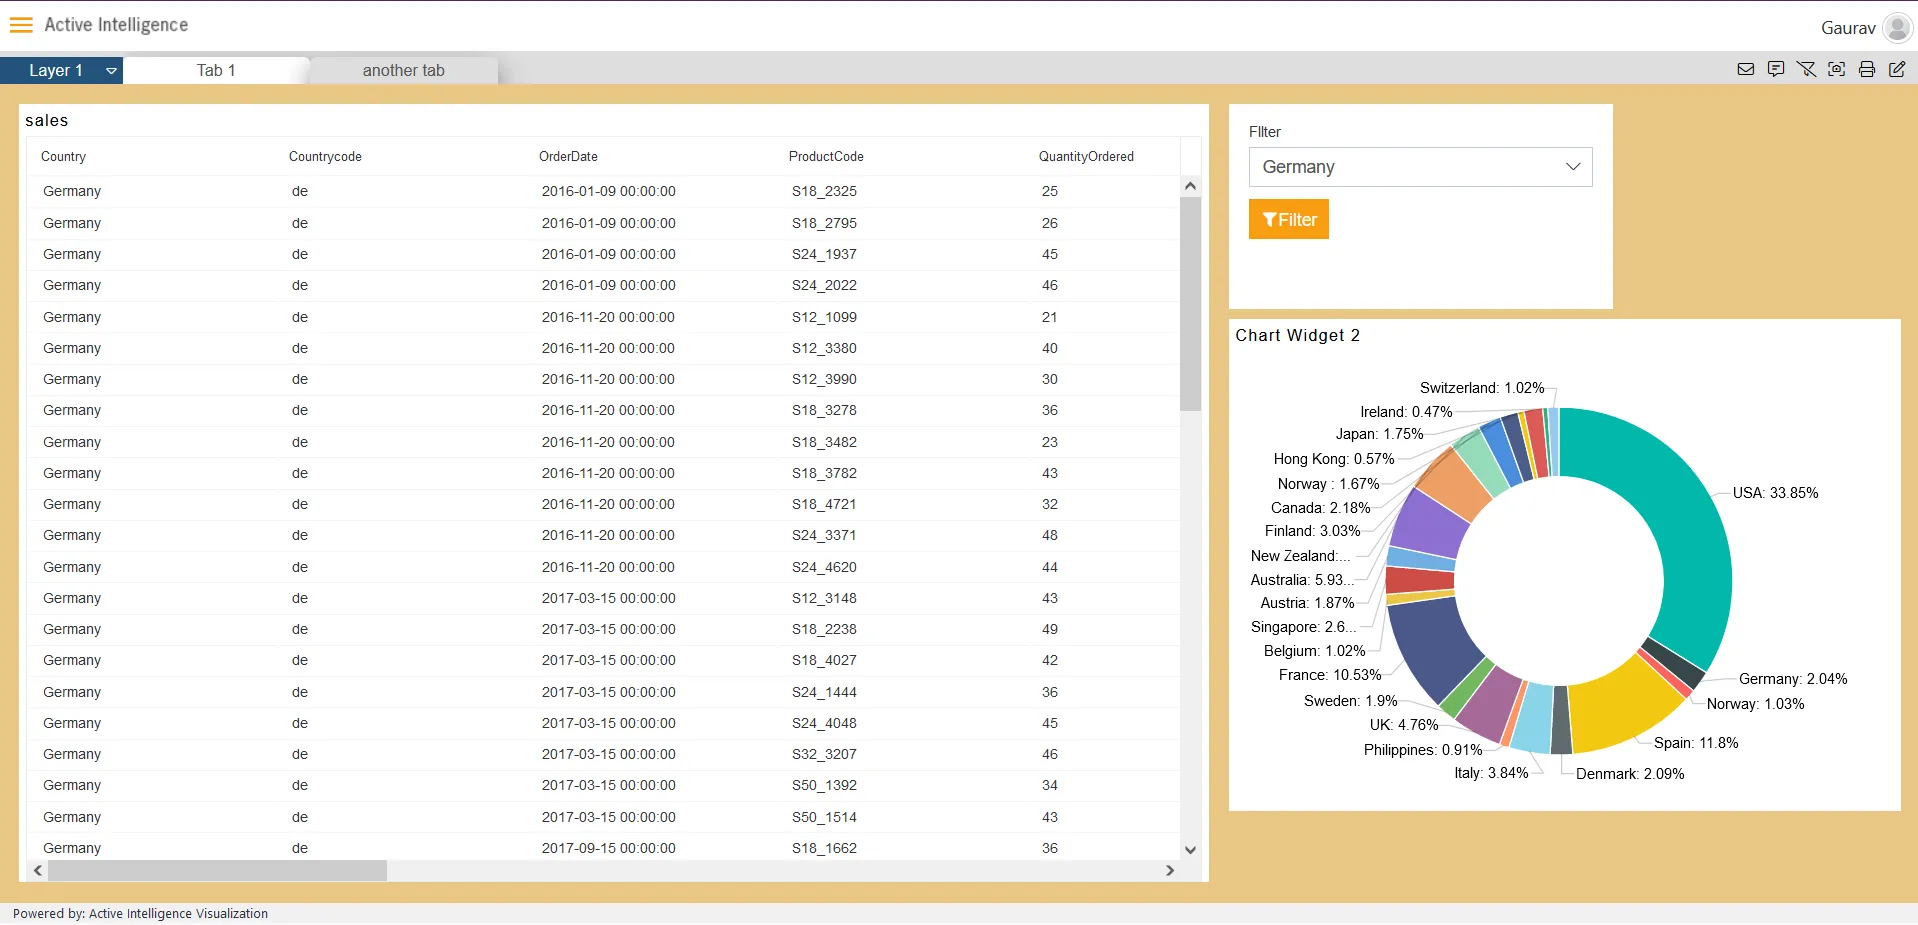
- The filter appear in the dashboard like the figure below:
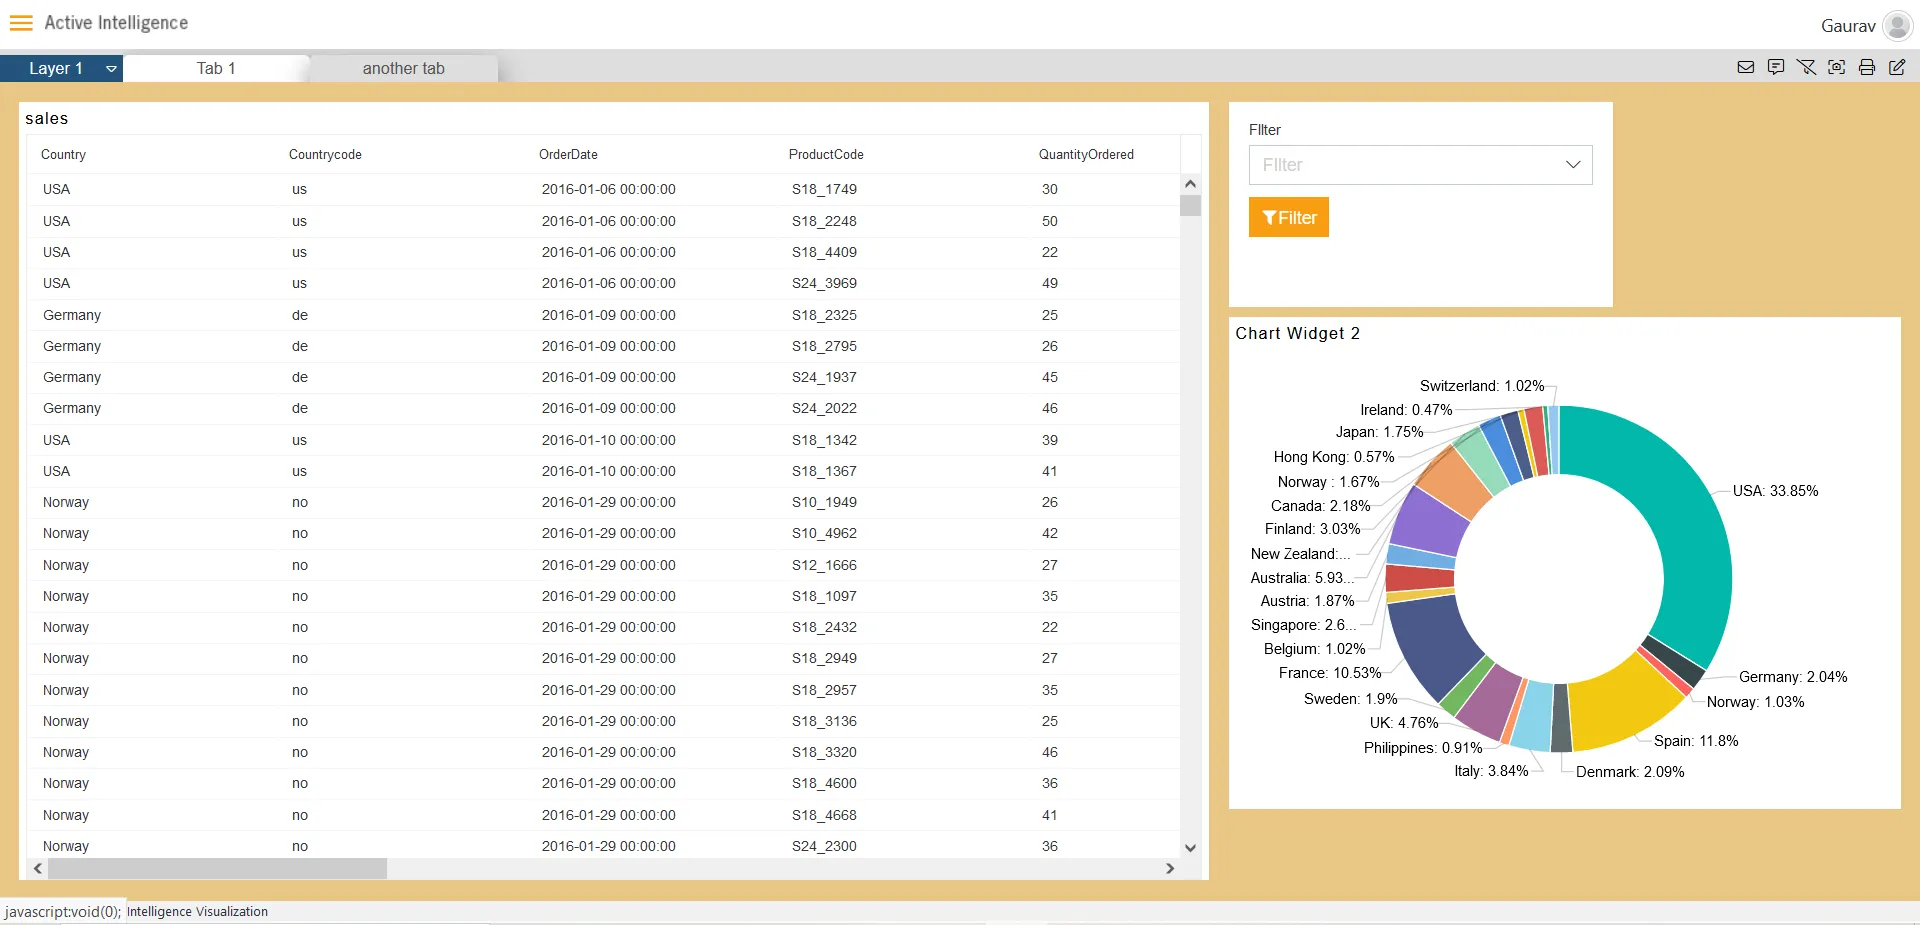
- Select the country and click on the filter icon and you will see the filtered values in the table below:
- The Connected widget shows the filtered values as shown in the figure below:
- Connect more widgets with the filter from the Link Filters and Widgets Tab as shown in the figure below:
- Click on Save and Exit button.
4. Using Events for filtering
- This feature will be usefull when you want to filter on click of the widget exist in the tab of another layer.
- We will be using the previous dashboard to work on this scenario.
- Add country filter in the dashboard, click on the top-right corner of the dashboard on filter icon.
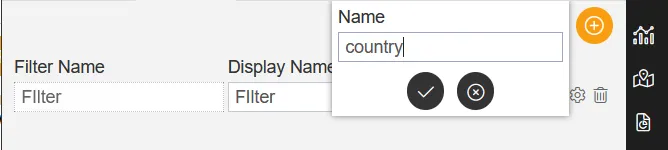
- As you get in the Filter settings, click on the (+)plusicon to add the filter, as shown in the figure below:
- Add name as country in the name textbox then click on the Check icon, User can add any name as required. as shown in the figure below:
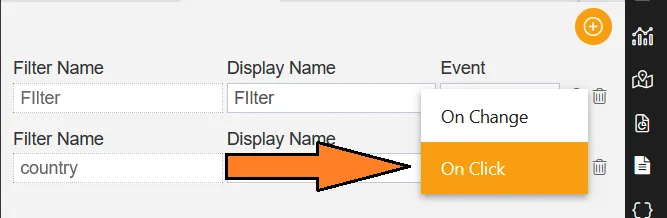
- Change the event from the filter from On Click to On Change.
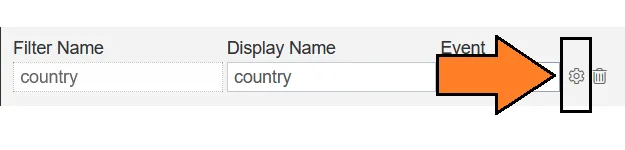
- As the filter gets added, click on the setting icon to add the fields into it.
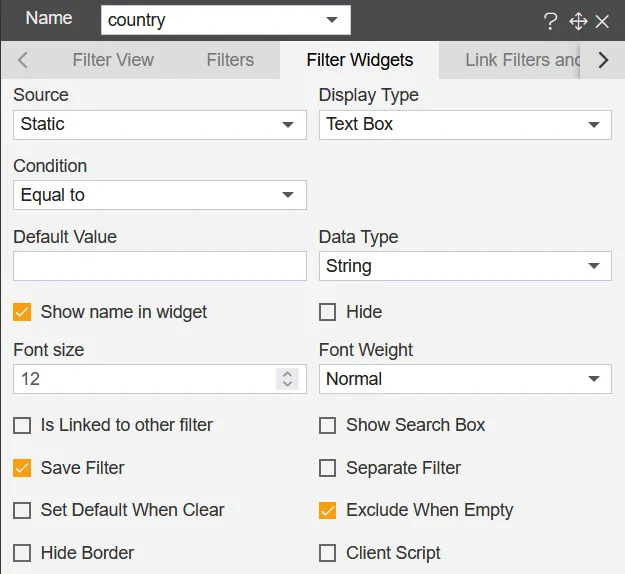
- Keep all the default settings as it is on the filter widget tab.
-
Click on the Link Filter and Widgets tab and select the Layer as Layer2, Tabs as Tab1, Widget as Table Widget1
-
Select the country column from the available columns box.
- Go to Filter view tab and add the country filter, Click on the (+)Plus icon from the top-right corner of the filter.
- Edit the widget and click on the Event tab from the tab menubar, as shown in the figure.
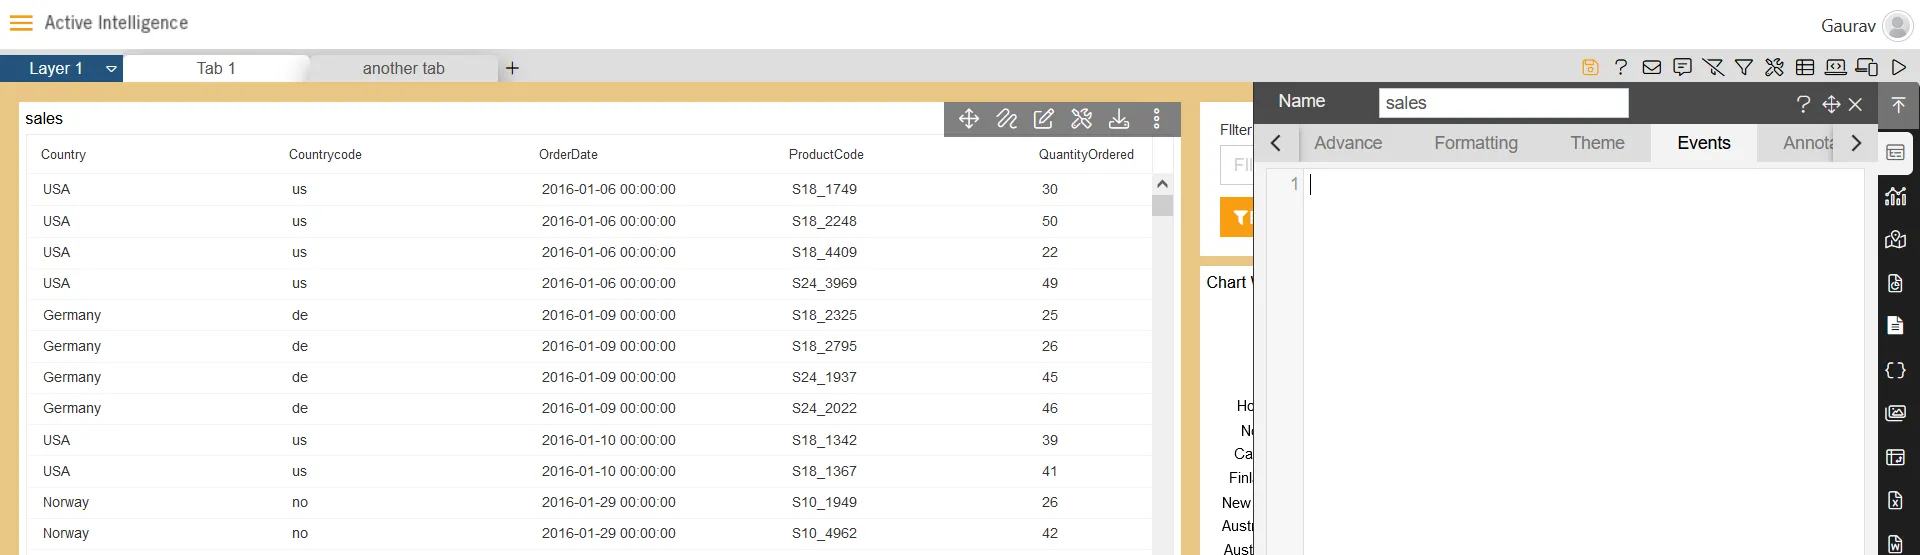
-
Add the code to filter the widget and go to another tab from one layer to another layer.
-
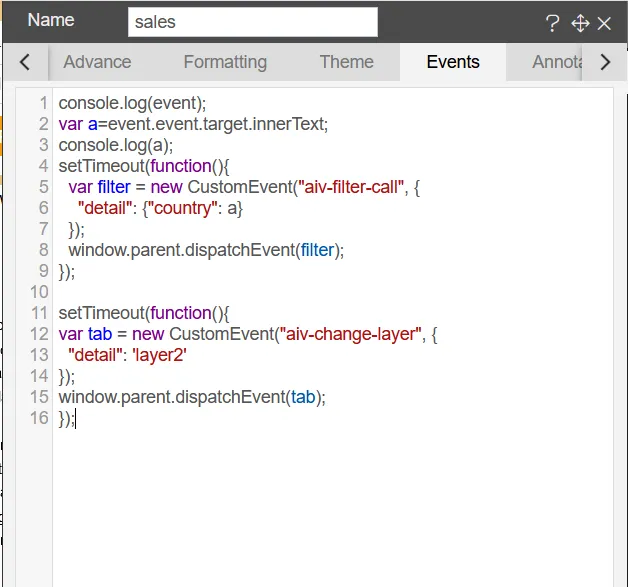
You can copy the below code and add into your dashboard.
console.log(event);
var a=event.event.target.innerText;
console.log(a);
setTimeout(function(){
  var filter = new CustomEvent("aiv-filter-call", {
    "detail": {"country": a}
  });
  window.parent.dispatchEvent(filter);
});

setTimeout(function(){
var tab = new CustomEvent("aiv-change-layer", {
  "detail": 'layer2'
});
window.parent.dispatchEvent(tab);
});
- Click on Save and Exit button.
-
Now, Go to Preview button, and go to preview side of the dashboard.
-
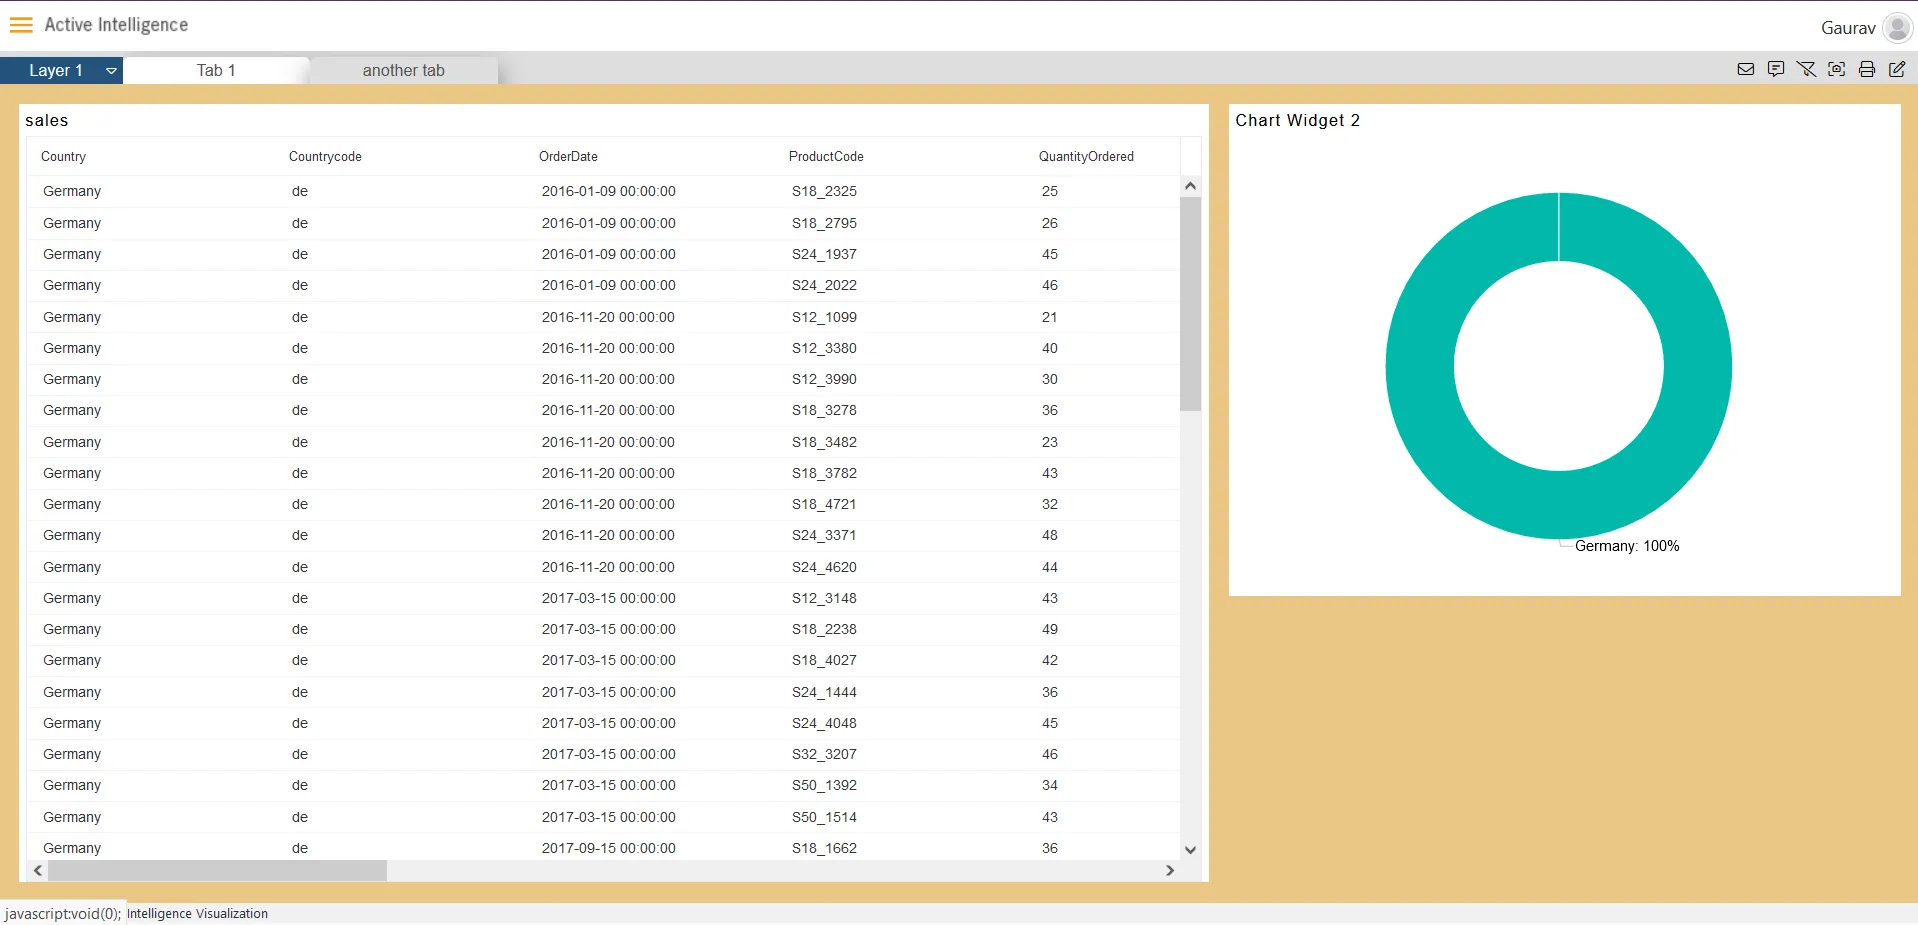
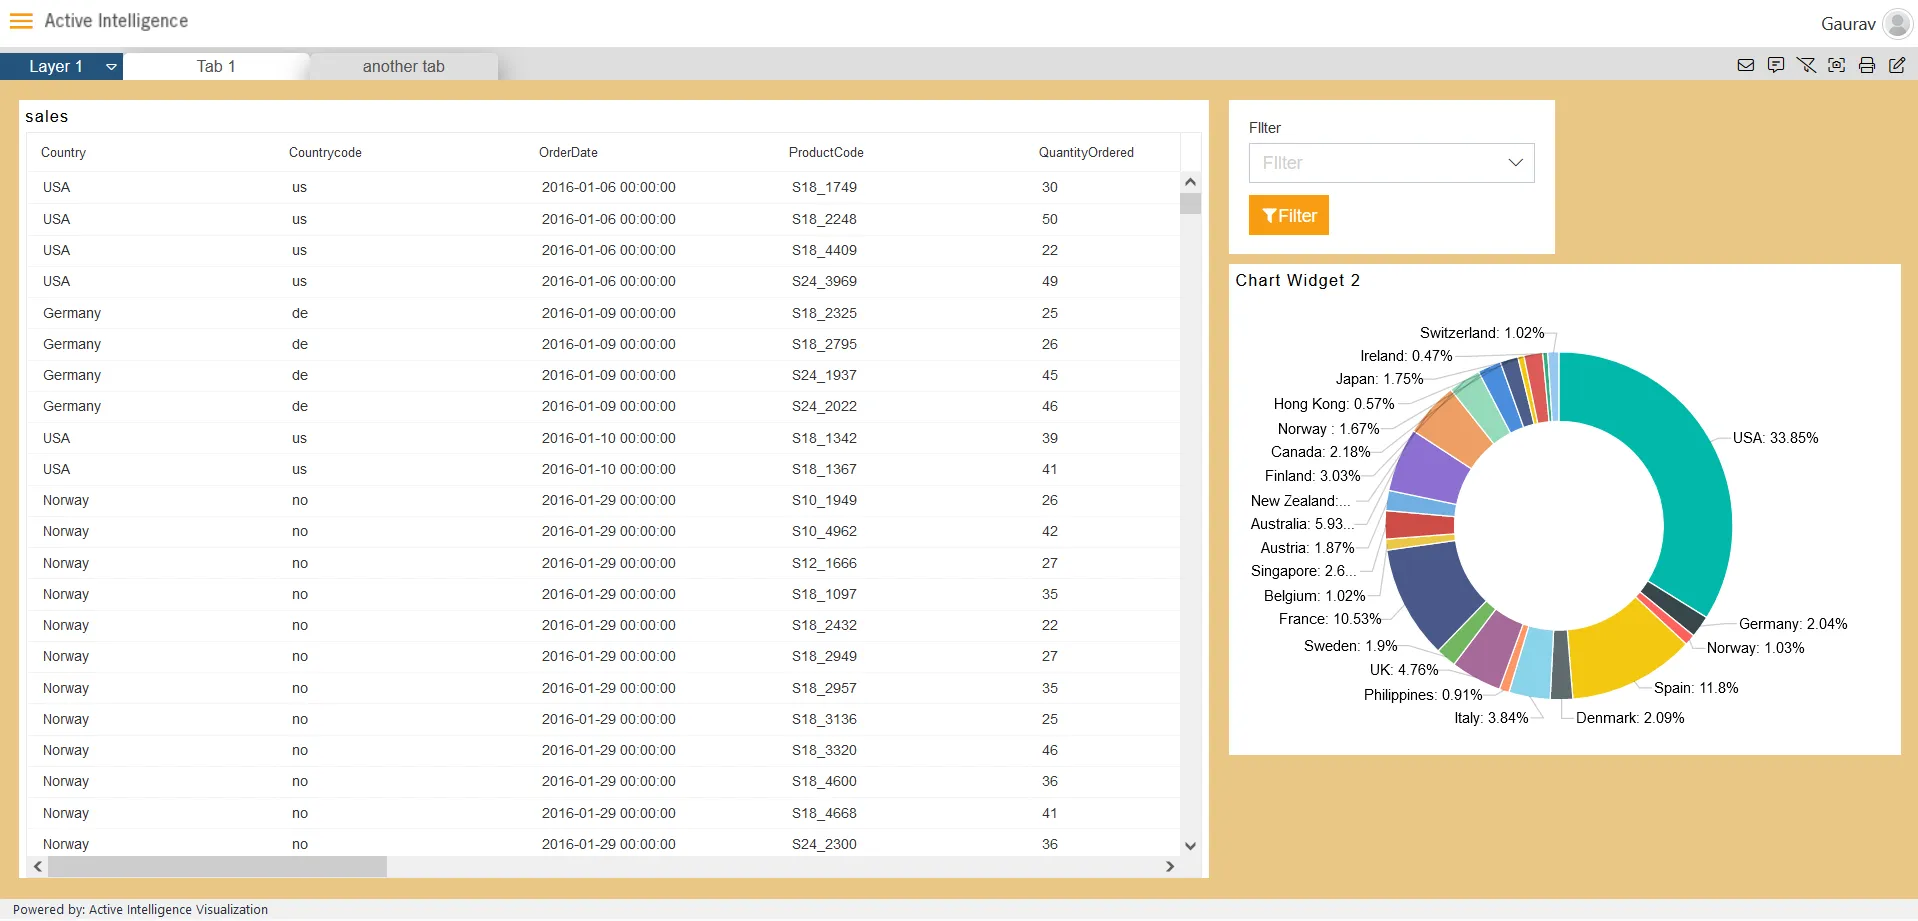
Click on any value on the column of country and it will redirect you on the another layer with filtered data.
- As we click on the country from the sales widget, it reflects the Germany country on the Table widget of the layer2’s tab 1.