Map series
The Formatting Map-Series Properties are as follows:
Series Overview
Map Series - General Properties
Overview: In Map Series General Properties you can change the Hover color and Active color of map as per your requirement. you can customize all the other properties in the series using the Map Series General Properties property in Map Widget.
Description: In Maps Series click on Map Series General Properties.
- Enter the Following details in Map Series General Properties:
- Hover Color: #197ba9
- Active Color: #8d28ed
- Fill above details in the edit box.
- Click on Publish button.
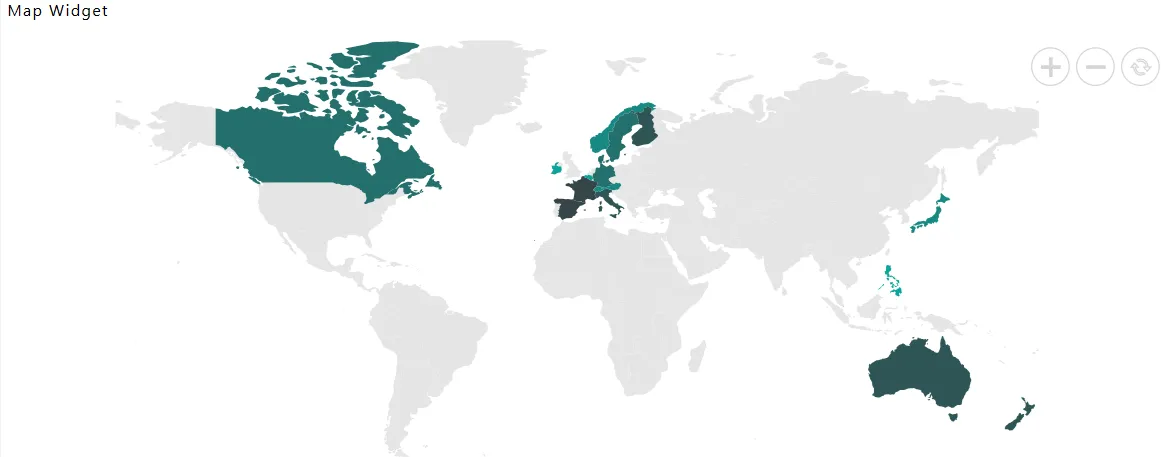
- Now, match your Geo Map with the below example, it should look like the figure below:
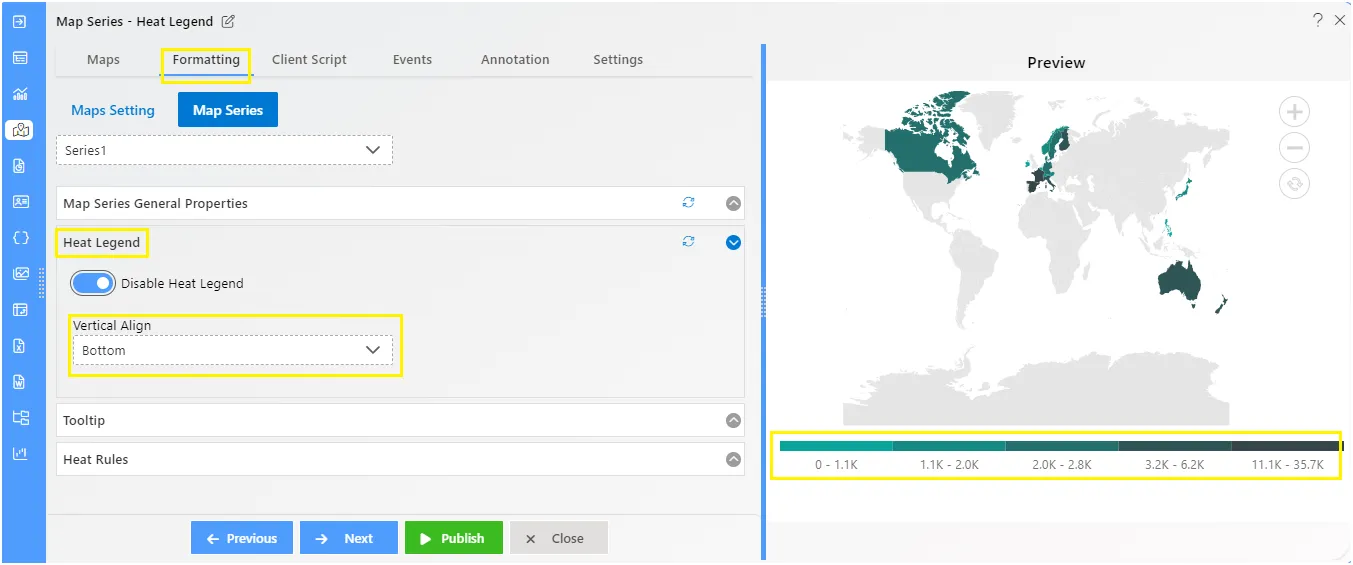
Map Series - Heat Legend
Overview: Legends provide valuable information for interpreting maps using colors, shapes, or other identifiers based on data. Move a legend to any position like Top, Bottom, Left, Right inside the map. A legend is a key used on a map that contains swatches of symbols with descriptions.
Description: In Maps Series click on Heat Legend.
- Enter the Following details in Heat Legend:
- Toggle Enable Heat Legend
- Vertical Align: Bottom
- Fill above details in the edit box, As Shown in the figure:
- Click on Publish button.
- Now, match your Geo Map with the below example, it should look like the figure below:
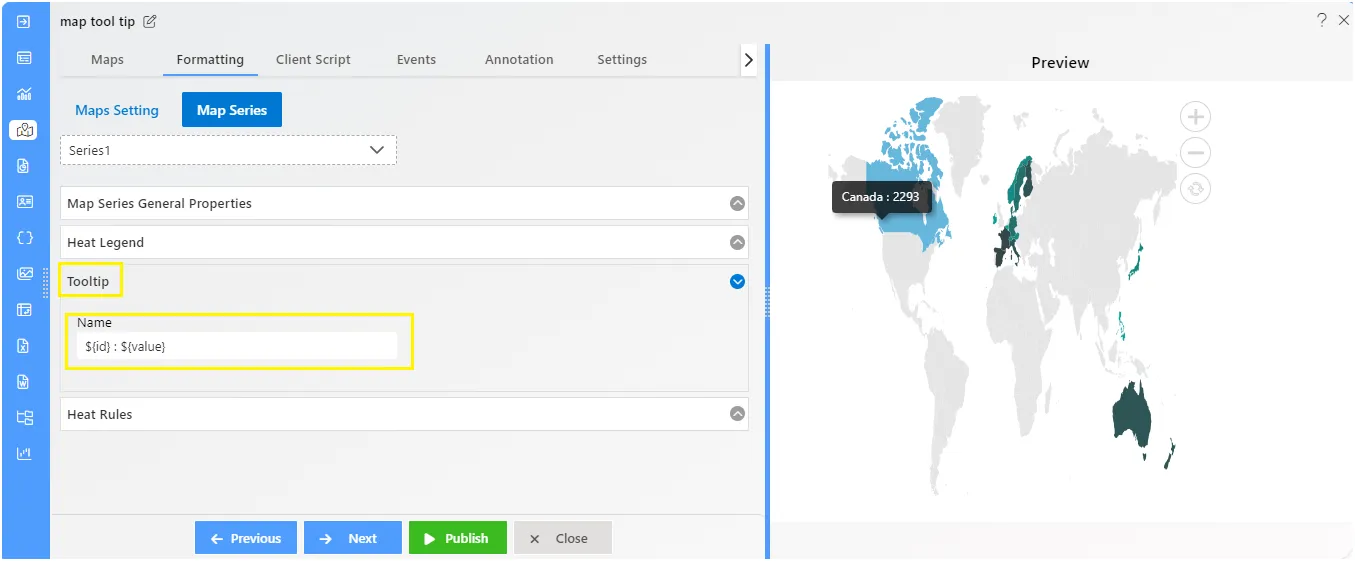
Map Series - Tooltip
Overview: Tooltip display a pop-up with additional information about the shapes, markers, and bubbles when hovering over map elements. To Change the Formatting Property of the Geo Map, you need working Datasets with country or state names.
Description: In Maps Series click on Tooltip.
- Enter the Following details in Tooltip:
Name: ${value} : ${id}
- Fill above details in the edit box.
- Click on Publish button.
- Now, match your Geo Map with the below example, it should look like the figure below:
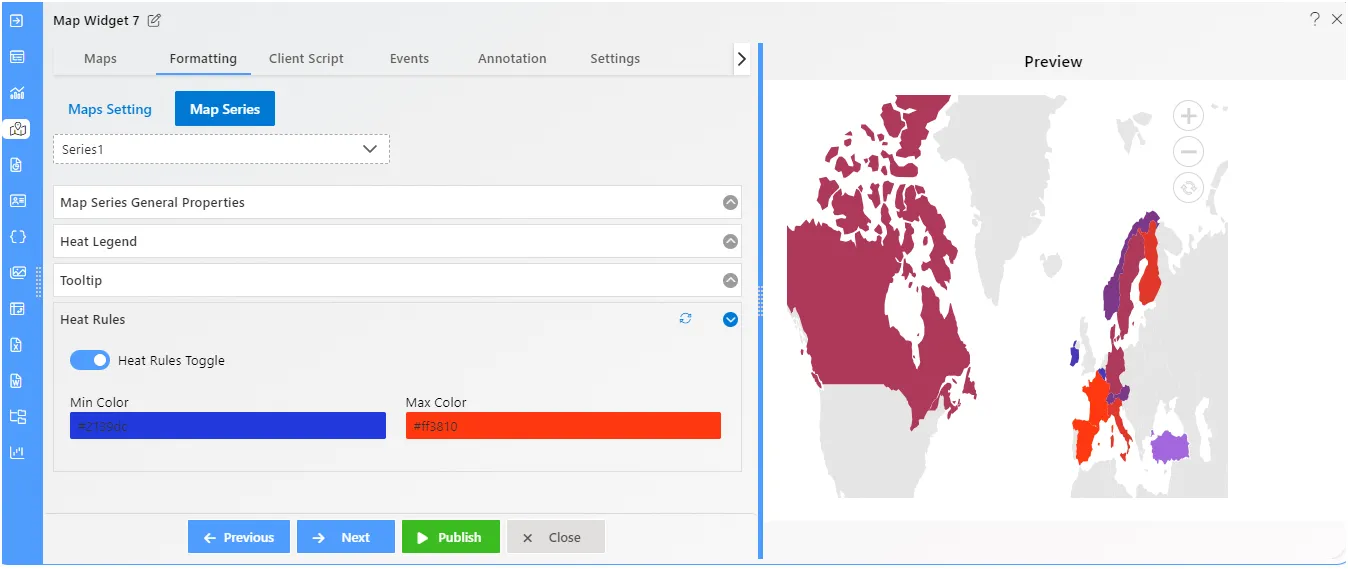
Map Series - Heat Rules
Overview: Tooltip display a pop-up with additional information about the shapes, markers, and bubbles when hovering over map elements.
Description: In Maps Series click on Heat Rules Property.
- Enter the Following details in Heat Rules:
- Toggle Heat Rules
- Max Color: #ff3810
- Min Color: #2139dc
- Fill above details in the edit box.
- Click on Publish button.
- Now, match your Geo Map with the below example, it should look like the figure below: