Skip Widget From Event Filtering
Skip Widget from Event Filtering: This video explains how to use the Skip Widget feature in event filtering.
Use Case Explanation: When an event filters data across multiple widgets, it may also filter the widget that triggered the event. To prevent this, the Skip Widget event ensures the triggering widget remains unaffected by its own event.
To use the Skip Widget feature in event filtering, follow these steps:
-
Identify the Event Trigger: Determine the event that initiates the filtering action, such as a click event or selection change.
-
Apply Filter to Target Widgets: Configure the filter to apply only to the intended target widgets based on the triggering widget’s event.
-
Use the Skip Widget Event: Implement the Skip Widget event to exclude the triggering widget from being filtered by its own event. This involves setting a condition or flag to identify the triggering widget and ensure it is excluded during the filter application.
Example Scenario:
Consider a dashboard with multiple charts. Clicking on a bar in Chart A filters data in Chart B and Chart C, but not in Chart A itself.
Implementation Steps:
-
Set Up Event Listener on Chart A: Attach an event listener to Chart A for the click event.
ChartA.on('click', function(params) { // Extract filter criteria from the clicked item const filterCriteria = params.data; // Apply filter to Chart B and Chart C filterData(filterCriteria, ['ChartB', 'ChartC']); // Use Skip Widget to avoid filtering Chart A itself skipWidgetEvent('ChartA'); }); -
Define the Filter Function: Create a function to apply the filter criteria to the target charts.
function filterData(criteria, targetCharts) { targetCharts.forEach(chartId => { // Apply filter to each target chart applyFilter(chartId, criteria); }); } -
Implement Skip Widget Logic: Ensure the triggering widget (Chart A) is skipped during the filter application.
function skipWidgetEvent(widgetId) { // Logic to skip the widget event for the specified widget // This can be a flag or condition check to exclude the widget // from filtering itself. } -
Apply Filter Function: Define the function to apply a filter to a given chart.
function applyFilter(chartId, criteria) {
    // Logic to apply filter to the specified chart using the criteria
    // Example: chartInstance.setFilter(criteria);
}
Summary:
- Event Trigger Identification: Identify the event (e.g., click, selection change) and the widget that triggers the filtering action. This step is crucial to determine where the filtering process starts.
- Filter Application: Apply the extracted filter criteria to the target widgets (e.g., Chart B and Chart C) to update their data based on the user’s interaction with the triggering widget.
- Skip Widget Event: Use a condition or flag to ensure that the triggering widget (e.g., Chart A) is excluded from being filtered by its own event. This ensures the widget does not filter itself and preserves a seamless user experience and data integrity across the dashboard.
Steps to Create Group Table and Resolve Collapsing Issue in Dashboard
-
Add a table widget to the dashboard, select all columns, and group the data by Country (Level1) and ProductLine (Level2) to create a grouped table
-
Go to the Advanced tab and drag and drop the Country and ProductLine columns into the rows, as shown in the image below.
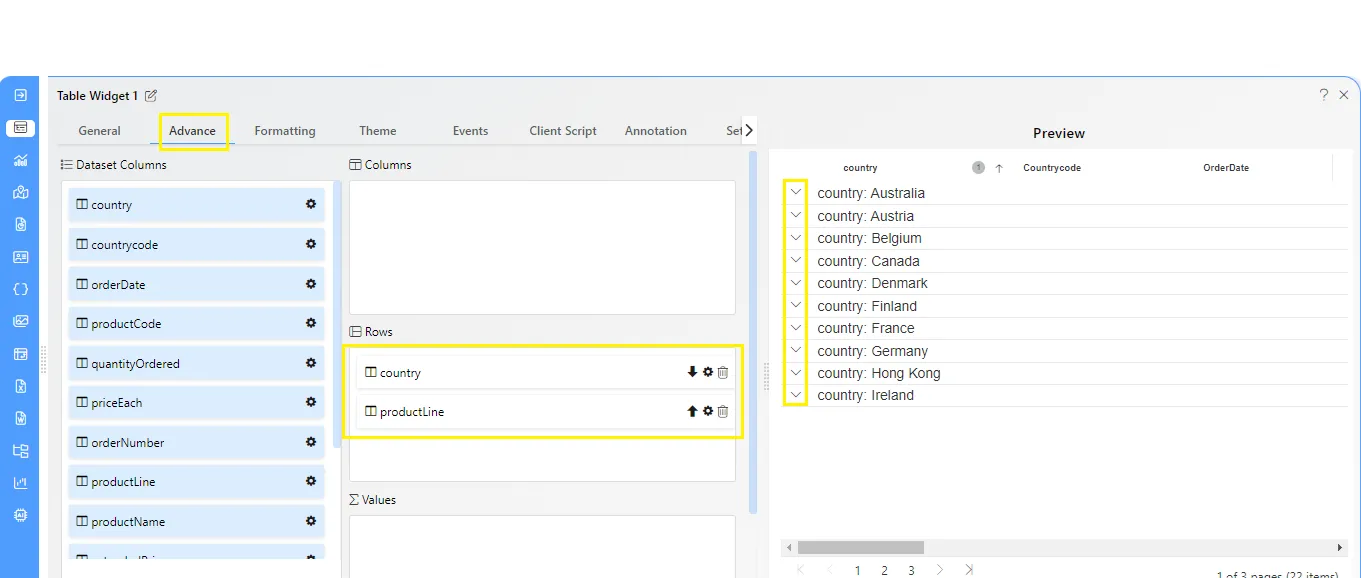
-
Click on Save and Exit to save the changes and go to the Preview. You will see a table like the one shown in the image below.
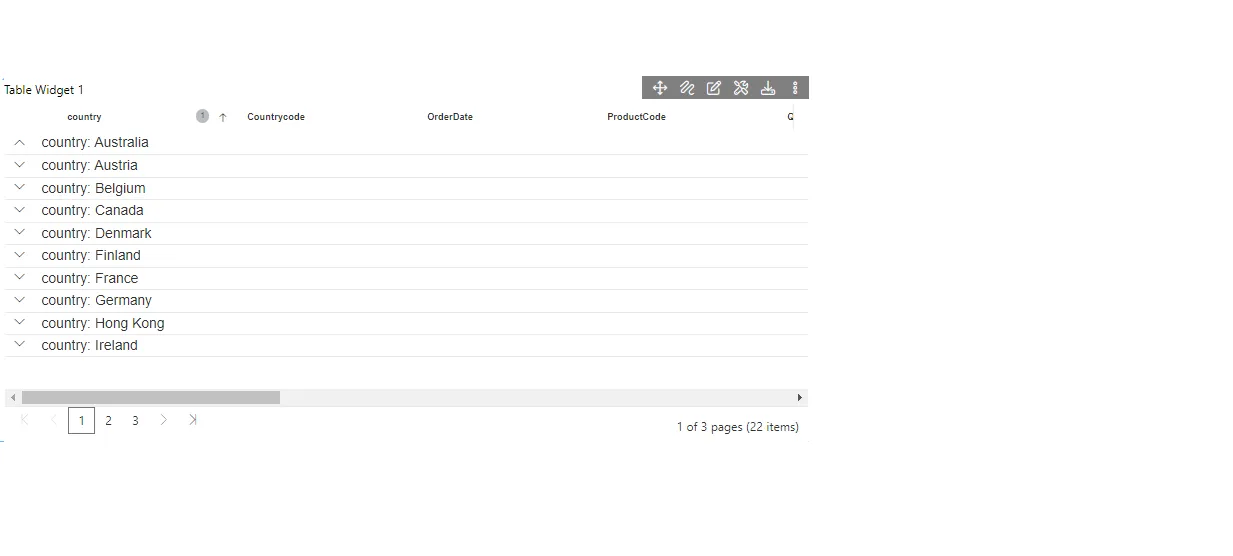
-
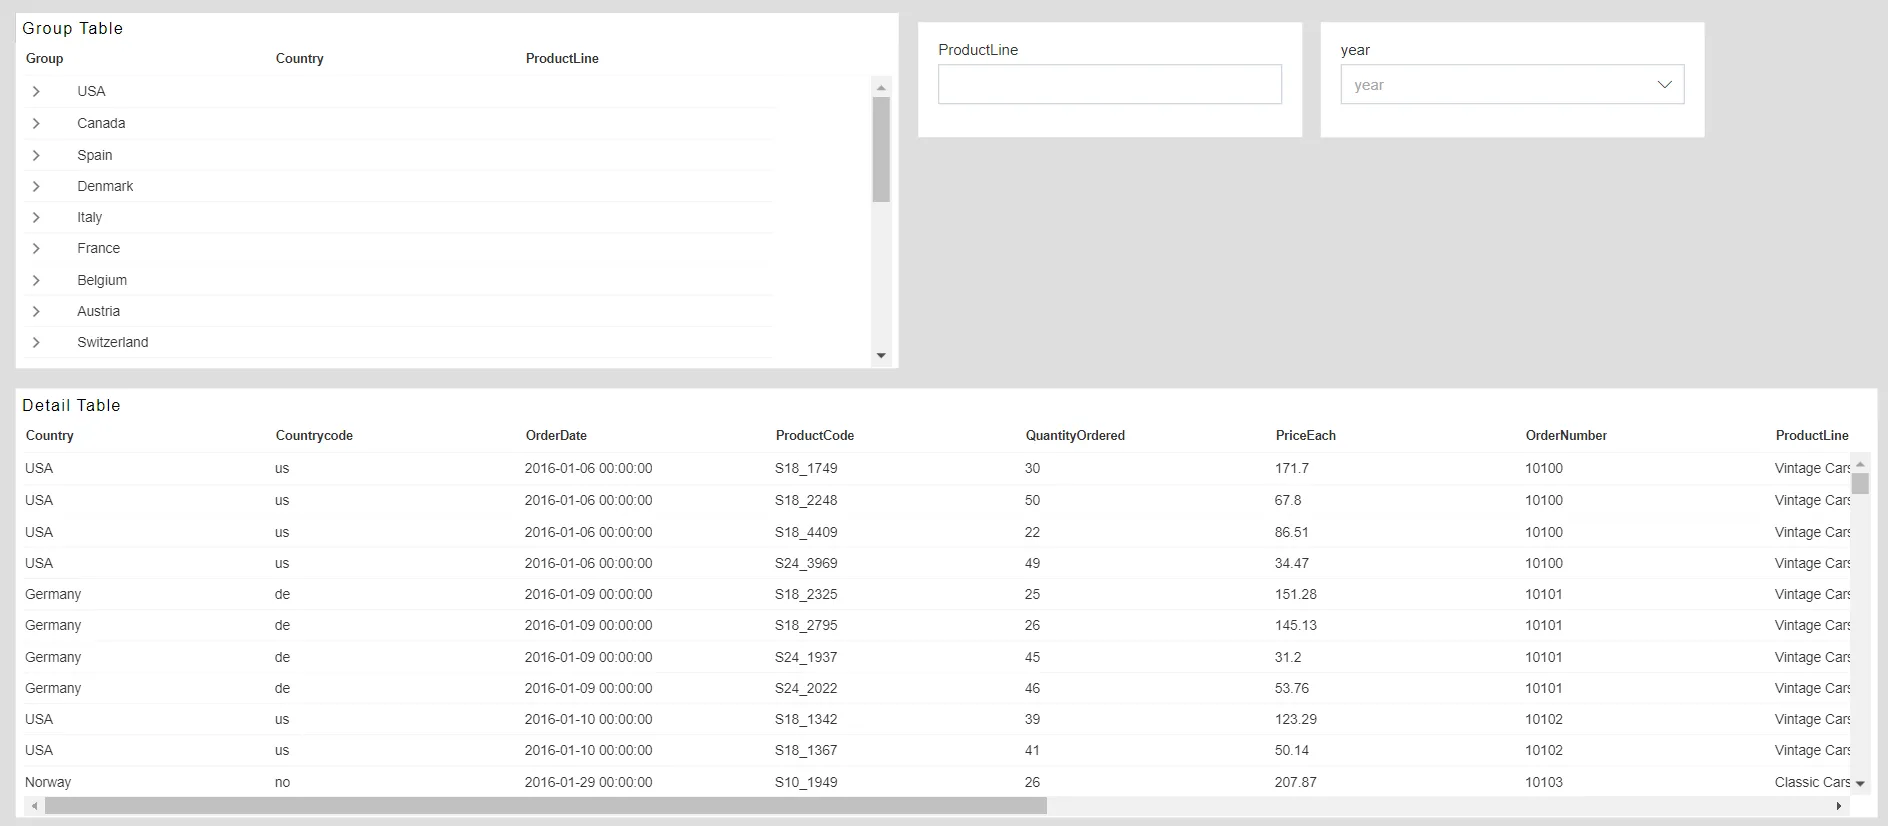
Now, create another table below the grouped table and select all columns. The dashboard will look like the image below.
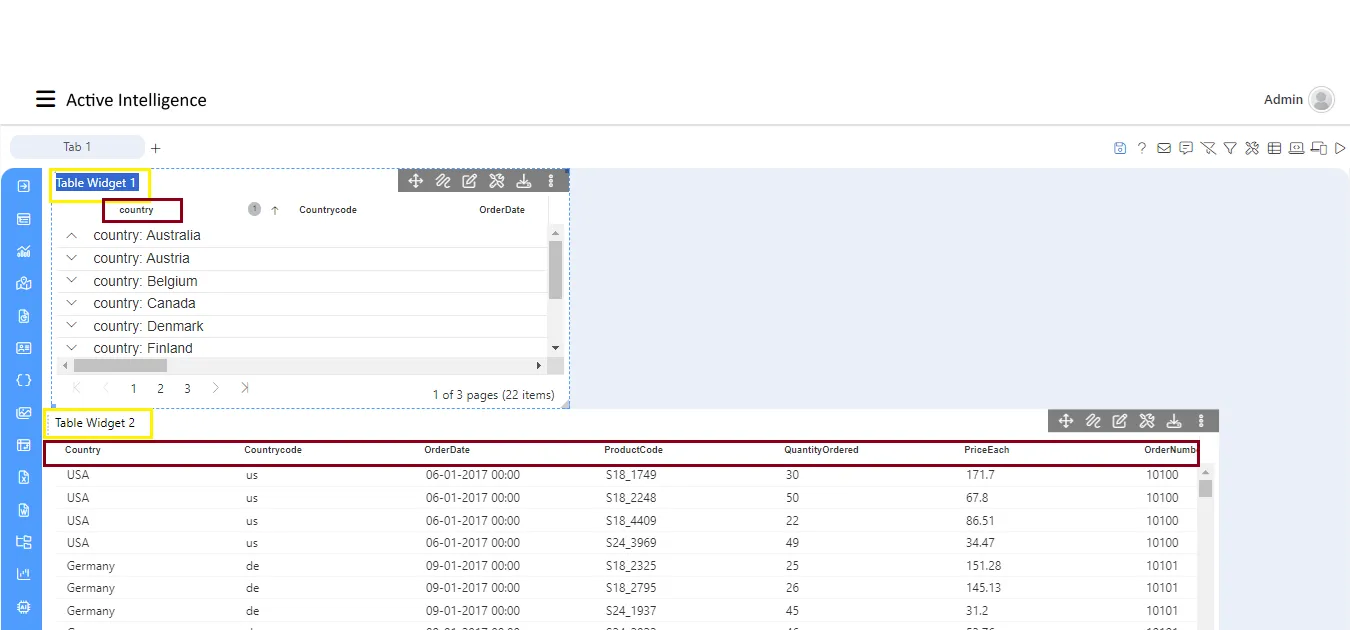
-
Add an Event to the group table to capture the values of the group when clicked.
-
Create a ProductLine filter and link it to the Detail table.
-
Create a Year filter and link it to both widgets.
-
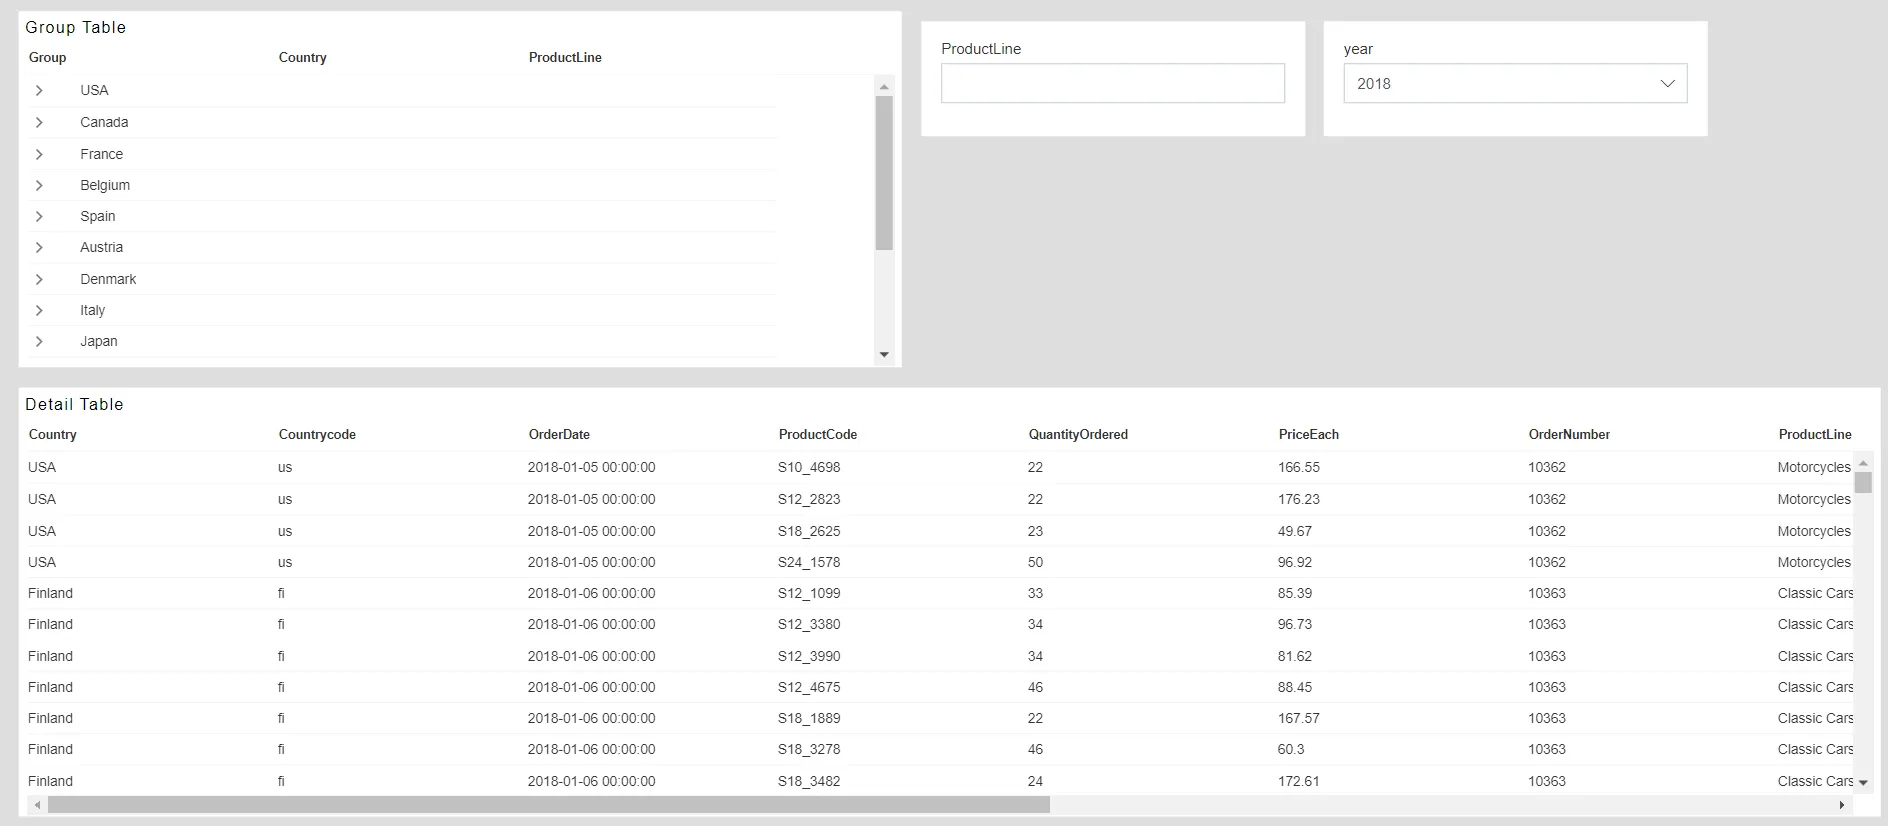
Select a year from the Year filter to apply it across the entire dashboard.
-
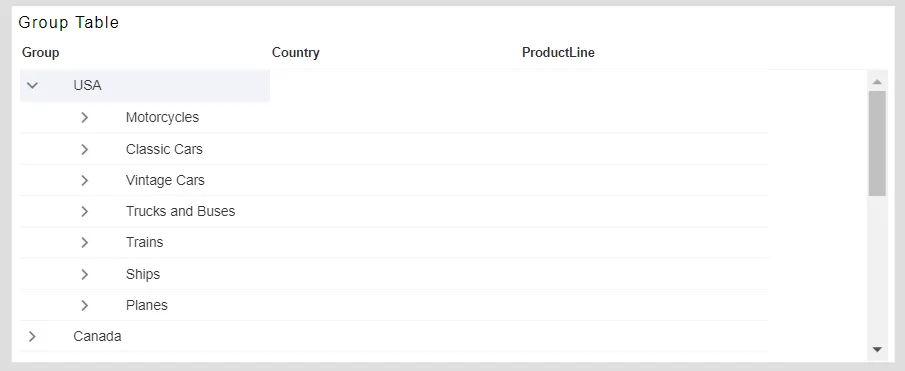
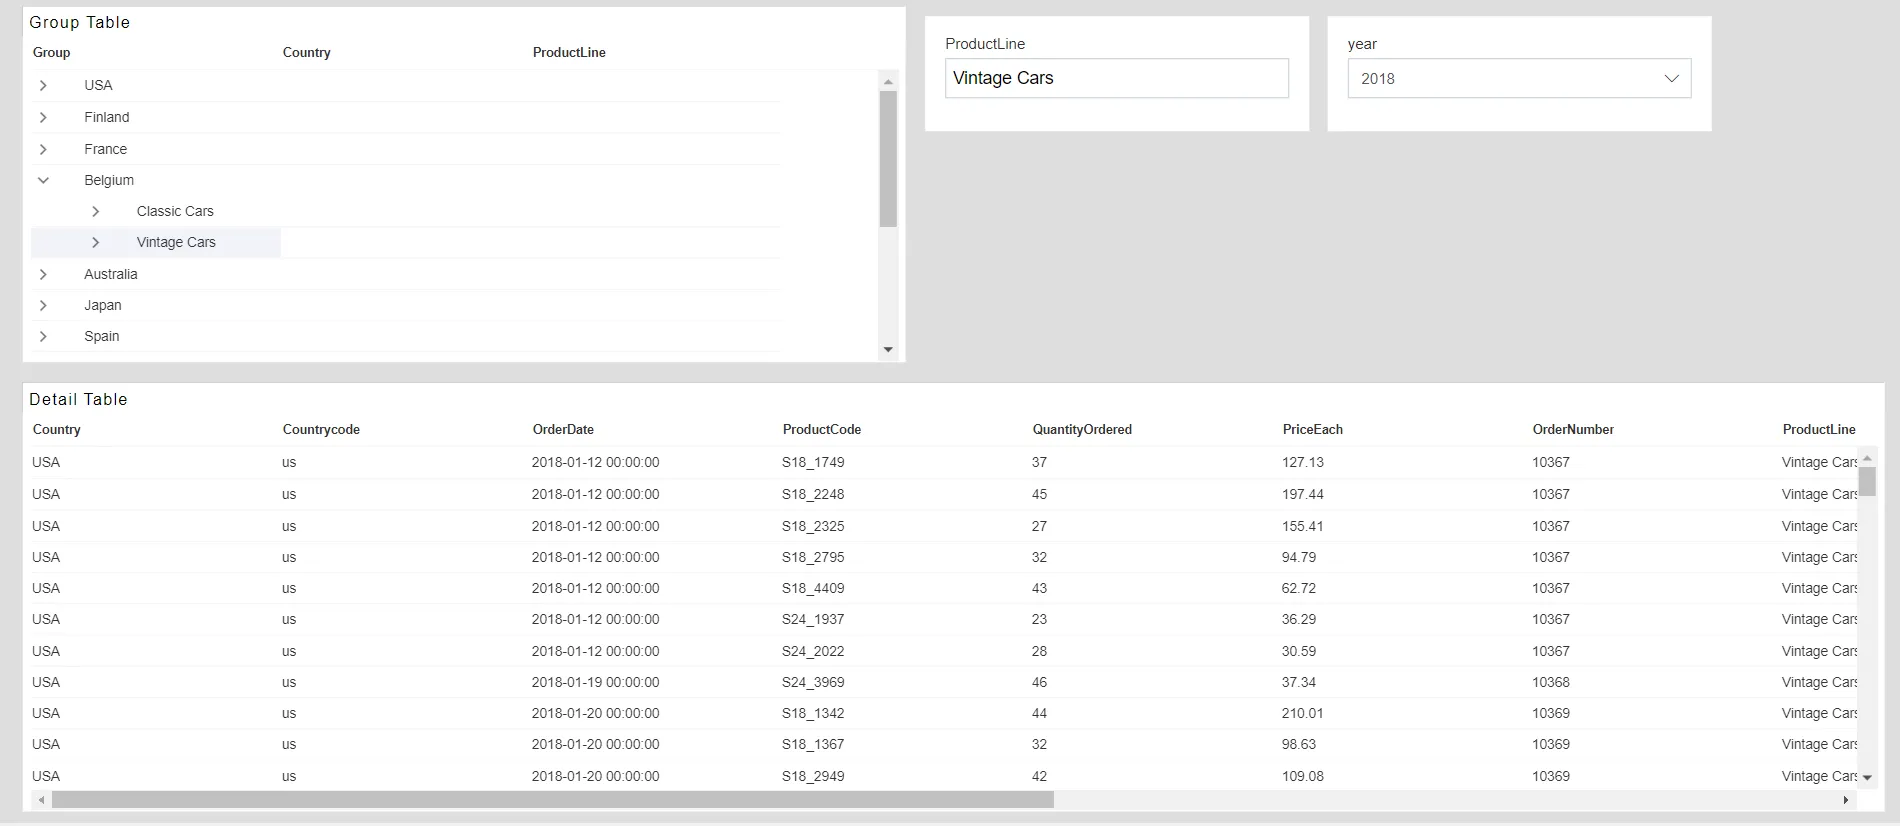
Now, expand the USA grouping in the group table to view the details.
-
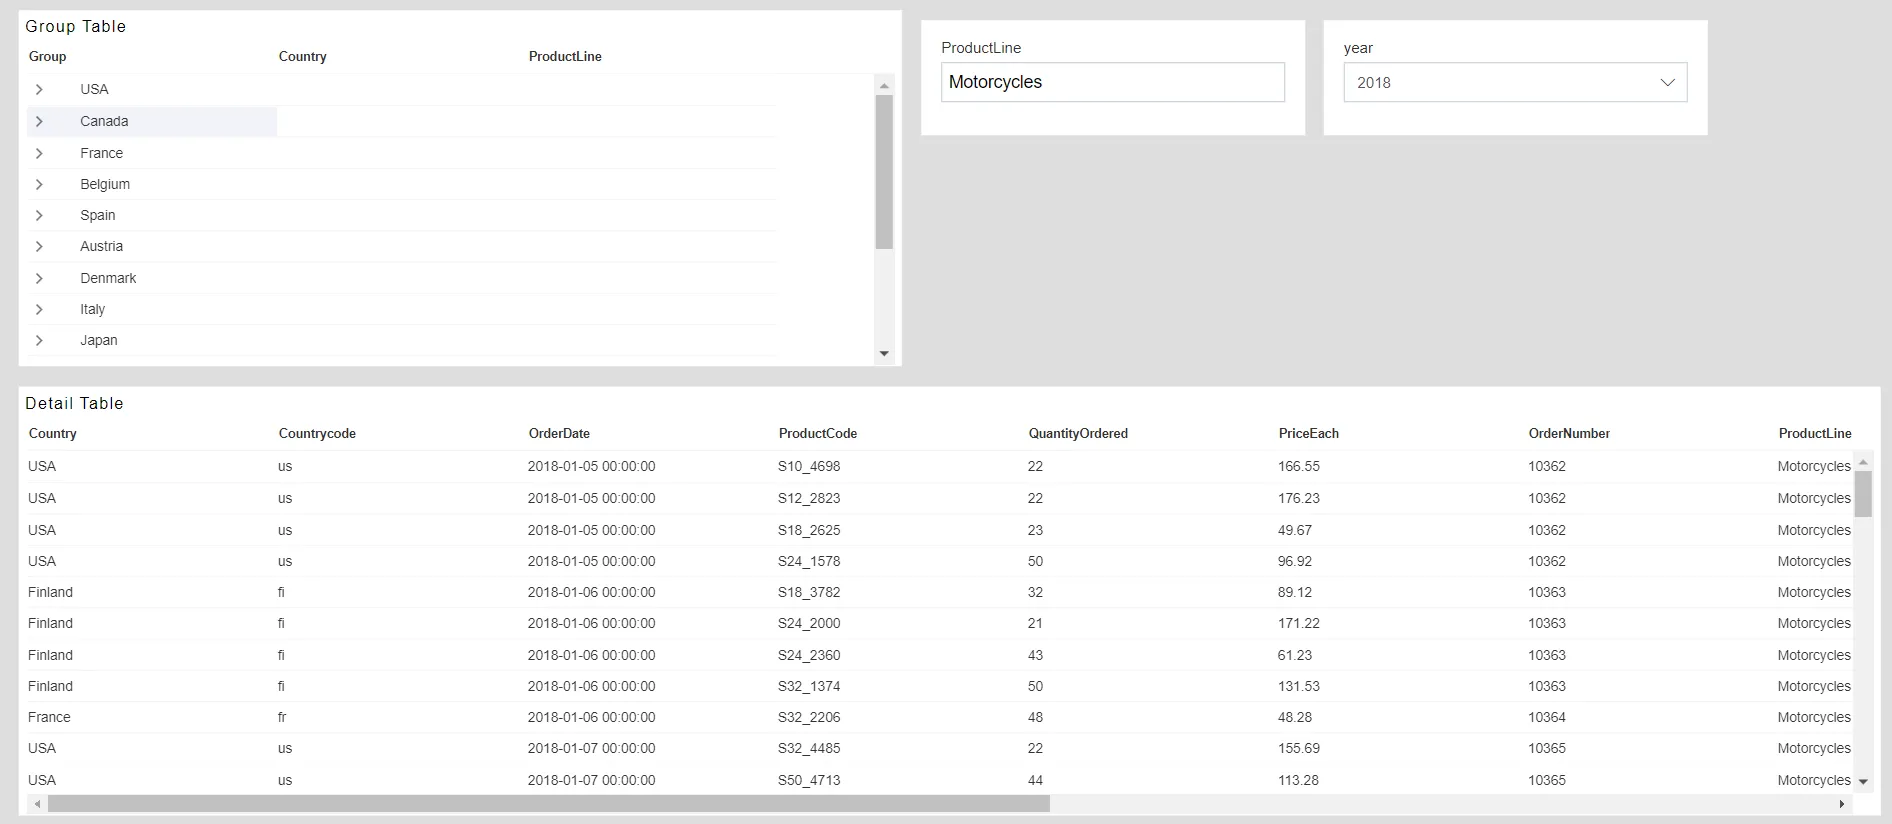
Click on any ProductLine in the group table to filter the details based on the selected productline.
-
When you click on a ProductLine (e.g., “Motorcycle”), the detail table is filtered by the selected product line, as expected. However, you’ll notice that the expanded group collapses each time you click on a product line. This occurs because the year filter is linked to the group table. Each time an event (like clicking on a product line) is triggered, it also triggers the year filter, causing the expanded group to collapse.This happens because all filters, including the year filter, are applied to the entire dashboard, not just the group table.
-
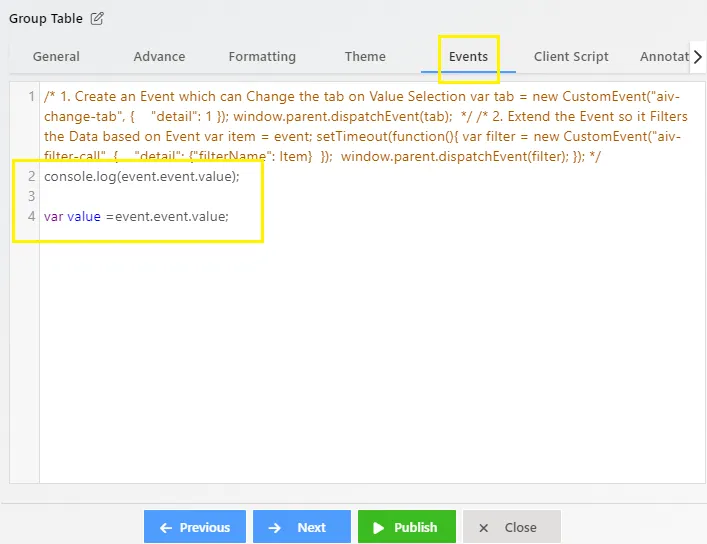
To avoid this, the Skip Widget Event should be added to the event so that it does not filter the calling widget while filtering all others. Edit the widget, go to the Event tab, and add this event after the filter call event: aiv_skip_widgets: [event.widgetProps.widgetId].
-
Now our event is like below:
var value = event.event.value; setTimeout(function(){ var filter = new CustomEvent("aiv-filter-call", { "detail": {"ProductLine": value,"aiv_skip_widgets": [event.widgetProps.widgetId]} }); window.parent.dispatchEvent(filter); }); -
After saving, go to preview, filter both widgets by year, and then try filtering the widgets by productline from the grouped list. You will notice that the grouped list no longer collapses.
To learn more about the features of the Table Widget, click on the links below:
Create Table Widget
Advance Tab Table Widget
Formatting Tab Table Widget
Event Tab Table Widget
Themes Table Widget
Annotation Tab Table Widget
To learn more about the advanced features of the Table Widget, click on the links below:
Custom Column Table Widget
Custom Column Micro Chart
Custom Column Table Widget Icon
Custom Column Table Hyperlink
Skip Widget Event Filtering