Export Data in Excel
Introduction
The introduction of the pipeline represents a novel addition to the AIV Application, enabling users to establish relationships between different datasets and tables through a user-friendly interface. With Pipeline, users can define these relationships without requiring any SQL knowledge, streamlining the process of joining tables and datasets available in AIV.
Moreover, within the Pipeline feature, users have the option to hide the names of columns using the “Hide Pipeline Features” functionality, providing greater control over the display of data.
Furthermore, AIV offers the capability to export data directly to Excel using the Pipeline feature, facilitating seamless data extraction and analysis in a familiar format. This integration enhances the usability and versatility of the AIV Application, empowering users to manipulate and utilize their data more efficiently.
Prerequisites
Exporting data in Excel via Pipeline requires functional JDBC datasets and a list of tables and views.
Objective
How to Export data in excel using Pipeline.
Download Pipeline.zip file from the link given Pipeline.zip
Follow steps to create Reverse Join Pipeline in AIV:-
Follow steps to create Reverse Join Pipeline in AIV:-
To complete the task, follow these steps:
- Open the AIV (Artificial Intelligence Visualization) application.
- Log in using valid user credentials (username and password).
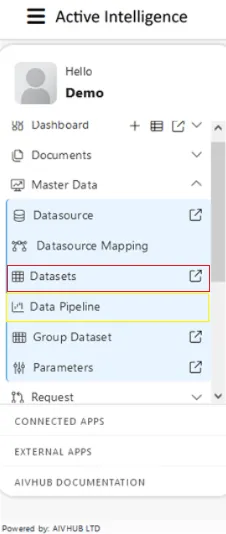
- Once logged in, navigate to the “Master Data” section. This can typically be accessed from the Hamburger menu, which is usually represented by three horizontal lines stacked on top of each other, often located in the top-left corner of the application interface.
- In the “Master Data” section, select the “Dataset” option from the available menu items. If you encounter any issues or need further assistance, feel free to ask!
To create a pipeline using the second method in AIV (Artificial Intelligence Visualization), Look for the option labeled “Create Pipeline” located in the bottom menu bar. Click on the “Create Pipeline” option to initiate the pipeline creation process. This method provides an alternative approach to creating a pipeline directly from the Dataset section, streamlining the process for users. If you encounter any difficulties or have further questions, feel free to ask!
![]()
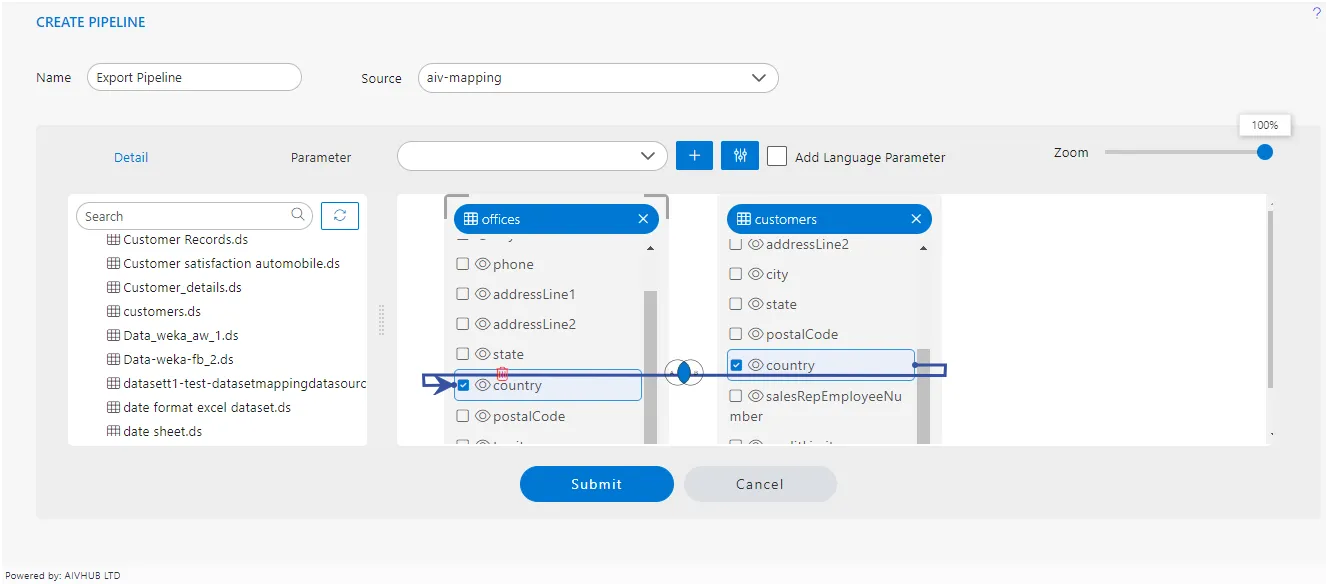
Once you click, you’ll be directed to a blank create pipeline window, resembling the image below:
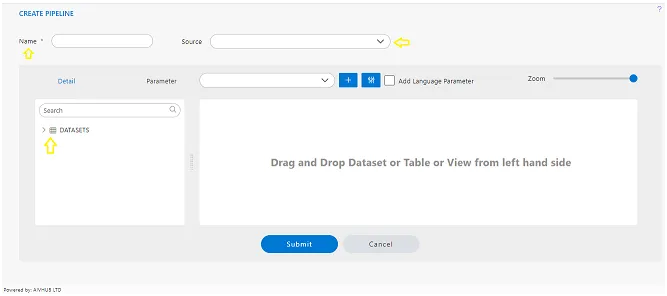
Enter the Following detail in the Pipeline dialog box:
Name: Export Pipeline
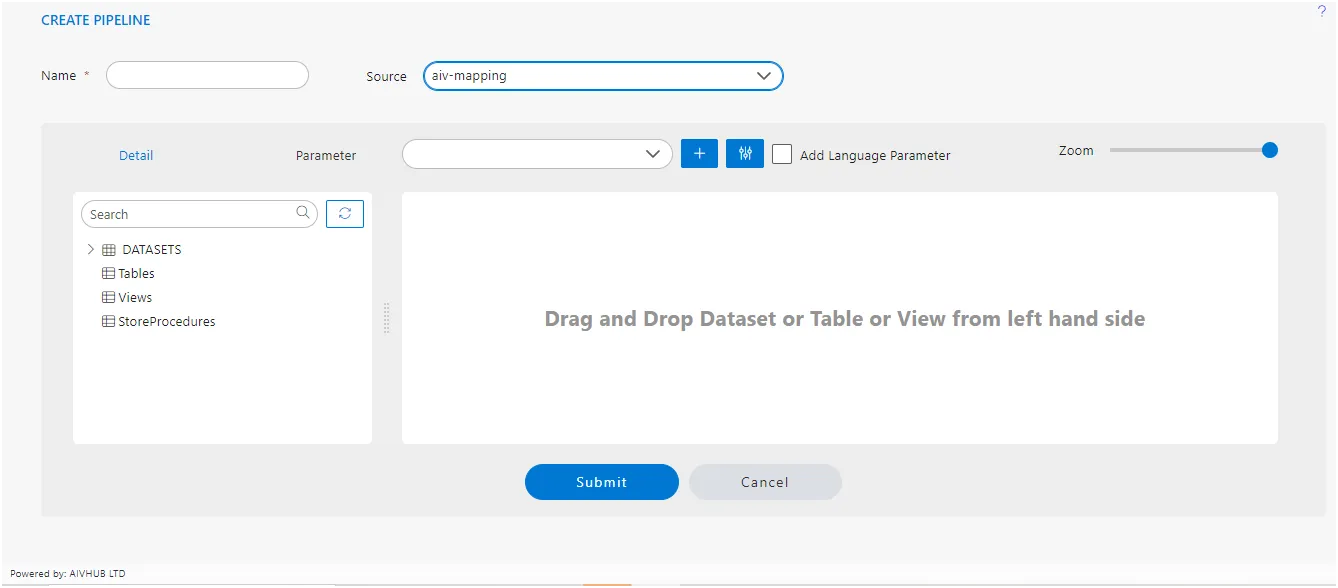
Source: aiv-mapping
Expand tables from the left side table view, As shown in the figure below:
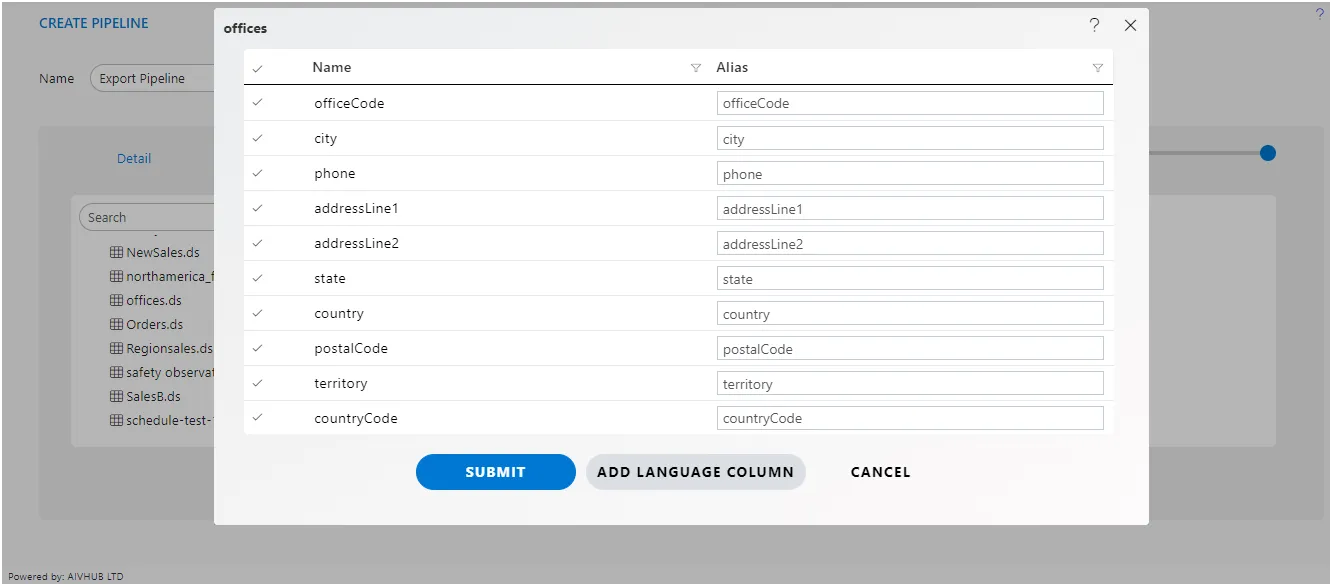
Drag and Drop the OFFICE table from the table box and drag to the diagram box on the right side, and select all the columns from the Select Column dialog box, as shown in the figure below:
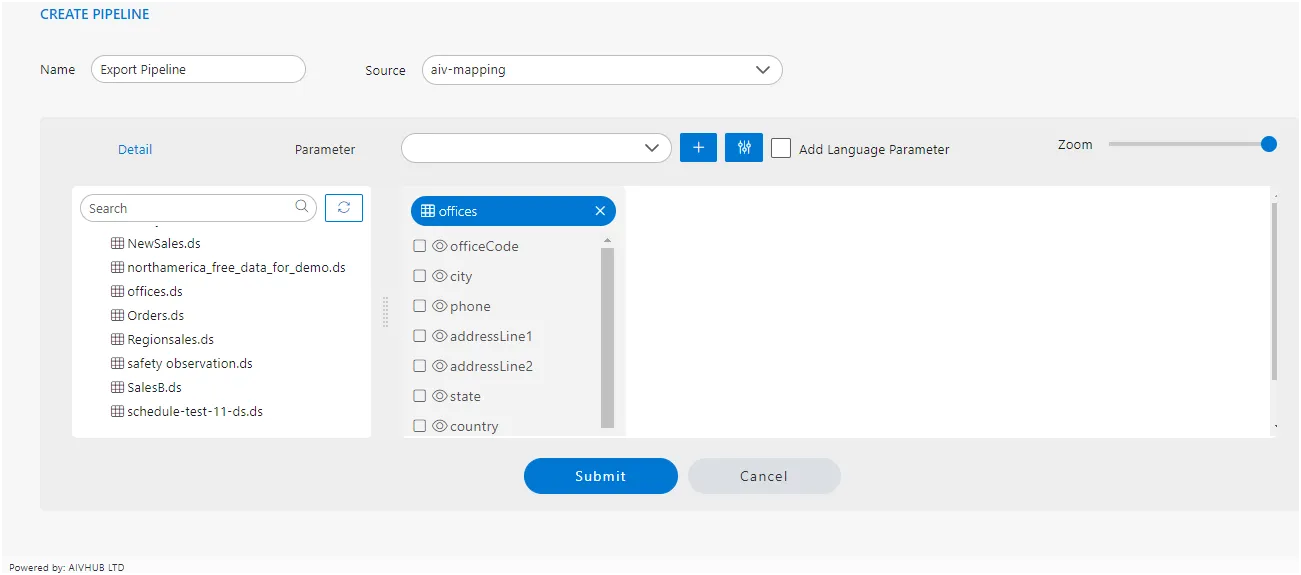
Click on Submit button, after dragging & drop the OFFICE table in the diagram box, look like the figure below:
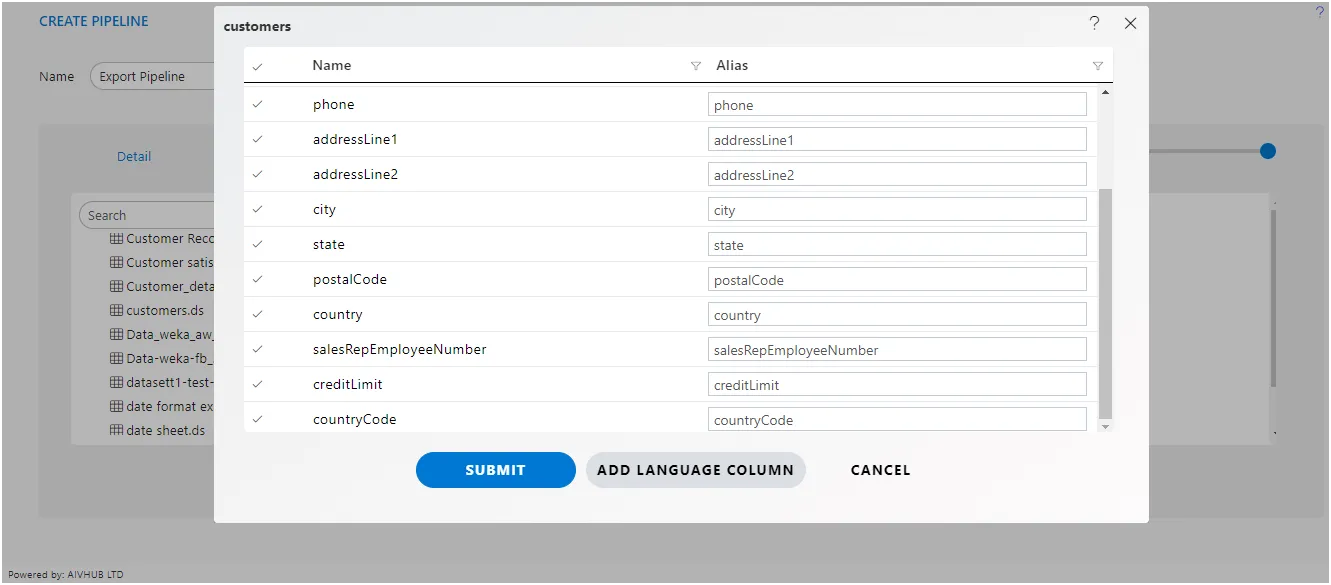
Drag and drop the second table, take the CUSTOMERS table, and drop it in the diagram box.
After dropping the CUSTOMERS table, select all the columns to form the Select Columns dialog box, as shown in the figure below:
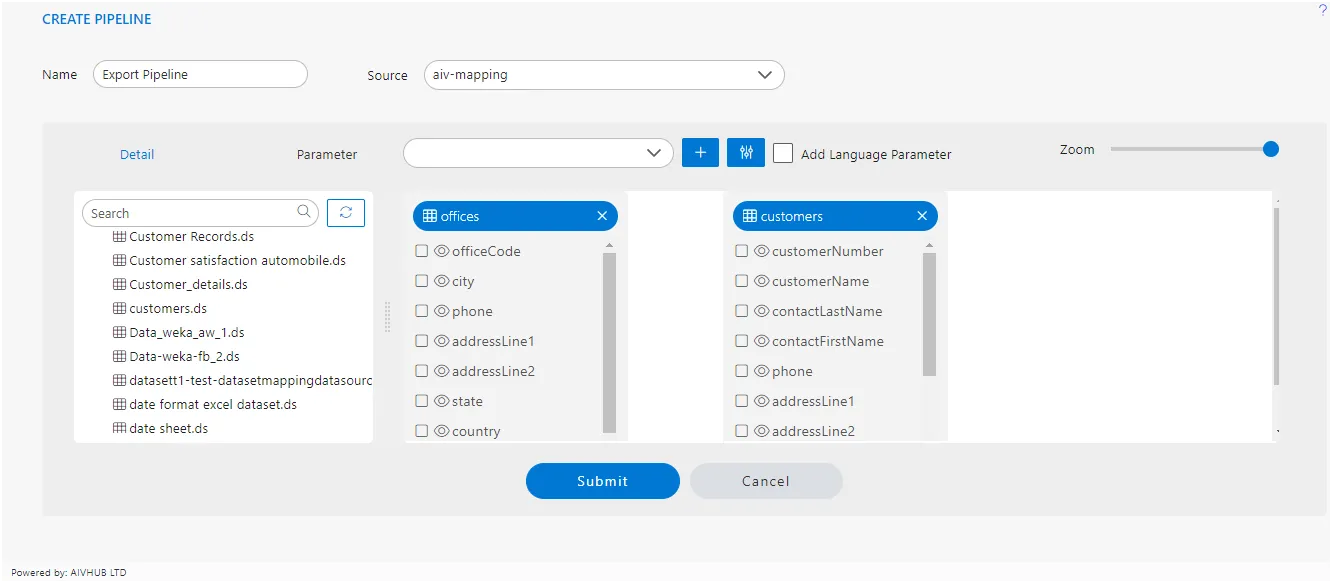
Click on submit button, offices and customers table from the diagram box will look like the figure below:
After adding OFFICES and CUSTOMERS from the table list, Drag the Country column from Customers to Offices, as shown in the figure below:
Click on Submit to save the Pipeline.
To accomplish this task:
Locate the COUNTRY Column: In the diagram box where both the offices and customers datasets are present, find the COUNTRY column within the customers datasets.
Drag COUNTRY Column: Click and hold on the COUNTRY column within the customers datasets, then drag it over to the offices datasets in the diagram box.
Drop COUNTRY Column: Once you’ve dragged the COUNTRY column over the offices datasets, release the mouse button to drop the column onto the offices datasets.
After completing these steps, the COUNTRY column from the customers datasets should be successfully added to the offices datasets. If you encounter any issues or need further assistance.
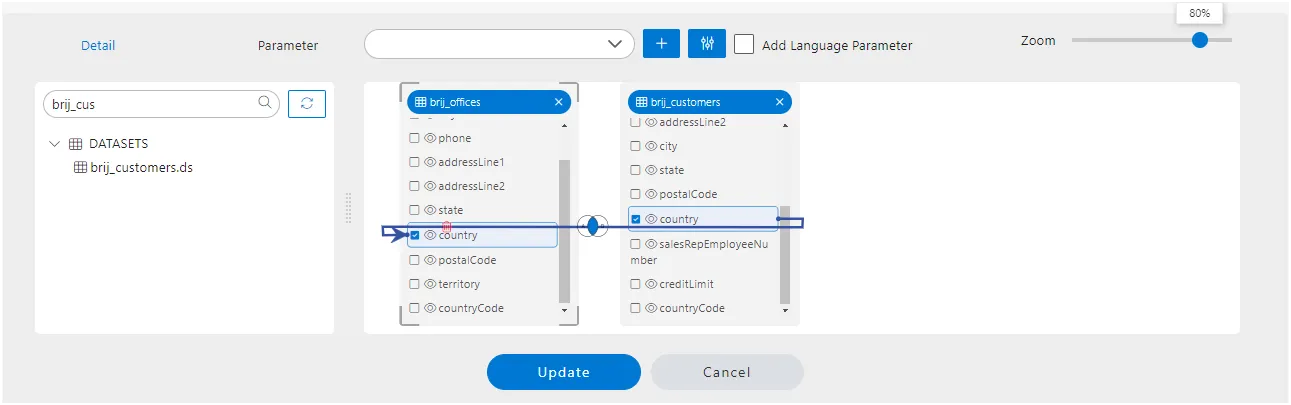
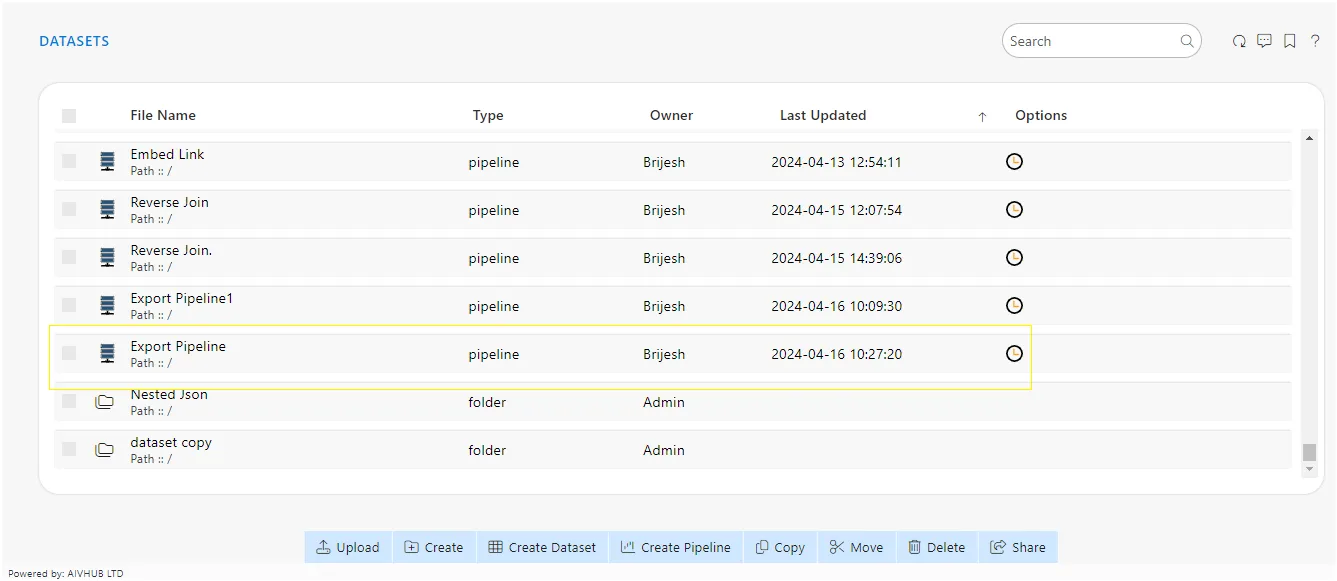
Click on the submit button to save the pipeline and apply your changes. After clicking Submit, you may receive a confirmation message indicating that the pipeline has been successfully saved.you can see your pipeline at dataset section of AIV.
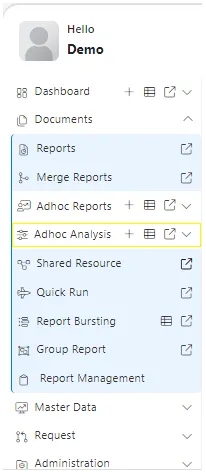
To execute the pipeline in the Adhoc Analysis:
- Navigate to the
"Documents"section within the Hamburger menu. - Select the
"Adhoc Analysis"option.` - Within the Adhoc Analysis interface, locate and click on the
"+"icon to initiate the creation of a new analysis. This process enables the execution of the pipeline within the Adhoc Analysis environment, allowing for further analysis and exploration of the pipeline results.
When you click on create Analysis then the Analysis Selection dialog box will open, as shown in the figure below:
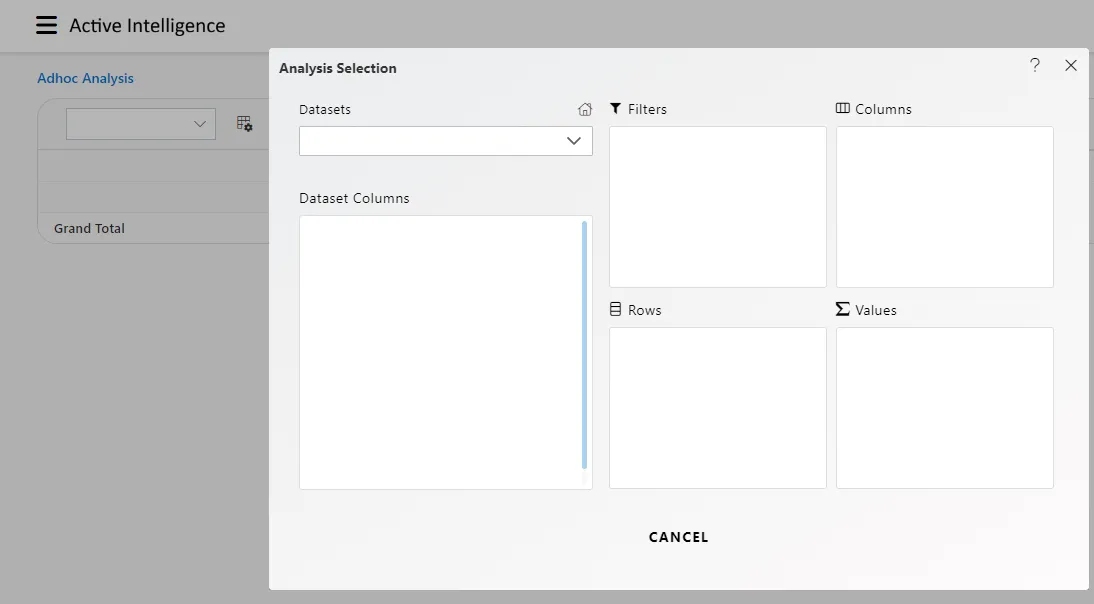
Enter the following details in Analysis Section:
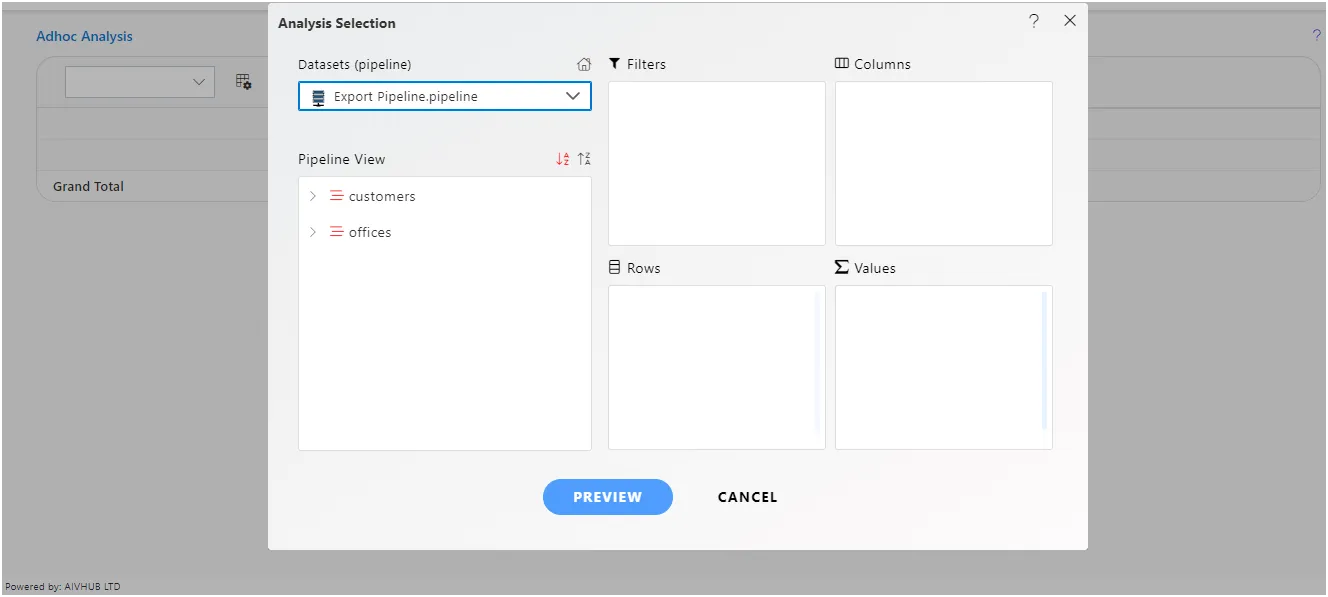
Dataset: Export Excel (select the Pipeline, which you are created)
Once both tables are loaded into the left-side box of the Pipeline view, expand the OFFICES table by clicking on the arrow icon next to its name.
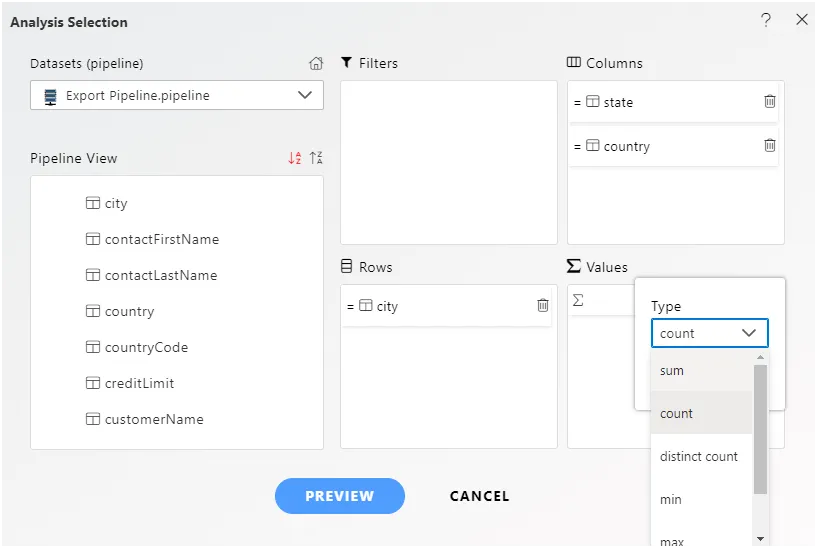
Here’s how to complete the task:
Drag CITY Column to Rows: Locate the CITY column within the OFFICES table. Click and hold on the CITY column, then drag it to the Rows area.
Drag STATE and Country Columns to Columns: Find the STATE and COUNTRY columns within the OFFICES table. Click and hold on each column, then drag them to the Columns area.
Drag CreditLimit Column to Values: Locate the CreditLimit column within the CUSTOMERS table. Click and hold on the CreditLimit column, then drag it to the Values area. While dragging, specify “sum” as the Type.
After completing these steps, the CITY column should be in the Rows area, while the STATE and COUNTRY columns should be in the Columns area. Additionally, the CreditLimit column with “sum” selected as the Type should be in the Values area.
If you have any further questions or need assistance with any step,free to ask on our support team.
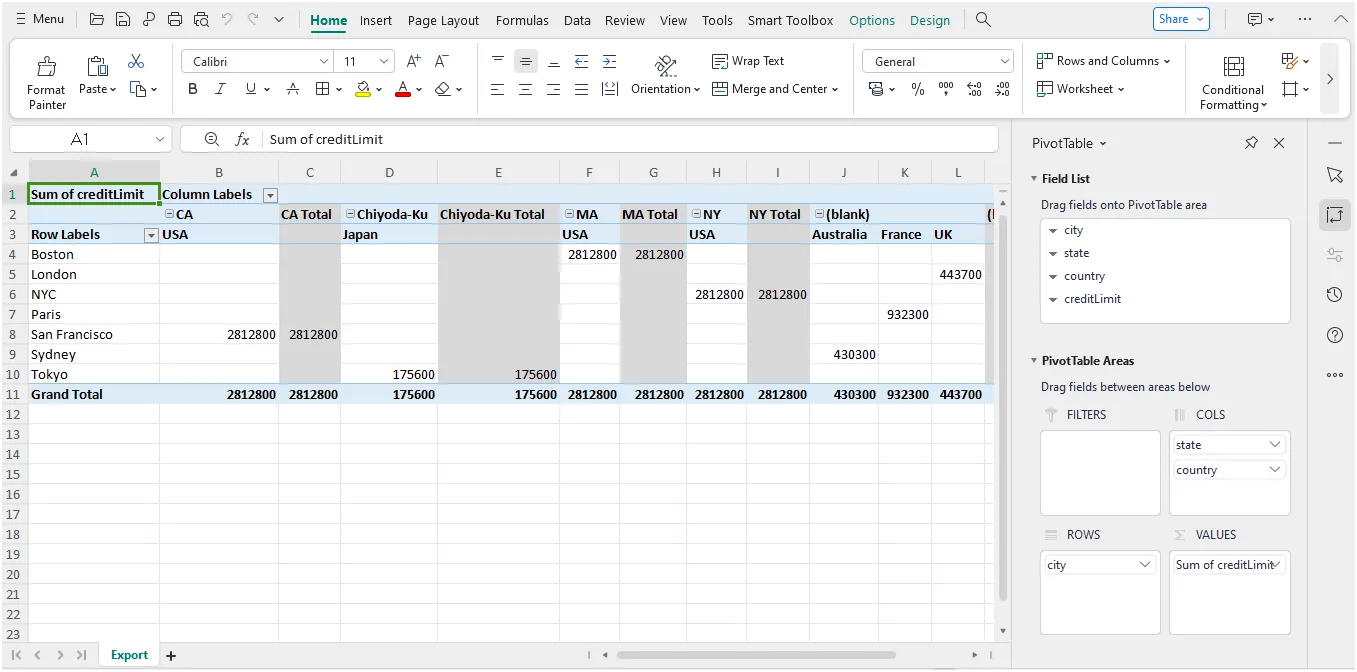
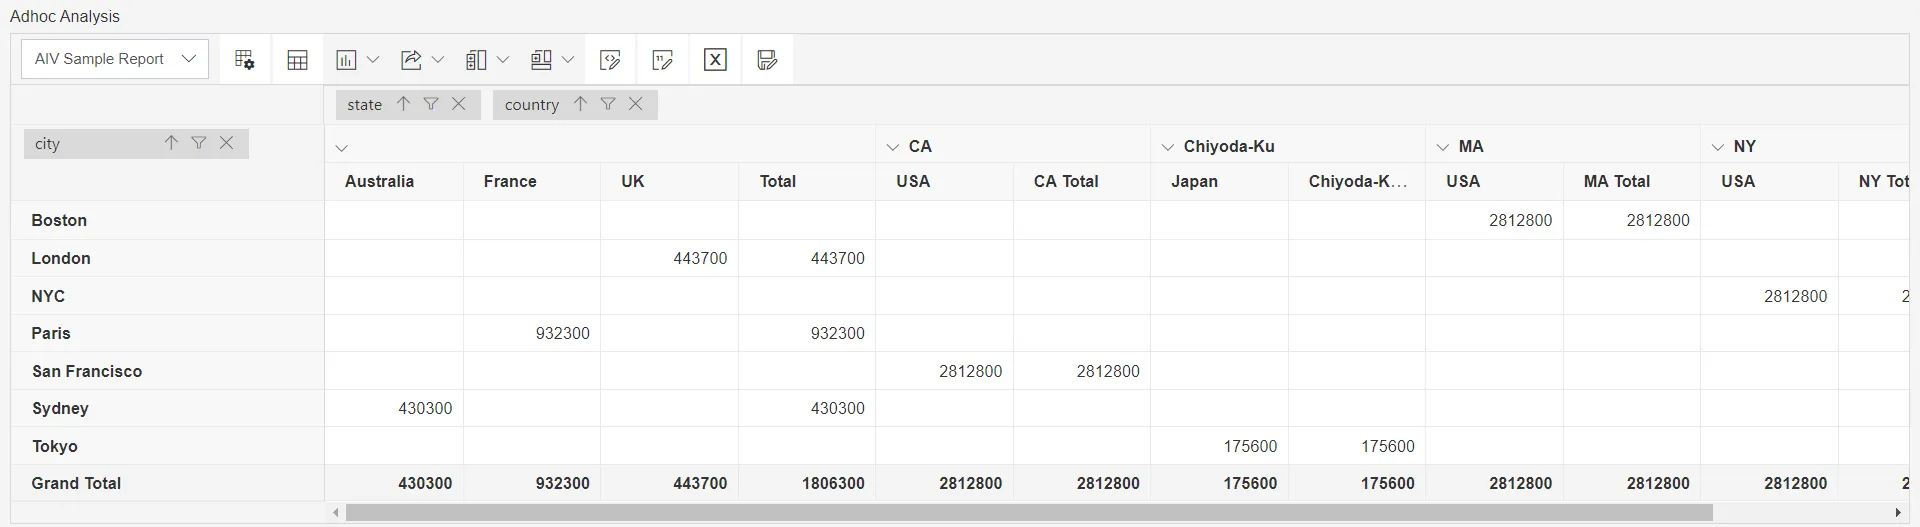
Click on Preview Button it will show the output and after the preview click on Cancel Button it will show the screen as follows:
Click on Save as icon for saving the Analysis, it will show the screen as below:
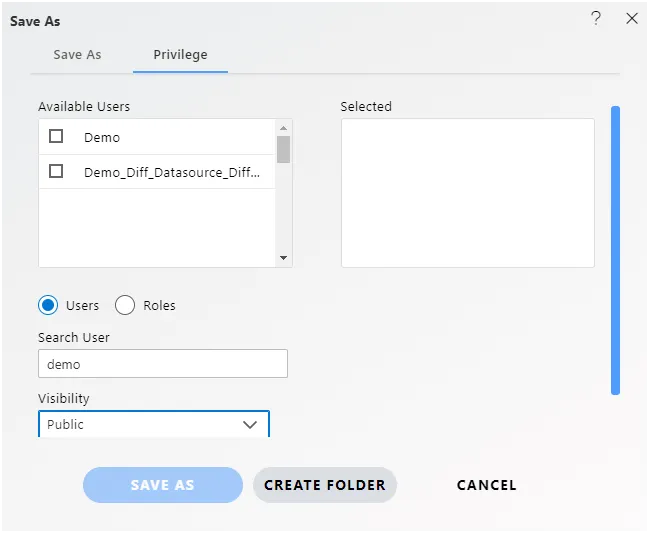
Give the name of Analysis.
Name: Export Excel Pipeline and Select the folder where you want to save Analysis, as shown in the figure below:
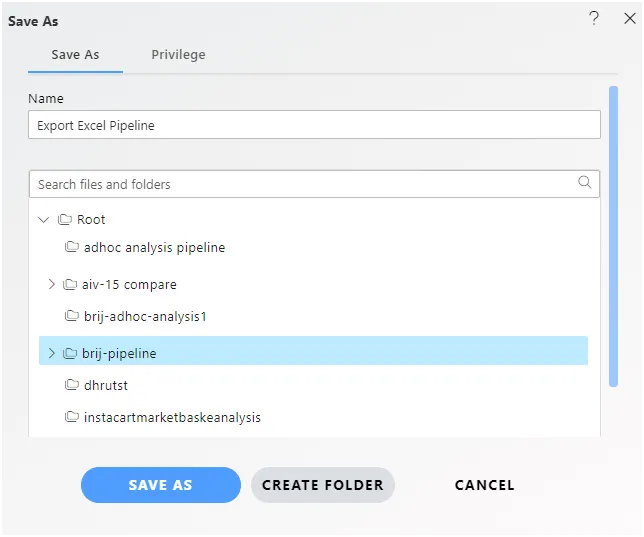
Click on Save As button to save Analysis.
To export the Pipeline data in Excel, locate and click on the Export icon,This action will prompt the export process, allowing you to save the Pipeline data directly to an Excel file.
![]() So the excel file will be downloaded, as shown in the figure below:
So the excel file will be downloaded, as shown in the figure below:
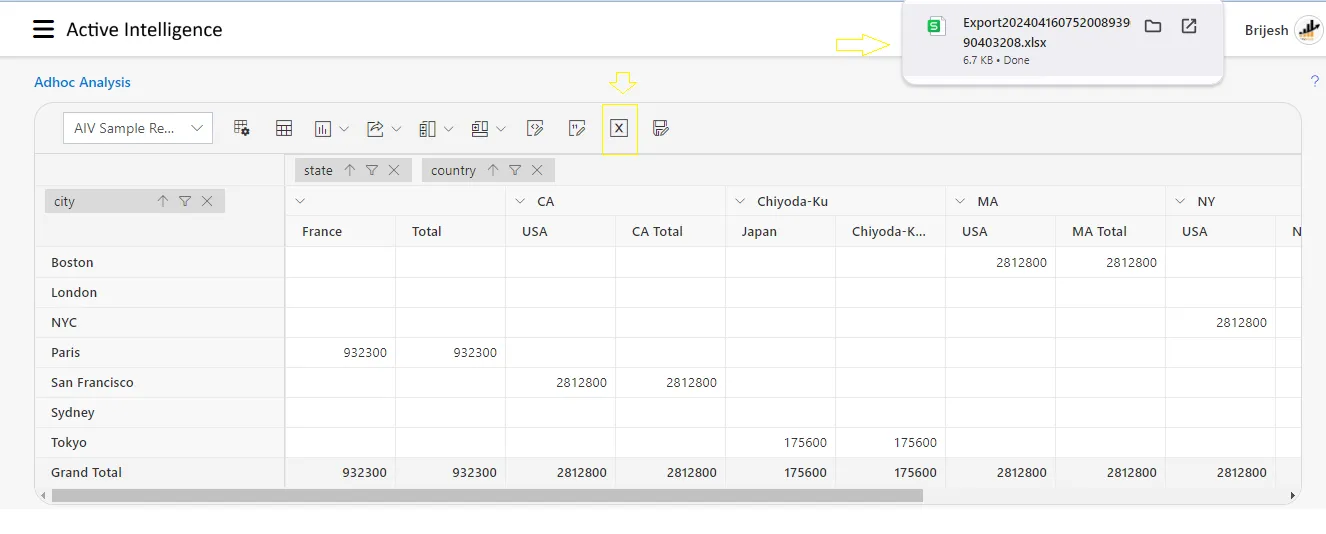
you should be able to open it using Microsoft Excel or a compatible spreadsheet application. Once opened, you’ll see the data presented in a tabular format within the Excel file.