Project Management Dashboard
Introduction
This document contains information about the Project Management Dashboard using Monday.com data and use case information. Project management is the process of leading the work of a team to achieve all project goals within the given constraints. This information is usually described in the project, created at the beginning of the development process. The constraints are scope, time, and budget.
Project management is focused on “perfect planning.” Before you even get started, you break down and schedule the entire project from start to finish.The objective of project management is to produce a complete project which complies with the client’s objectives. Moday.com is a Cloud-based platform that allows user to create their application and work management software.
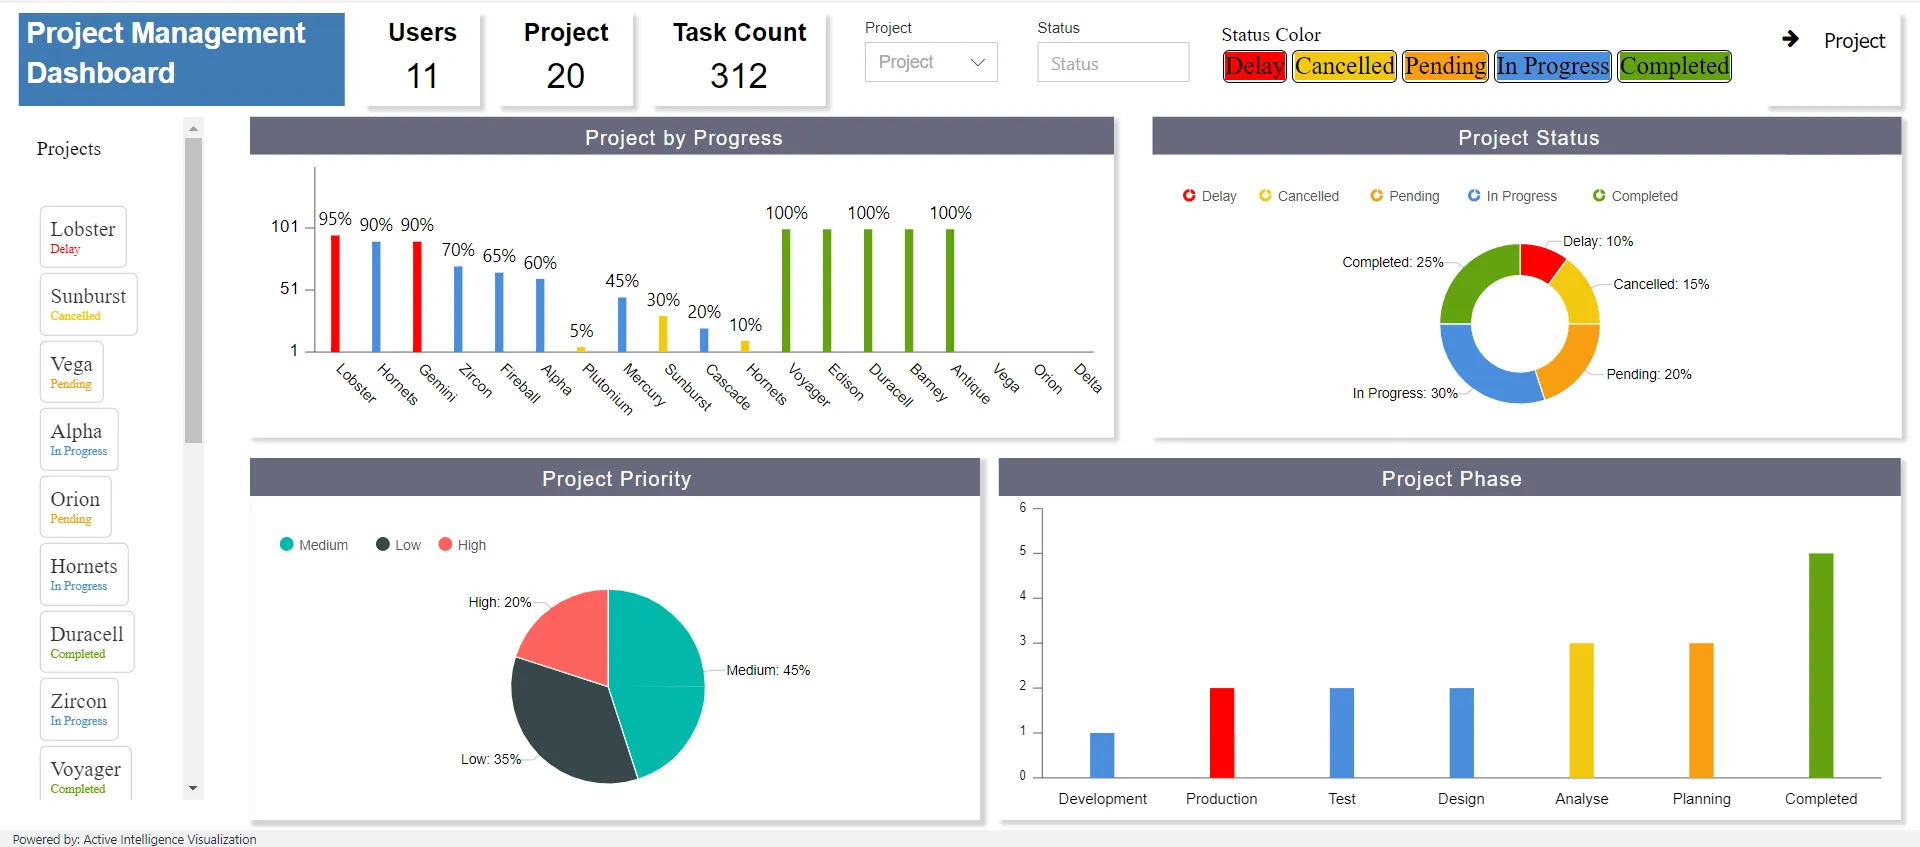
There is four Tab in the Project Management dashboard Overview and Project tab is for Users and Overview, Project, Budget, and Detail data are for Manager and Ceo. when a user will log in with their credential he or she can only see their Project related information and rights provided to that user and manager and the Ceo has the right to see all the information of all the Projects.
Problem1
In a company or Organization, multiple projects are assigned to a single manager.The manager will assign those Projects to multiple Users, so in that case, the manager has to ask every time to the user to know about the status or progress of the project every day.It is Time-Consuming and difficult for managers and Users.
Solution1
So, in this case, using the Project Management Dashboard Manager can see all user tasks, Progress, Project start date, end date, and everything about project information in only see the dashboard.It is more convenient, time-saving for users and Managers.
Project Dashboards should offer real-time analytics to show project managers the health of a project. Thus, enabling them to make swift and informed decisions.
Problem2
Within the company or organization, the CEO asks the manager for full details on the project.Every day, multiple users send their project details to the manager in an Excel file.So the first manager has to merge all the excel files, create a report and then send it to the CEO.In this case, there is a possibility of making an error in the reports.It is time-consuming and difficult for the manager to merge excel files and send them to the CEO.
Solution2
Using Project Management Dashboard manager can share the dashboard directly with the CEO.A CEO can immediately see a detailed overview of the Project in one glance. It reduces the amount of time to compile reports, saving you time.Dashboards provide a very quick, high-level overview of projects to understand.
Prerequisites: Management.ds, Project Management Dashboard
List of Filted used in Project Management Dashboard
Project: Project filter is linked with User, Project, Task count, Project By Progress, Project Status, Project Priority, Project Phase, status details, Project Completion Time, Project wise Task, Budget, Actual Expense, Yearly Budget, Distributed Budget, Budget vs Actual Cost, Budget Status and Detail data KPIs with Project Column. so, it will filter and display the all information of the selected Project.
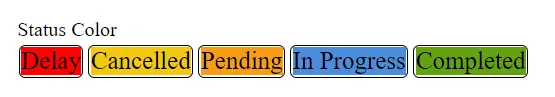
Status: Status filter is link with User, Project, Task count, Project By Progress, Project Status, Project Priority, Project Phase, status details, Project Completion Time, Project wise Task, Budget, Actual Expense, Yearly Budget, Distributed Budget, Budget vs Actual Cost, Budget Status and Detail data KPIs with Status Column. so, it will filter and display the all information of the selected Status. the status filter is linked with status color KPI so when you click on any status like Delay, Cancelled, Pending, In Progress, Completed it will filter the data status-wise.
Year: Year filter is linked with Detail data KPIs in Project Management Dashboard.
Milestone: Milestone(Phases) filter is linked with Detail data KPIs in Project Management Dashboard.
Priority: Priority(Like High, Medium, Low ) filter is linked with Detail data KPIs in Project Management Dashboard.
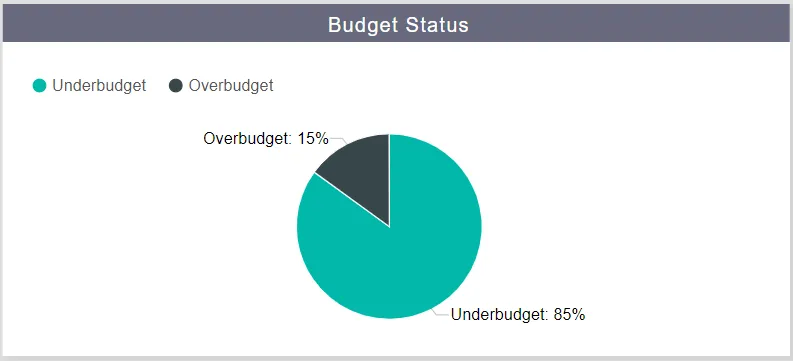
Budget Status: Budget Status(Like Under Budget, Over Budget ) filter is linked with Detail data KPIs in Project Management Dashboard.
List of KPIs used in Project Management Dashboard
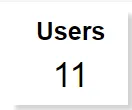
Users: It displays the total number of users assigned for all the Projects.
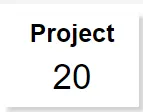
Projects: It Displays the Total number of Projects.
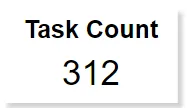
Task Count: It displays the total number of tasks allocated for the Projects.
Projects: It Display the list of all the Project name, when you click on any Project name you will get all the information of that Project like user name, Progress, status, Priority, Phase, Task count, start date, End date.
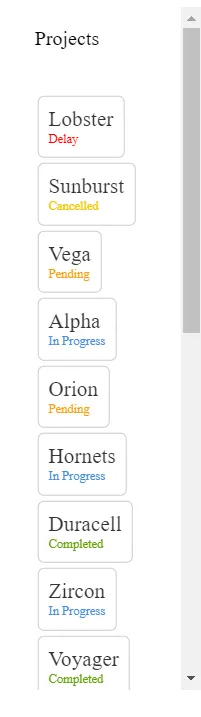
Status Color: It shows the colorwise status of projects.
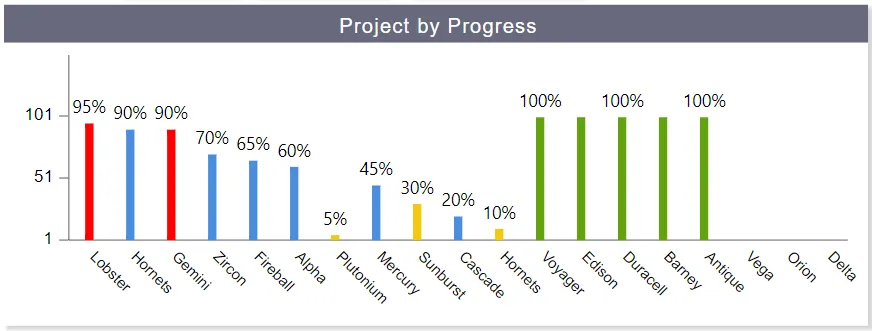
Project By Progress: It displays the Progress of the project in Percentage.
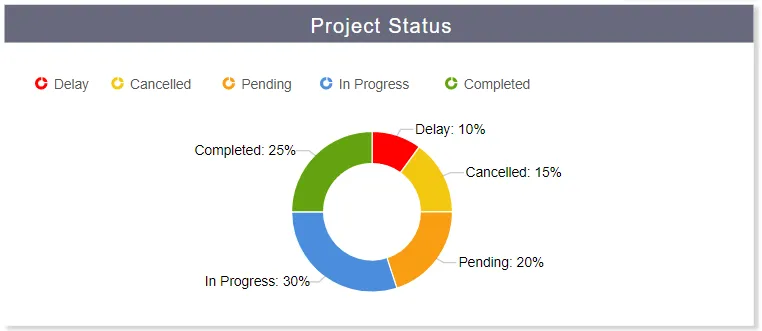
Project Status: it displays the Count of all the project statuses like completed, Pending, In Progress, Cancelled. when you click on any status it will filter out all the details of that status that you selected.
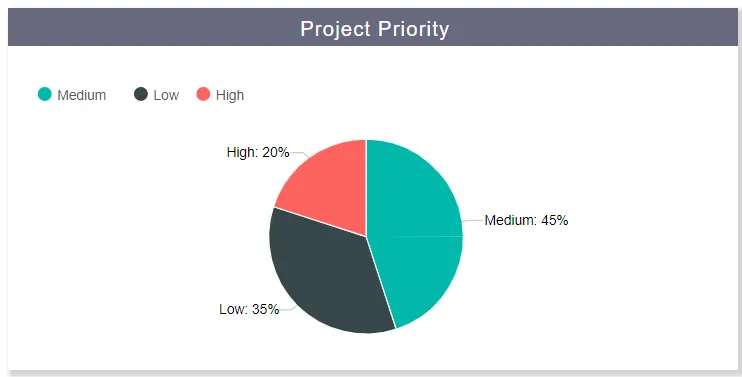
Project Priority: It displays the Count of all project Priority like how many projects have Medium, Low, High Priority.
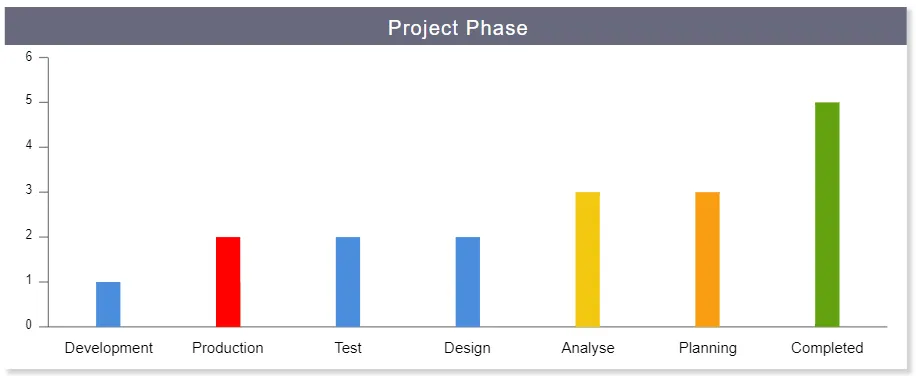
Project Phase: It displays the Project is in which state like Planning, Analyse, Design, Development, Test, Production, completed.
Project Tab:
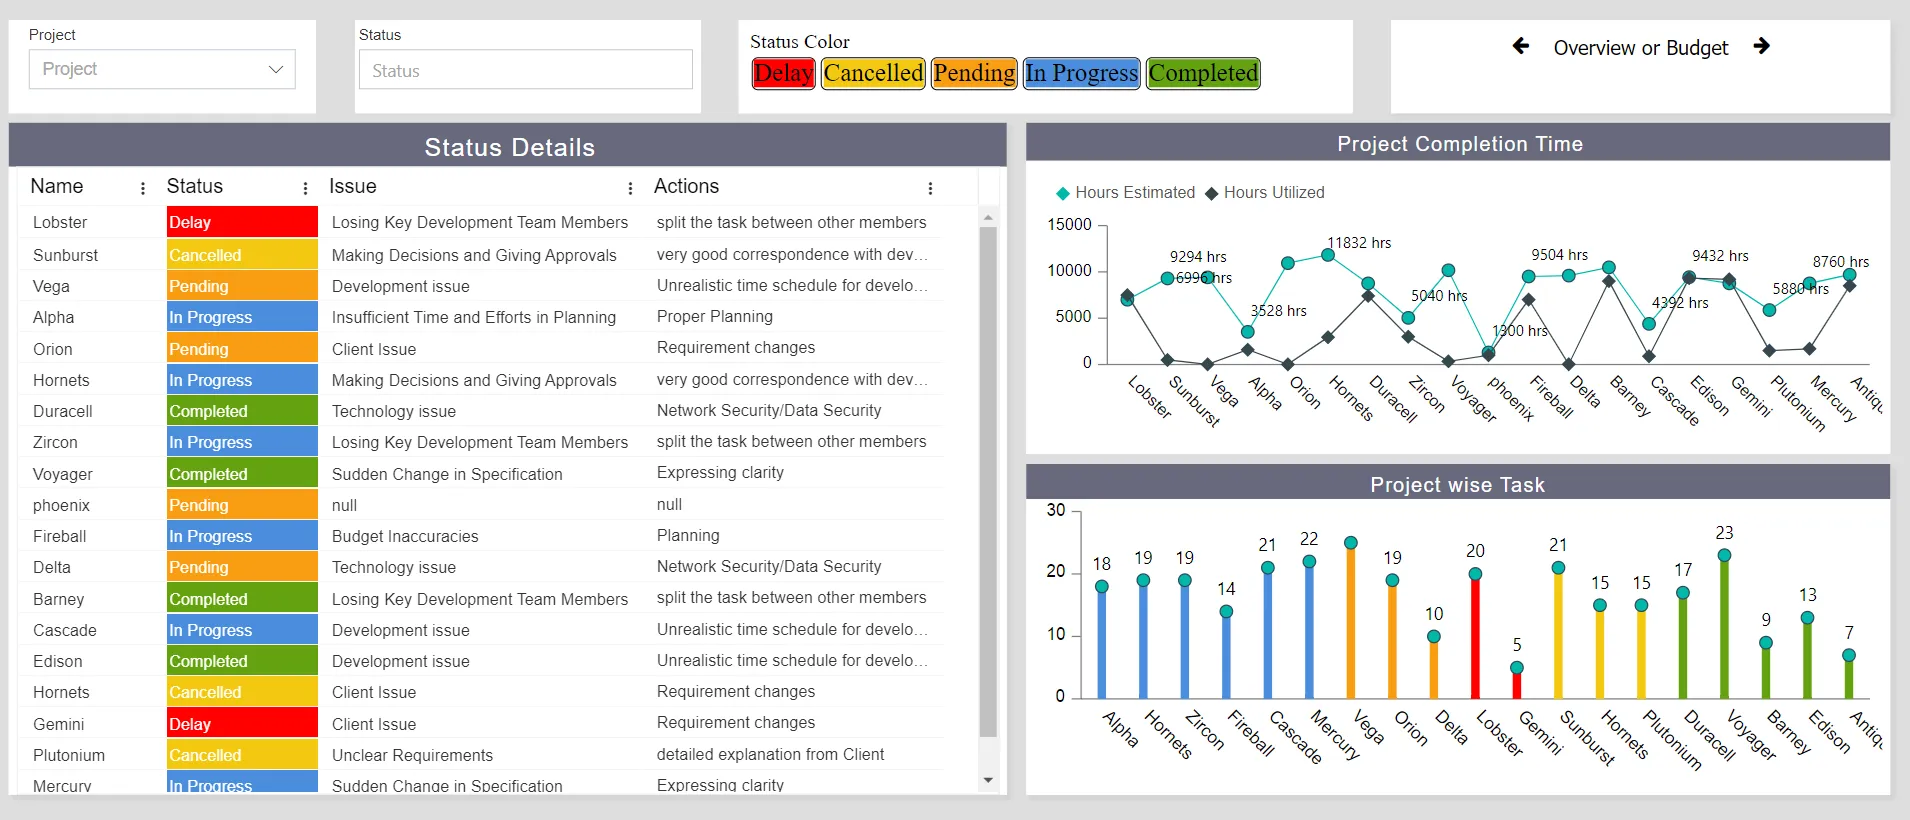
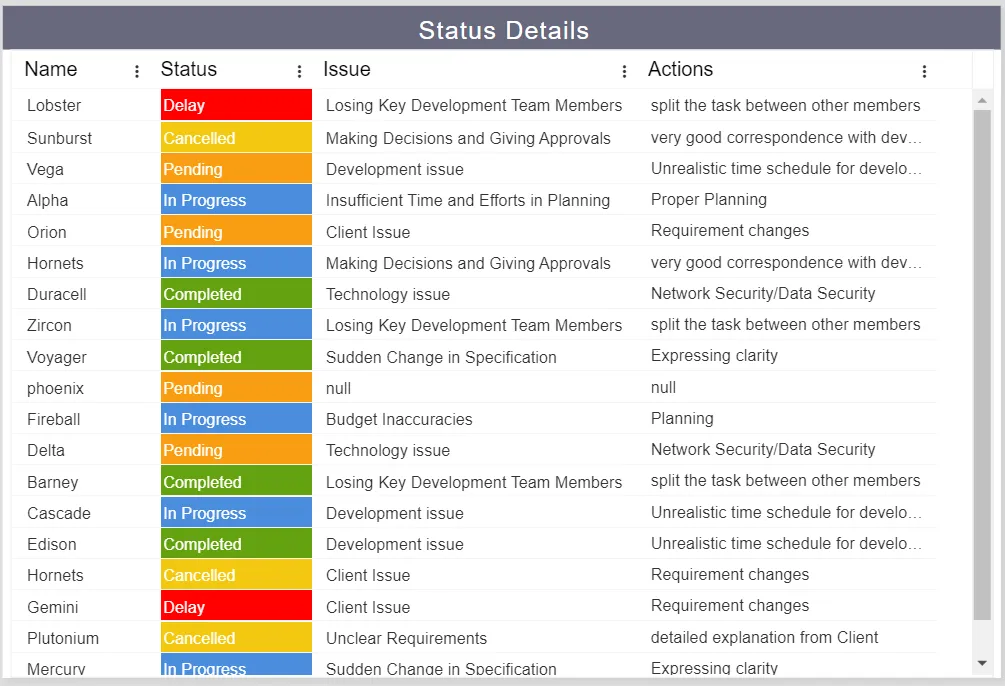
Status Details: It displays the Project Name, Status, Issue, and Action is taken for the issue.
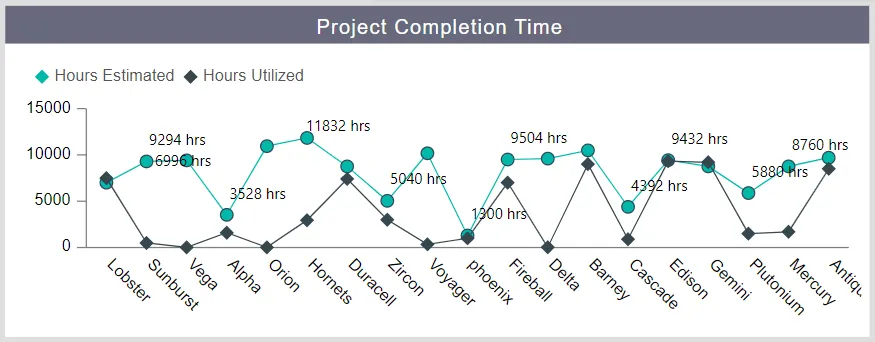
Project Completion Time: It Display the Estimated Time and Utilized Time for the Projects.
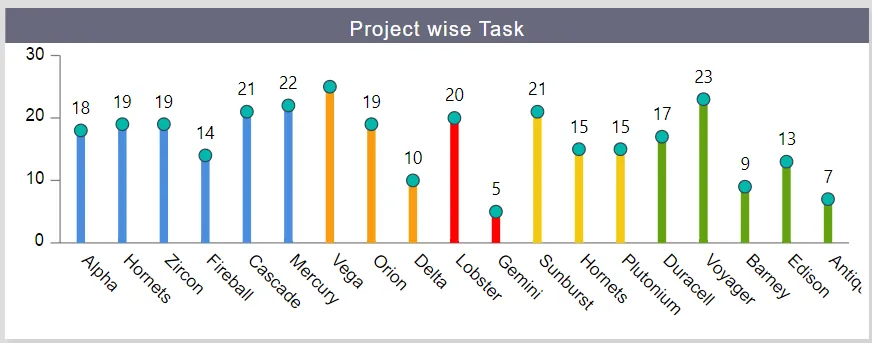
Project wise Task: It displays the total number of tasks allocated for the projects.
Budget Tab:
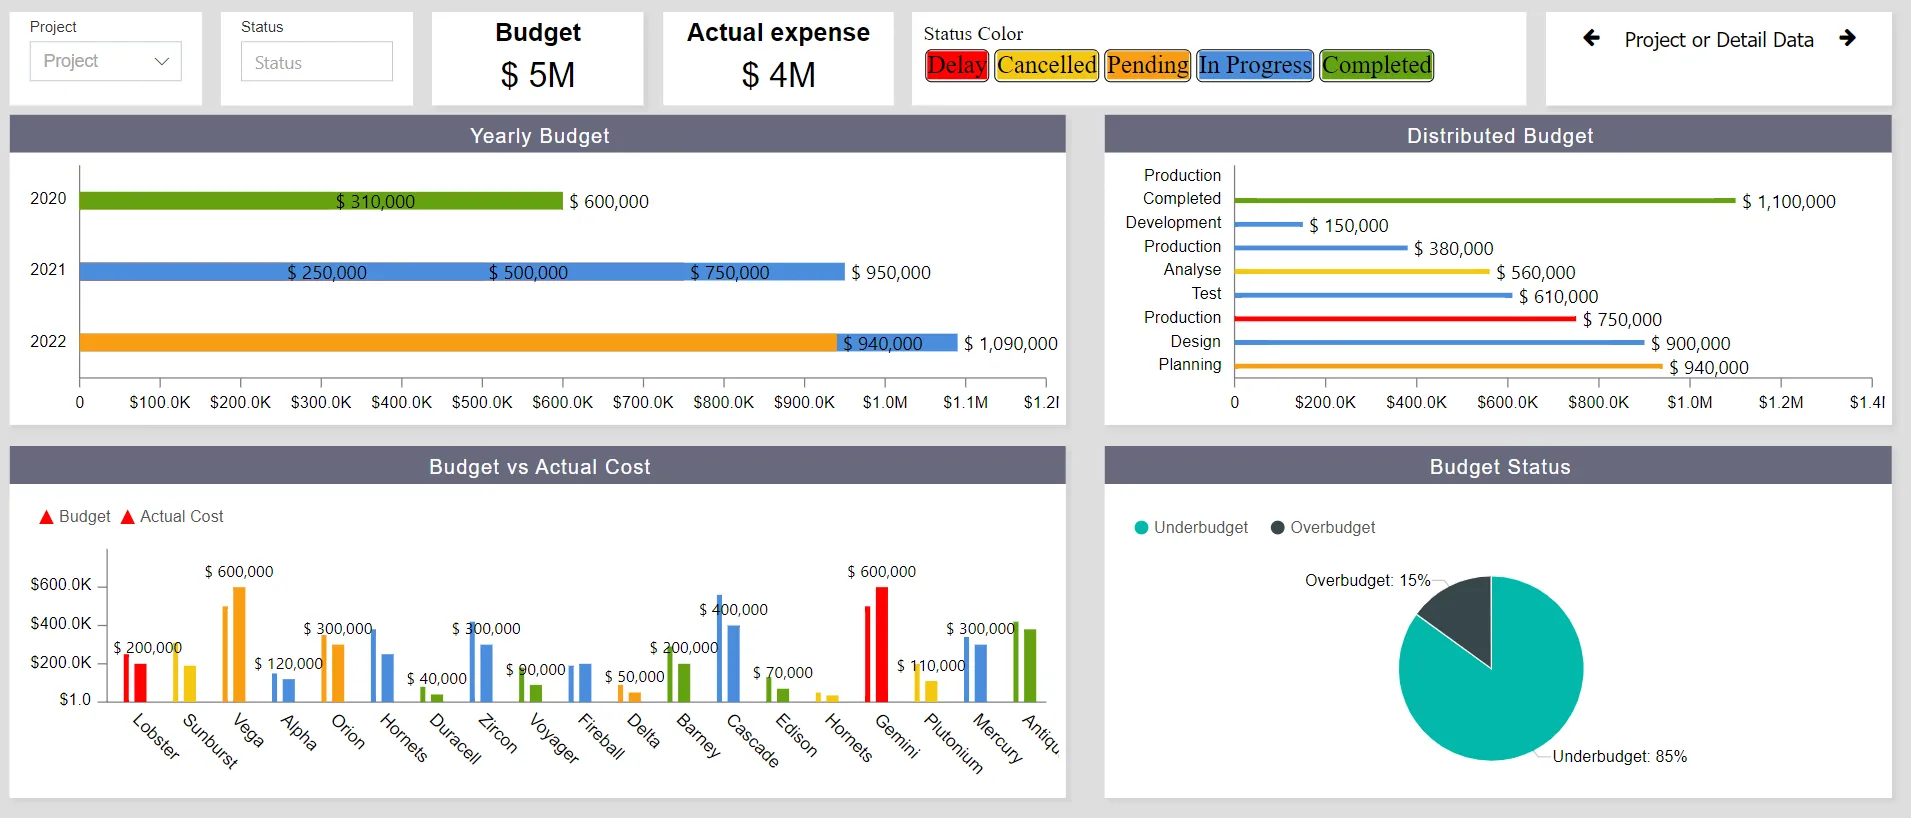
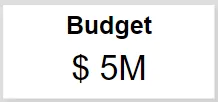
Budget: It shows the total budget of all the Projects.
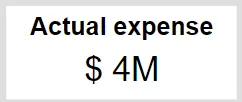
Actual Expense: It shows the actual budget used for all the projects.
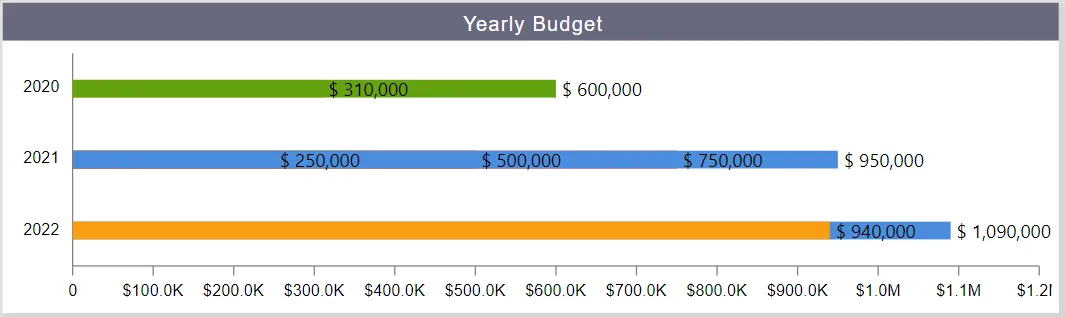
Yearly Budget: It displays a year-wise budget for the years 2020, 2021, 2022.
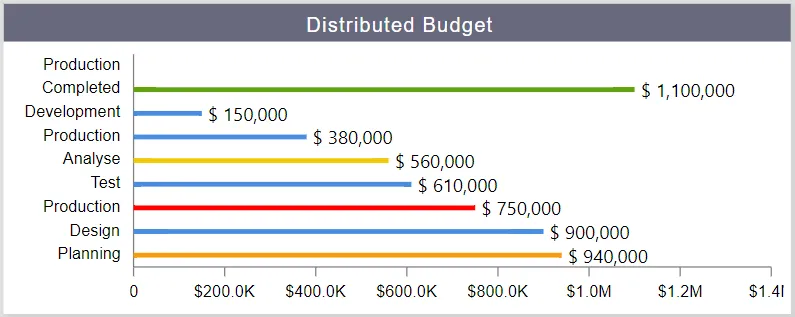
Distributed Budget: It displays a phase-wise budget distributed for all the projects.
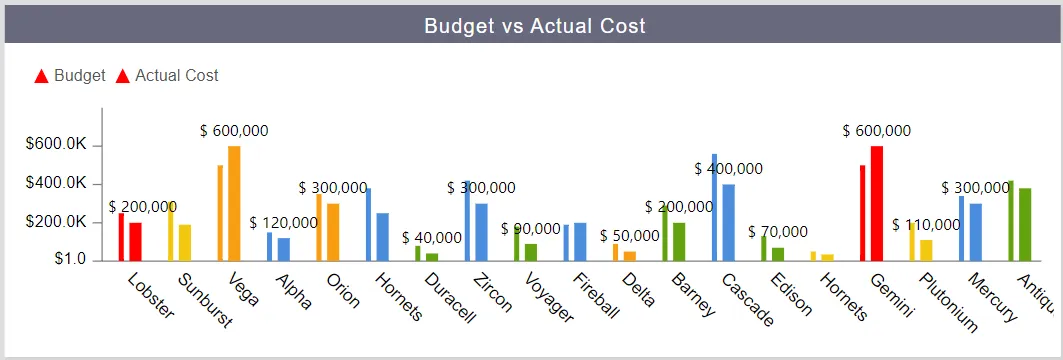
Budget vs Actual Cost: It displays the project-wise budget allocated and utilizes the budget for all the Projects.
Budget Status: It display Budget Status like Over Budget and under Budget Project counts.
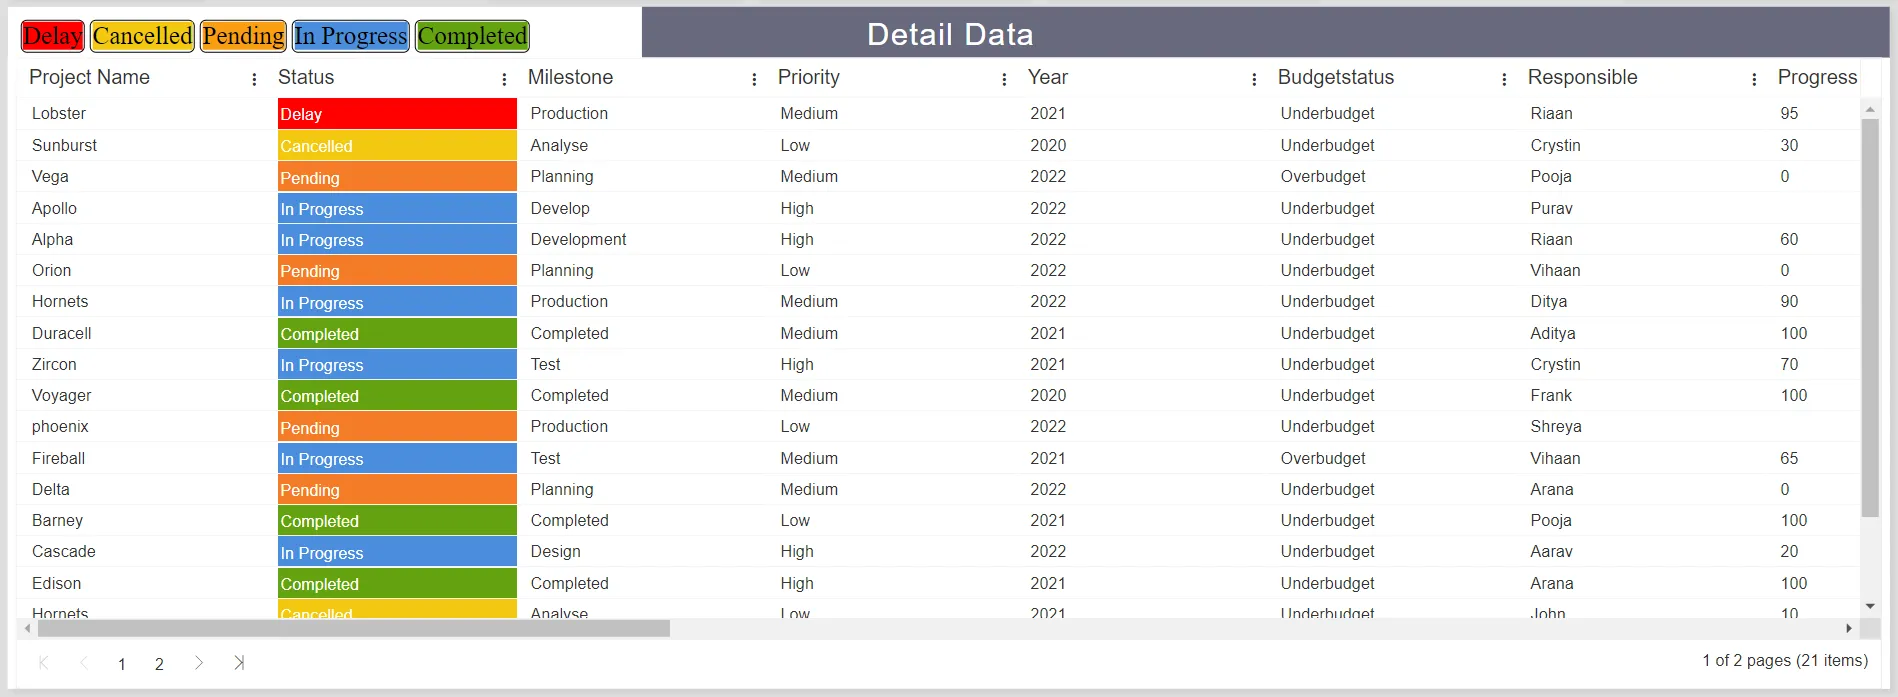
Detail Data Tab:
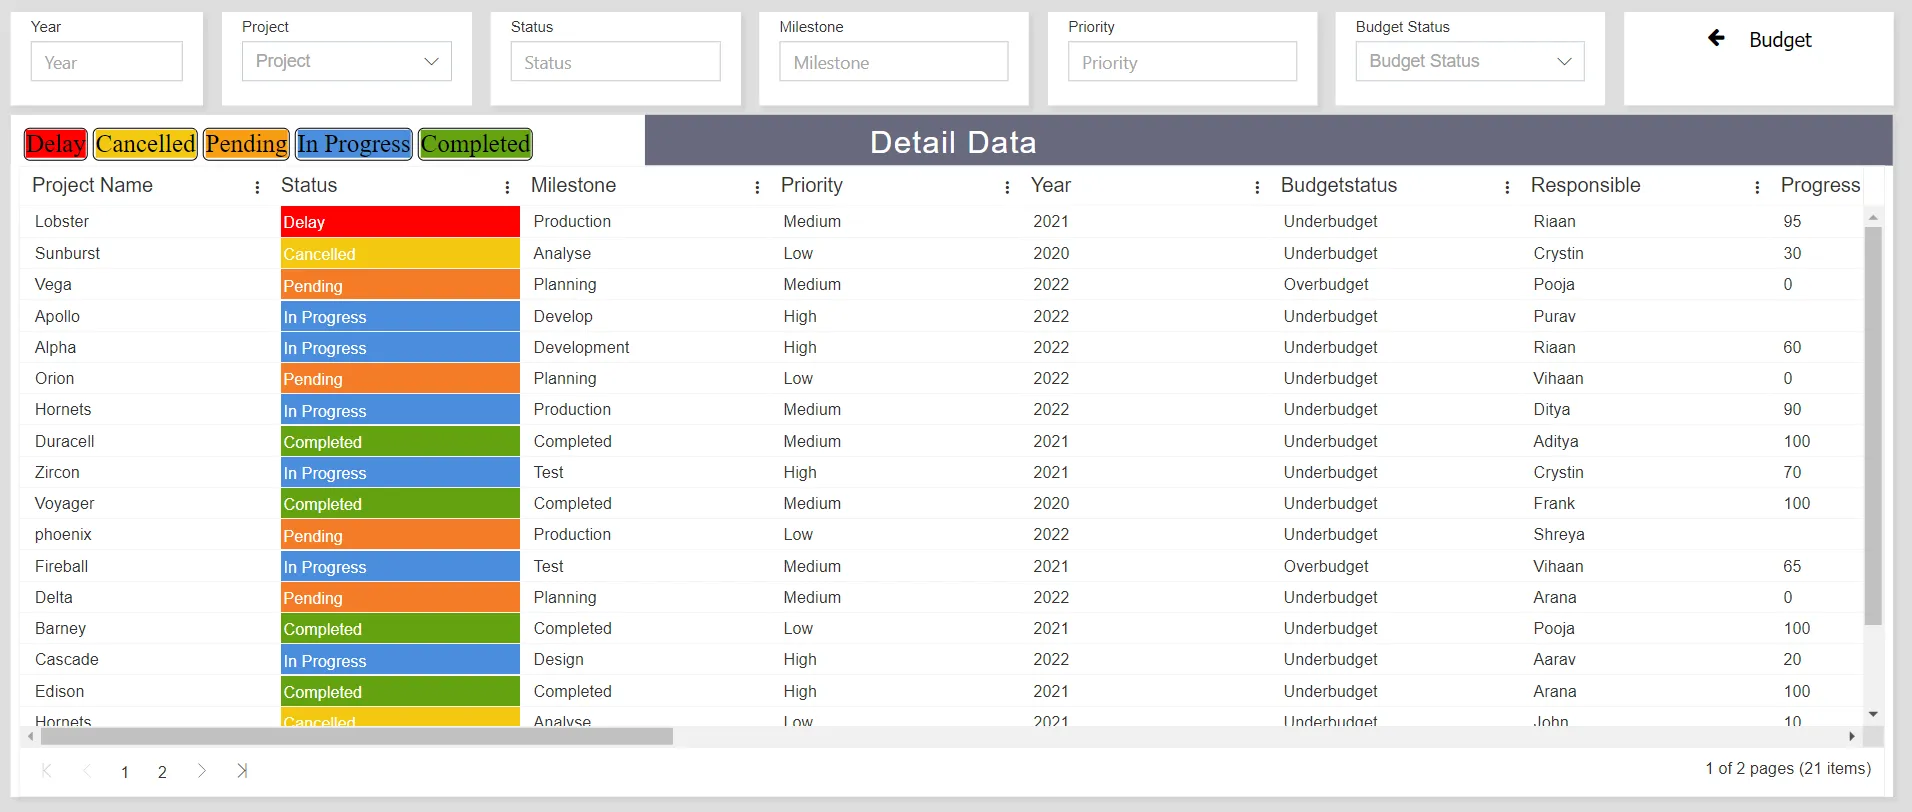
Detail Data: It displays all the information of the Projects.