AIV Custom Visualization Buddy
AIV Custom Visualization Buddy allows users to enhance their AIV dashboards with custom visualizations by generating HTML, JavaScript, and CSS code based on natural language prompts. This feature enables extensive customization for charts, maps, tables, and more, with the added ability to refine or adjust visualizations based on previous responses.
Key Features
-
Automatic Code Generation: Describe the visualization needs in plain English, and AIV Custom Visualization Buddy will automatically generate the required HTML, JavaScript, or CSS code.
-
Custom Visualization Options: Create and integrate unique visualizations, including charts, maps, and tables, or design custom dashboard components.
-
Enhanced Dashboard Functionality: Customize the dashboard with code to meet specific visual and functional requirements.
-
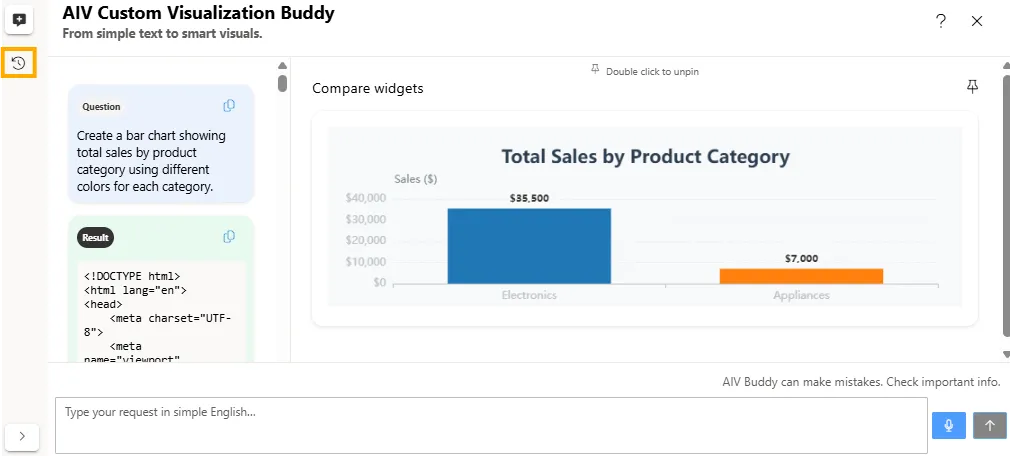
Query History: Maintain a history of prompts and generated code to review and build upon previous customizations. Additionally, options are available to rename or delete entries in the query history to better manage and organize the workflow.
-
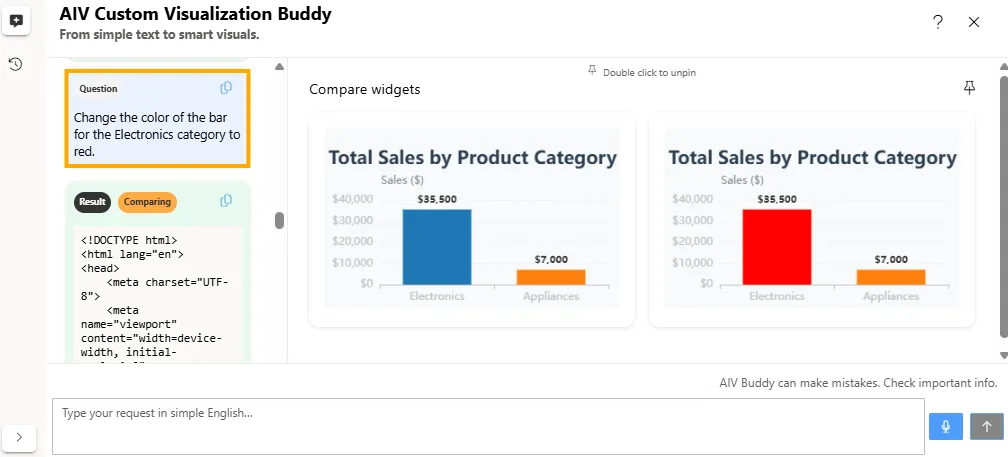
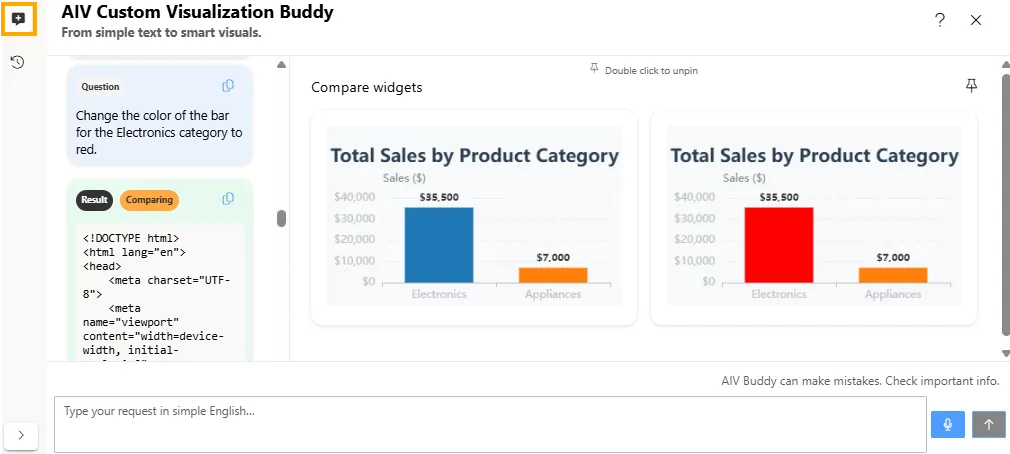
Refinement of Previous Response: Modify specific aspects of visualizations, such as changing the color of a particular bar in a chart, based on previously generated code.
Example:
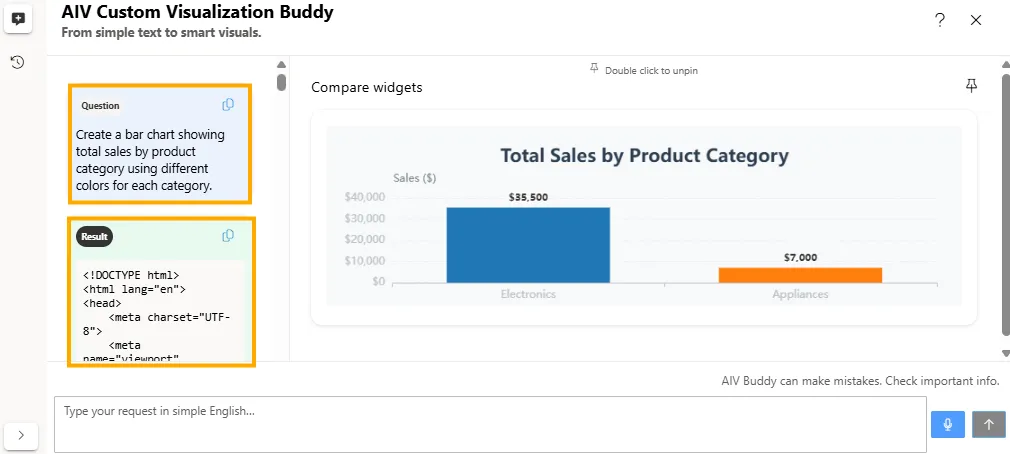
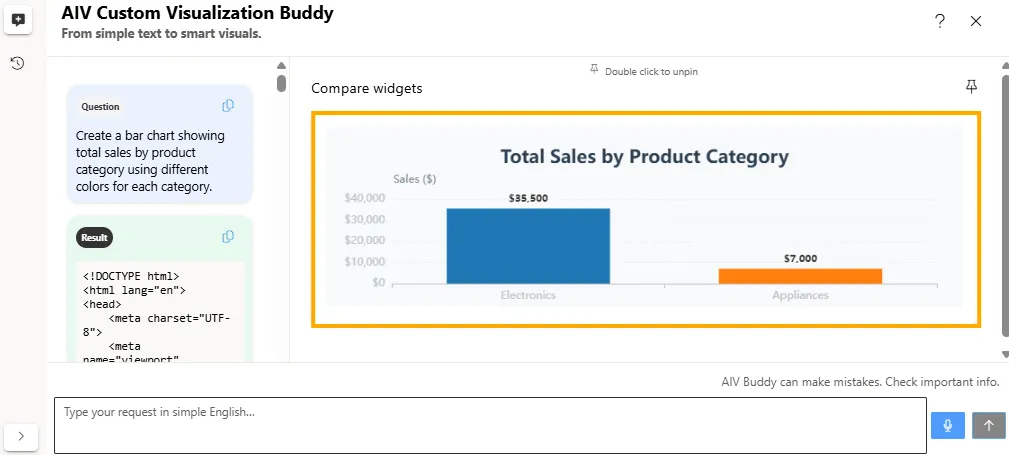
- Initial User Prompt: Create a bar chart showing total sales by product category using different colors for each category.
- Refinement User Prompt: Change the color of the bar for the ‘Electronics’ category to red.
-
Initiate New Chat: Start a new session or create a completely new visualization without reference to previous queries. This feature clears the current context and allows for a fresh prompt and response.
Example:
- Step 1: Click “Initiate New Chat.”
- Step 2: Input a new prompt, and AIV Custom Visualization Buddy will treat it as a new request.
-
Speech to Text: Users can convert spoken language into queries. Simply speak the desired query, and AIV Custom Visualization Buddy will transcribe the speech into text and generate the corresponding visualization code. This feature provides a hands-free way to create visualizations and enhances accessibility.
-
Image-Based Visualization: Generate visualizations by uploading a chart image and using it as a visual reference. The system analyzes the uploaded image and recreates a similar chart using the selected dataset.
-
Multi-Language Prompt Support: Enter prompts in supported languages other than English. AIV Custom Visualization Buddy automatically translates the query and generates the visualization based on the translated intent.
Steps to Add the AI Custom Visualization Buddy
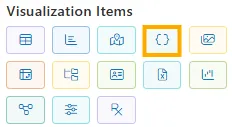
-
From the left vertical menu, select the Custom Visualization with AI icon.
-
A widget will be automatically added to the edit screen.
-
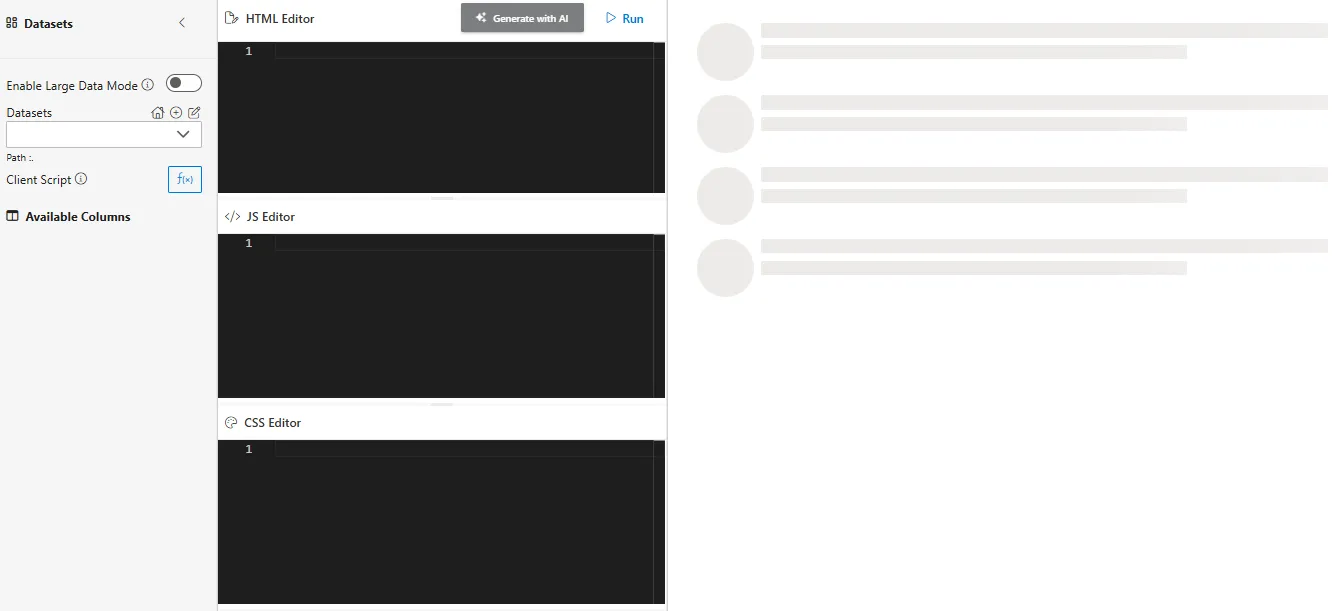
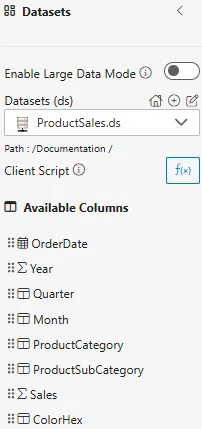
Select Dataset
-
From the Datasets dropdown, (e.g.,
ProductSales.ds), choose your dataset. -
The available columns will be displayed in the Available Columns panel.
-
-
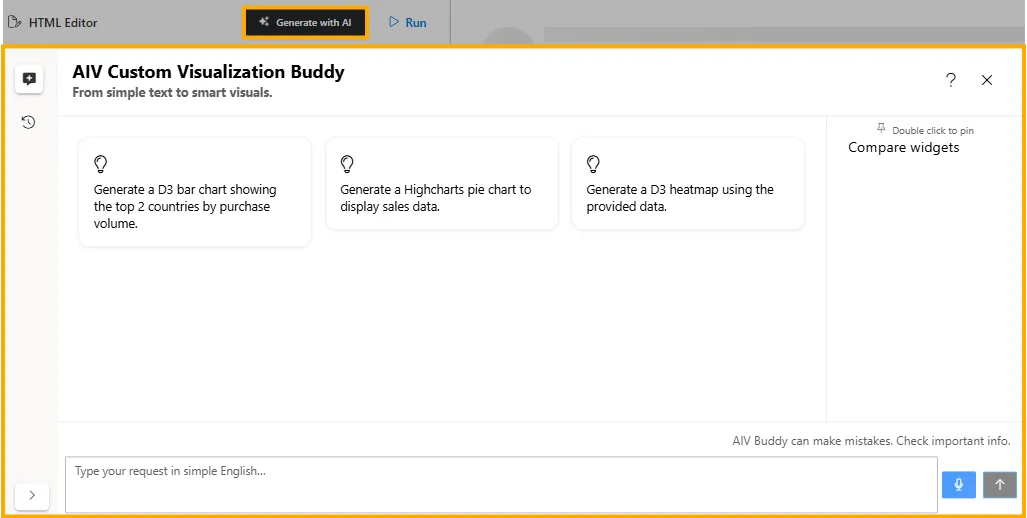
Click on the Generate with AI button. The AIV Custom Visualization Buddy dialog box will appear.
-
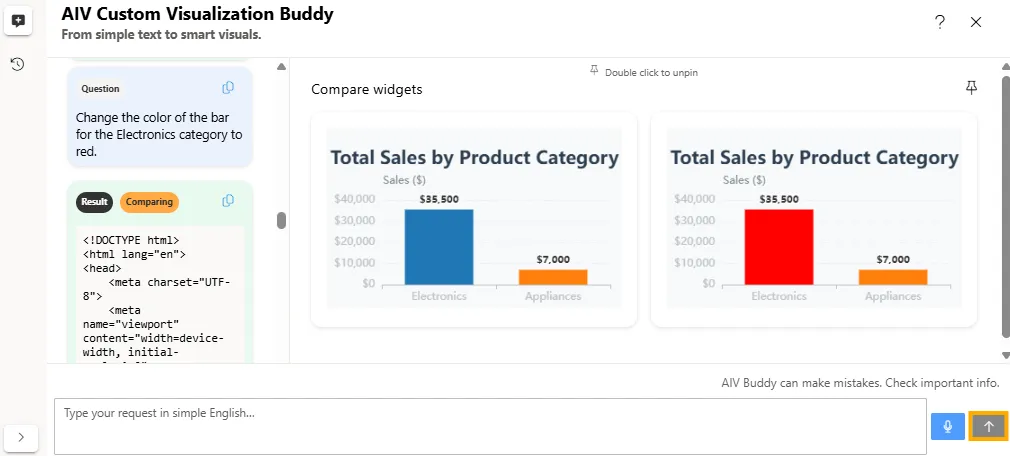
Enter your prompt in the text box. Then click the
 button to apply the prompt to the Custom Visualization widget.
Example:
-
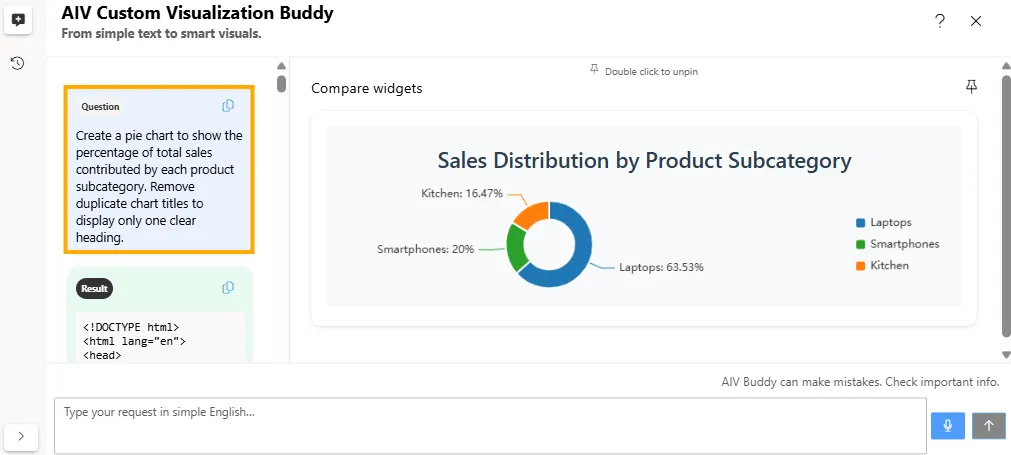
Dataset: ProductSales.ds
-
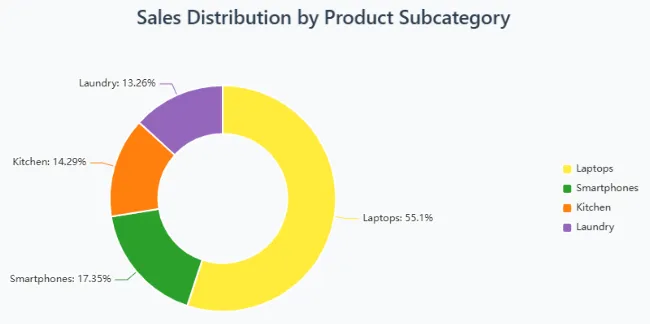
Prompt: Create a pie chart to show the percentage of total sales contributed by each product subcategory. Remove duplicate chart titles to display only one clear heading.
-
-
Refine the Chart:
You can further refine the chart by adding more prompts. For example:
-
Initial User Prompt: Create a pie chart to show the percentage of total sales contributed by each product subcategory. Remove duplicate chart titles to display only one clear heading.
-
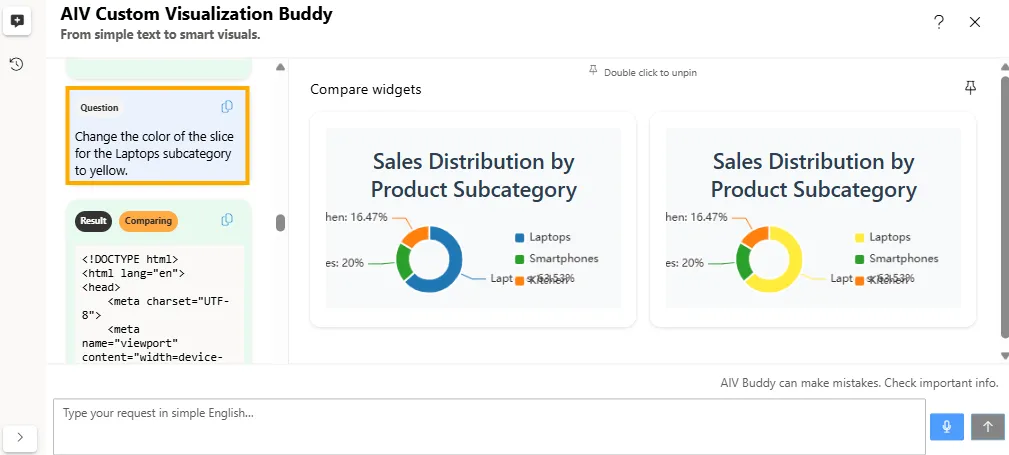
Refinement User Prompt 1: Change the color of the slice for the ‘Laptops’ subcategory to yellow.
-
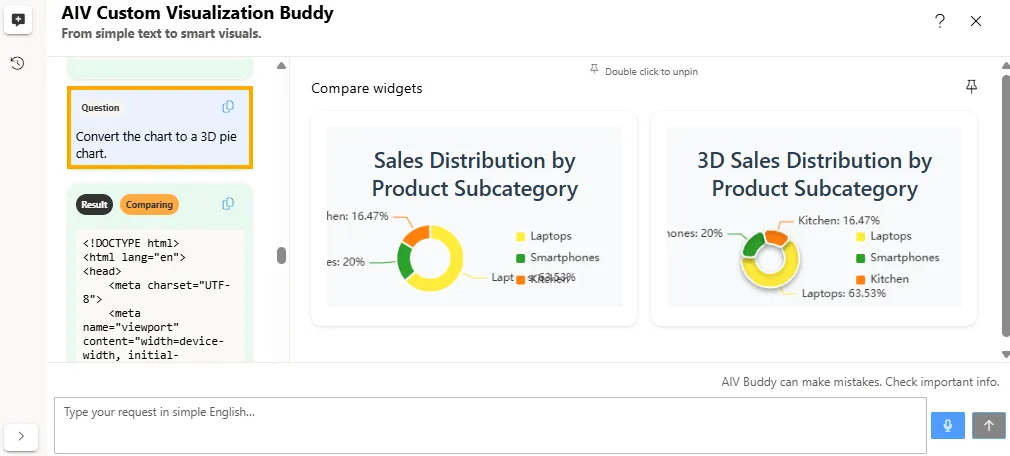
Refinement User Prompt 2: Convert the chart to a 3D pie chart.
-
-
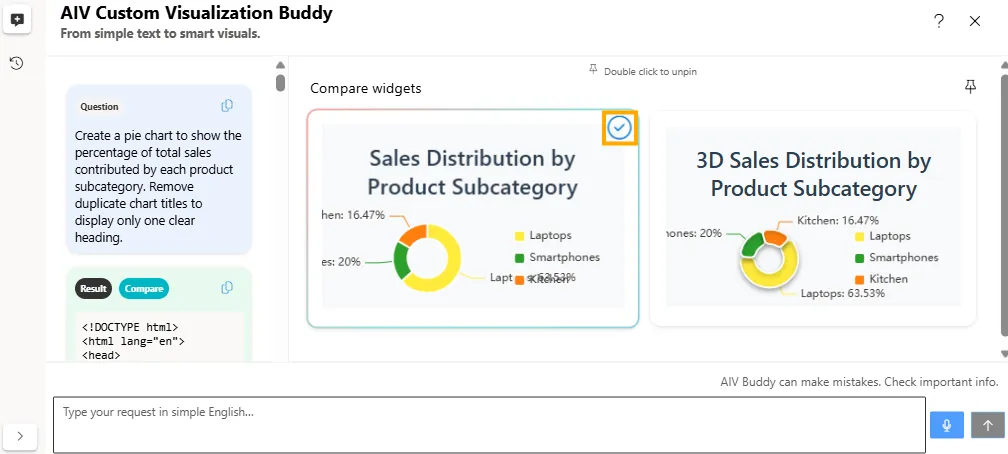
Compare Prompts:
-
When you have three or more prompts, you can compare two prompts at a time.
-
The prompt currently being compared is labeled Comparing.
-
The prompt not selected for comparison is labeled Compare.
-
To view the comparison, click on the Compare prompt, and the chart will update to show the side-by-side visualization.
-
-
Finally, click on the one you want to add to the dashboard.
-
The widget will be added to the dashboard.
-
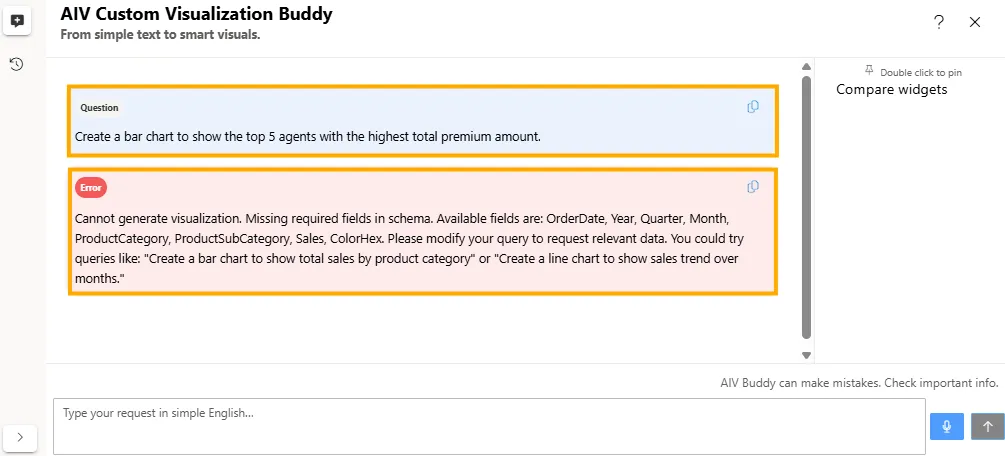
If the entered prompt contains fields not available in the selected dataset, an error message will be displayed. The system will also suggest relevant field names and example prompts that align with your dataset.
Example:
-
Dataset: ProductSales.ds
-
Prompt: Create a bar chart to show the top 5 agents with the highest total premium amount.
-
Error: Cannot generate visualization. Missing required fields in schema. Available fields are: OrderDate, Year, Quarter, Month, ProductCategory, ProductSubCategory, Sales, ColorHex. Please modify your query to request relevant data. You could try queries like: “Create a bar chart to show total sales by product category” or “Create a line chart to show sales trend over months.”
-
-
You can also generate a visualization by uploading a chart image and using it as a reference. Enter your prompt in the text box and upload a chart image using the
 . Then click the to apply the prompt to the Custom Visualization widget.
Example:
-
Dataset: ProductSales.ds
-
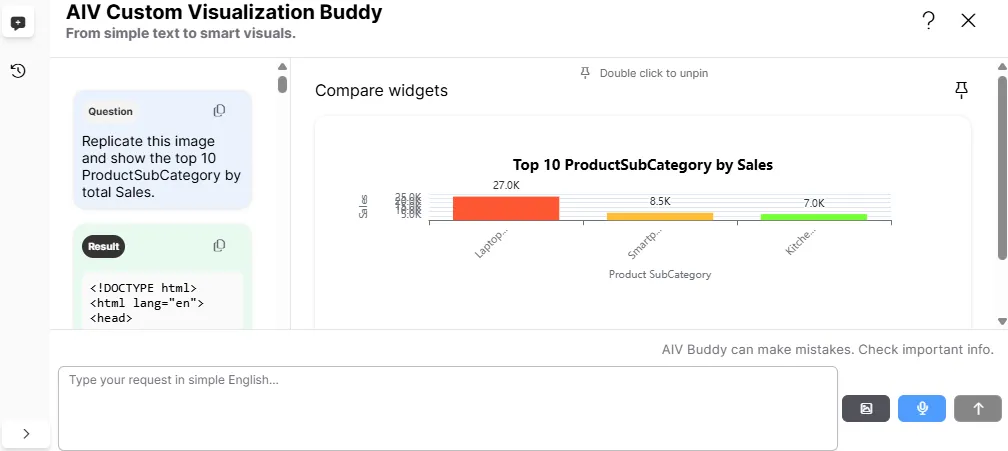
Prompt: Replicate this image and show the top 10 ProductSubCategory by total Sales.
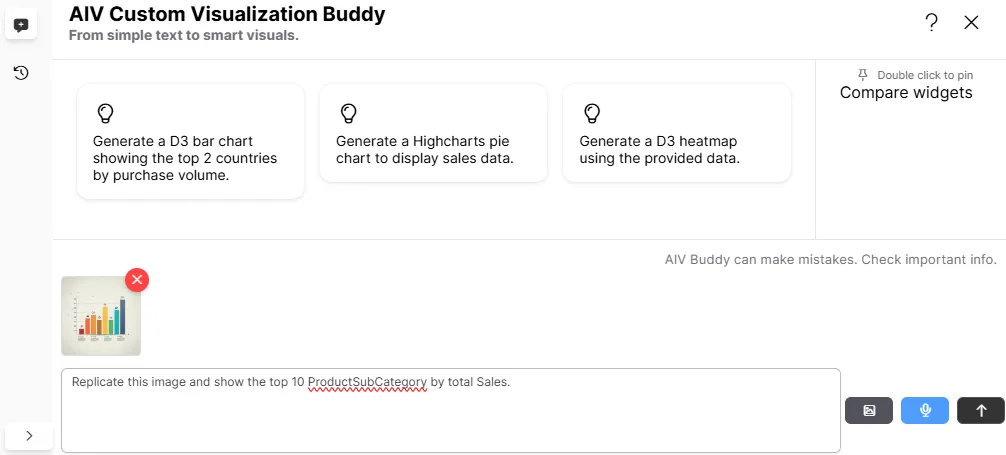
The system will analyze the uploaded image and generate a chart with a similar visual structure using the selected dataset.
-
-
You can also generate a visualization by entering your prompt in a supported language other than English. Enter your query in your preferred language (for example, French) in the prompt text box. The system will automatically translate the query and generate the visualization based on the translated intent.
Example:
- **Dataset:** ProductSales.ds
- **Prompt (French) :** Créer un graphique circulaire montrant le pourcentage des ventes totales par sous-catégorie de produit.

- **Result:** The chart is generated according to the translated prompt using the selected dataset.AIV Custom Visualization Buddy is an AI-powered tool that enables users to create, customize, and refine dashboard visualizations using natural language prompts. It automatically generates HTML, JavaScript, and CSS for charts, tables, and maps, allows modifications to existing visualizations, supports prompt comparisons, tracks query history, and offers speech-to-text functionality for hands-free operation. This tool simplifies dashboard creation, making it easy to generate and enhance visualizations without coding expertise.