Calling Detail dashboard from Table custom column with filter
By using this document user will learn how to redirect to the detailed dashboard using the table custom column filter.
Objective
Calling to a dashboard, using created table custom column filter
Use Case
This script helps to call the detailed dashboard from the table widget custom column. By clicking on the custom column, the detailed dashboard will be displayed with the value of the column clicked and filter values of the summary Dashboard.
Prerequisite
Here we are taking a sample sales dataset and using the table widget to create a custom column. This will be called a summary dashboard. In the second dashboard which is a detailed dashboard, we will create a pie chart and table to show filtered data.
Download dashboard.zip file from link given dashboard.zip.
After downloading the zip file, open dashboard_usecase folder inside it & upload sales.ds into Master data —> Dataset Section of the AIV. To add it into AIV follow this Link.
-
Create a new dashboard by clicking on the (+) icon and giving the name Summary of the dashboard.
-
The Edit menu box appears as you click on the Table Widget icon. And a widget gets added in content place automatically in the dashboard.
-
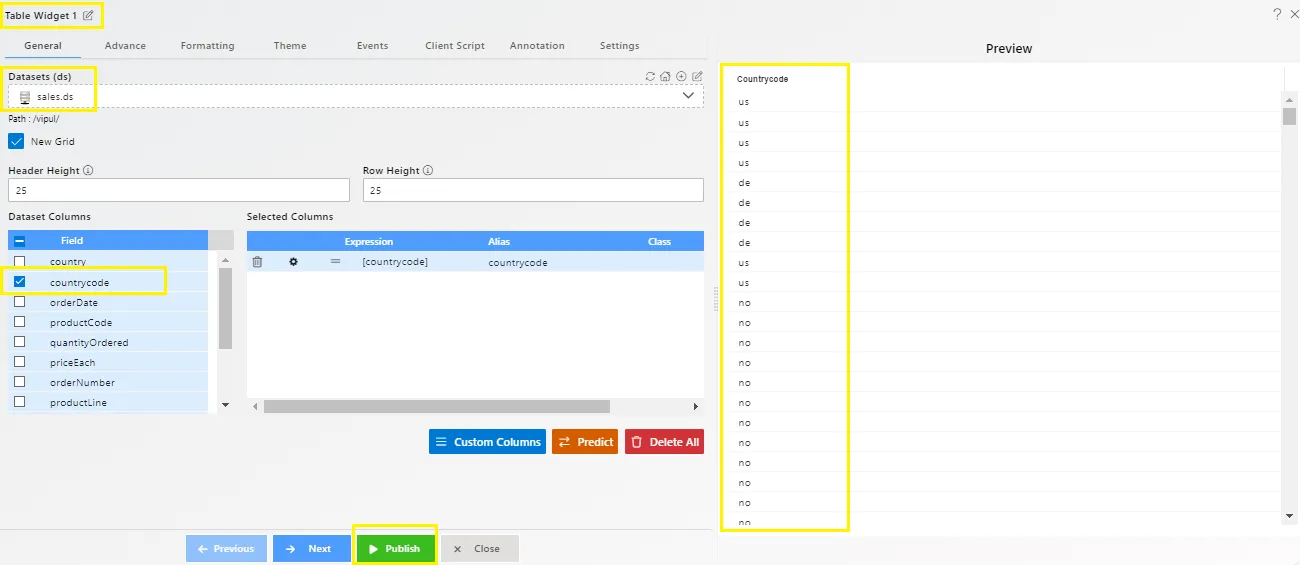
Enter the Following details in General Property.
- Dataset: sales.ds
- Select country code column from the list of columns.
- Fill above details as shown in the figure below.
-
Click on Preview and save and exit.
-
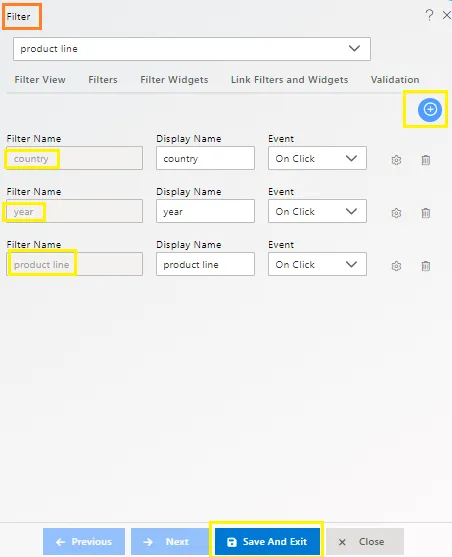
Now go to the Filter
 Icon (from the top right corner of the dashboard).
 -
Create three filters and give the named country, year & product line as shown in the figure below:
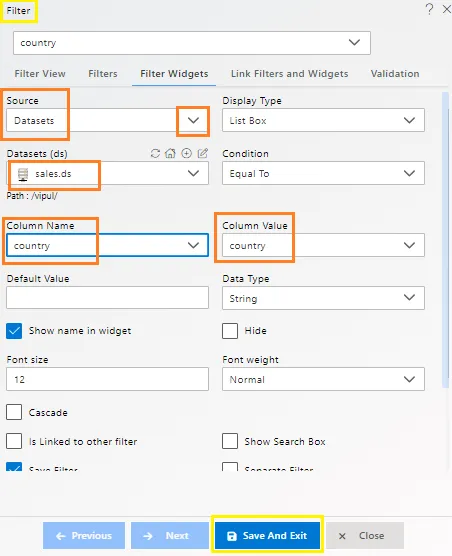
- Click on the setting icon of the country filter and fill the details in filter Widget:
- Source: Dataset
- Dataset: Sales. ds
- Column Name: country
- Select Set Default when clear
- Fill above details, As shown in the figure below:
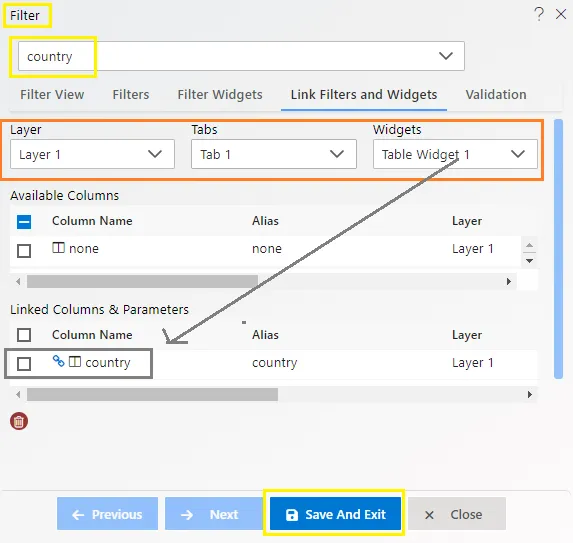
- Click on Link Filter and Widgets Option and enter the details as below:
- Layer: Layer1
- Tabs: Tab 1
- Widget: Table Widget 1
- **Select the country in Available Columns
- Fill above details, As shown in the figure below:
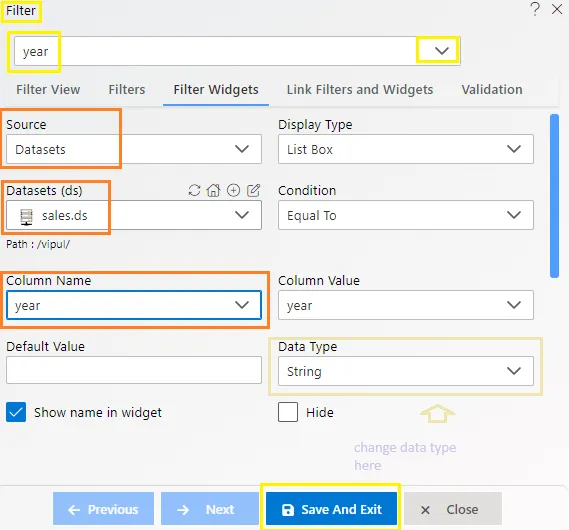
- Click on the setting icon of the year filter and fill the details in filter Widget:
- Source: Dataset
- Dataset: Sales. ds
- Column Name: year
- Select Set Default when clear
- Fill above details, As shown in the figure below:
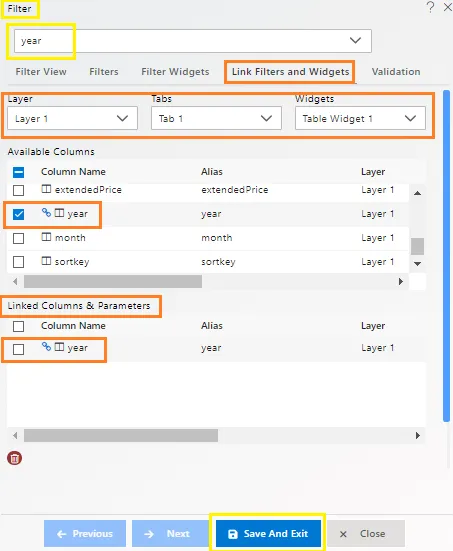
- Click on Link Filter and Widgets Option and enter the details as below:
- Layer: Layer1
- Tabs: Tab 1
- Widget: Table Widget 1
- Select the Year in Available Columns
- Fill above details, As shown in the figure below:
-
Now click on the setting icon of the product line filter.
-
Enter the following details in the Filter widget.
- Source: Dataset
- Dataset: sales.ds
- Column Name: product line
-
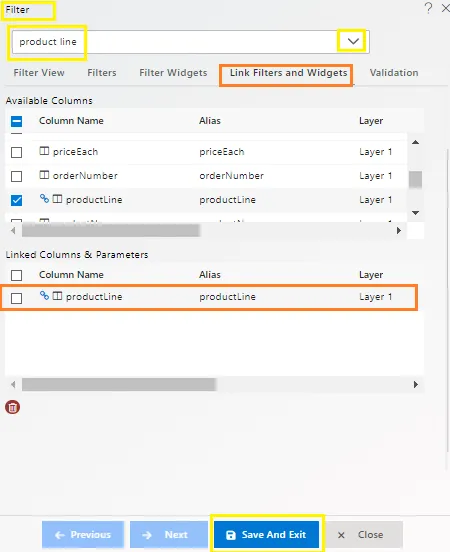
Click on the Link filter and widget option.
-
Enter the following details in the Filter widget.
- Layer: Layer1
- Tab: Tab1
- Widget: Table widget
- Select the Productline in Available Columns
-
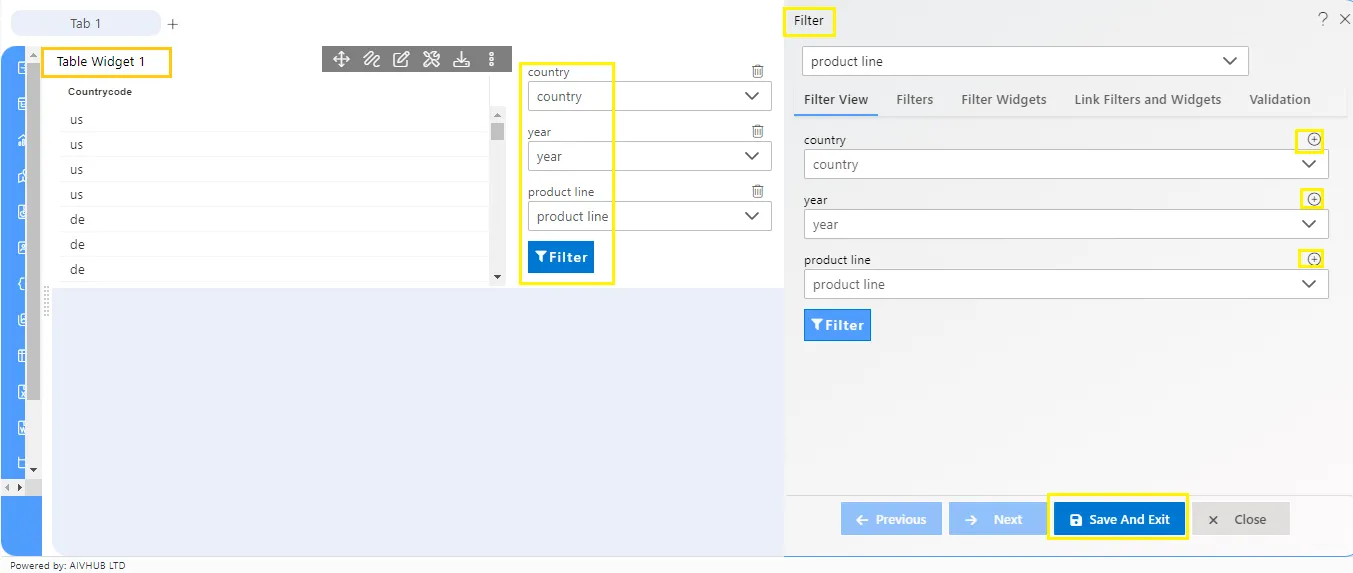
Click on Filter view property and click on the + icon of the country, year & productline to view the filter in the dashboard.
-
Click on Save and Exit button.
-
Adjust the above widgets, as shown in the figure below:
-
Create a New Dashboard and give the name Detailed dashboard.
-
The Edit menu box appears as you click on the Pie chart of the chart widget icon. And a widget gets added in the content place of the dashboard.
-
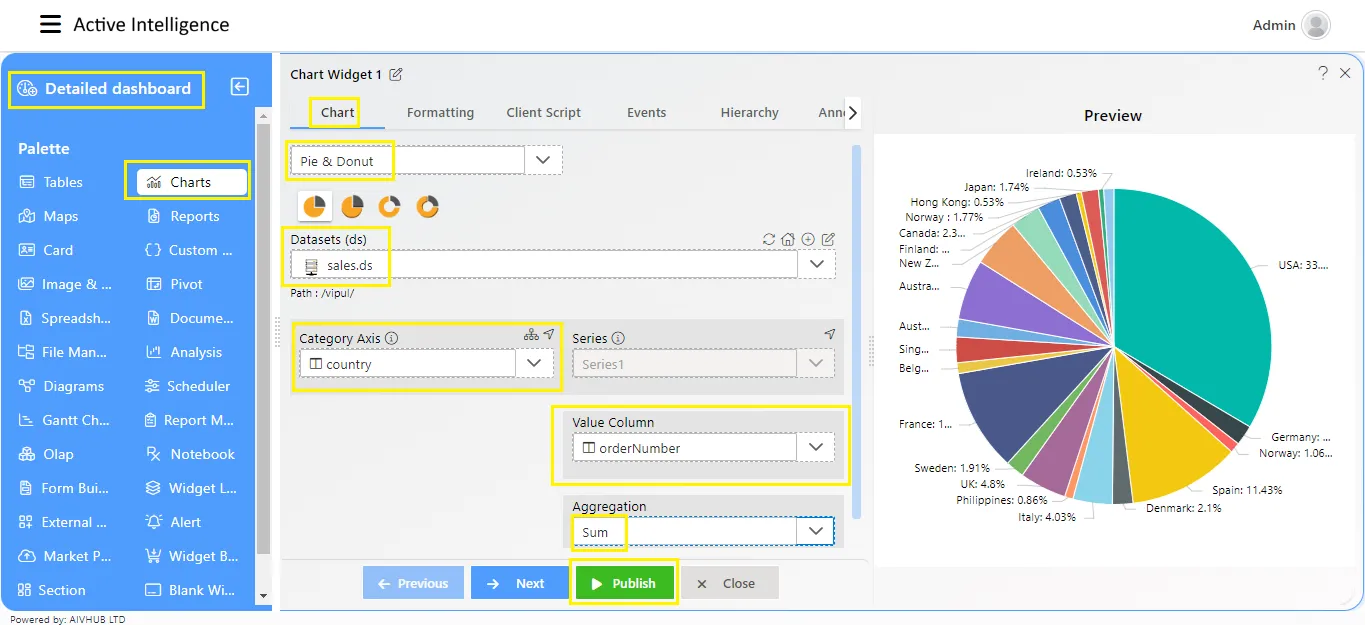
Enter the Following details in Chart Property.
- Dataset: sales.ds
- Category Axis: country
- Value Column: Order Number
- Aggregation: Sum
- Fill above details as shown in the figure below:
-
Click on Preview and Save and Exit.
-
Add one table widget in the Detail dashboard.
-
The Edit menu box appears as you click on the Table Widget icon. And a widget gets added in the content place the dashboard.
-
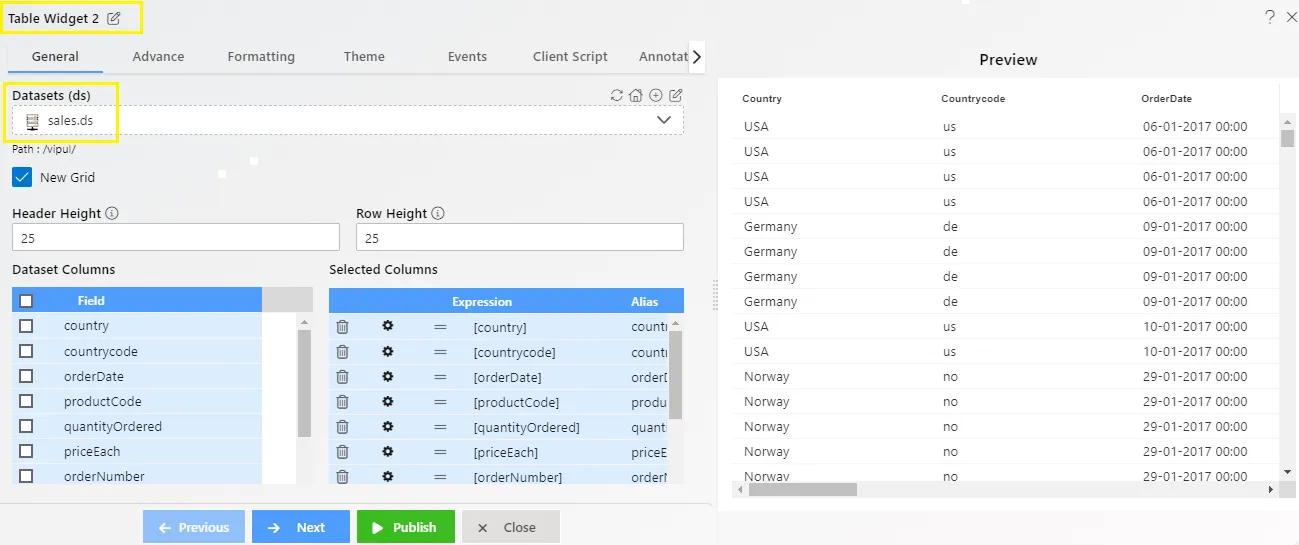
Enter the Following details in General Property.
- Dataset: sales.ds
- Select all the fields in Dataset Columns.
- Fill above details as shown in the figure below:
-
Click on Preview and Save and Exit.
-
Add Three filter country, productline, year in the dashboard, As shown in the figure below:
-
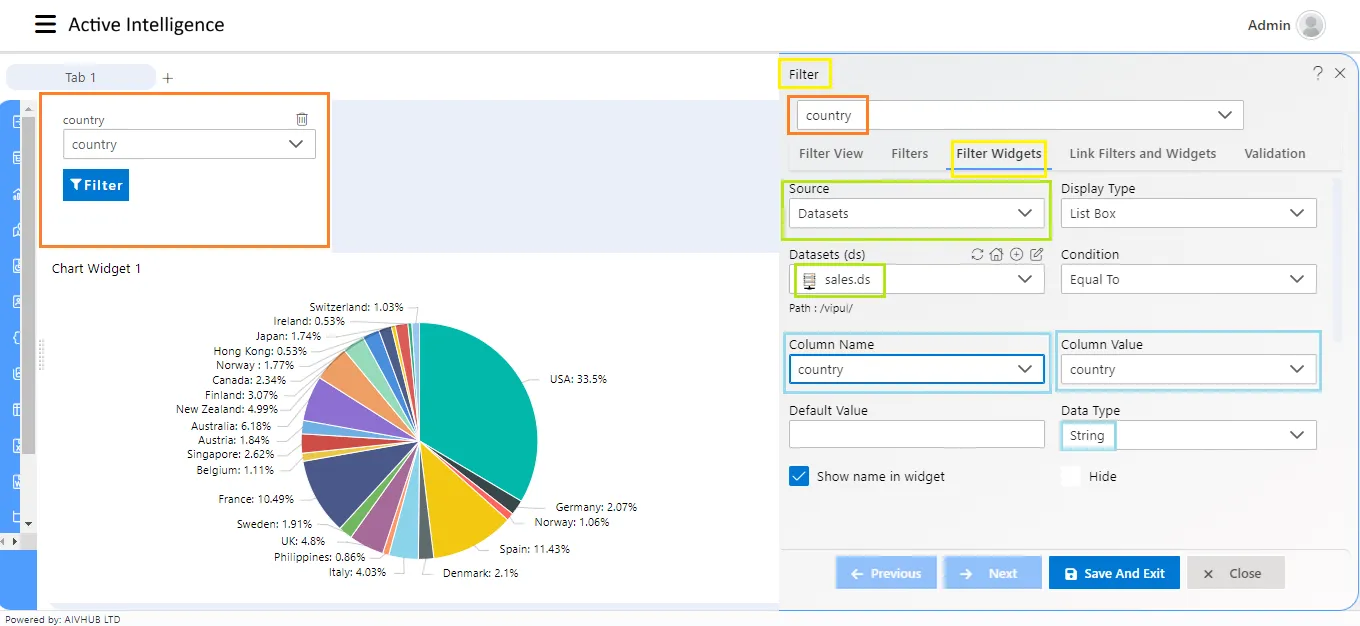
Click on the setting icon of the country filter.
-
Enter the following details in Filter Widgets.
- Source: Dataset
- Dataset: sales.ds
- Column Name: country
- Fill above details, As shown in the figure below:
-
Click on the Link filter and widget option.
-
Enter the following details in the Filter widget.
- Layer: Layer1
- Tab: Tab1
- Widget: Chart Widget, Table widget
- Link country column in both widgets
-
Click on the setting icon of the productline filter.
-
Enter the following details in the Filter widget.
- Source: Dataset
- Dataset: sales
- Column Name: productline
-
Click on the Link filter and widget option.
-
Enter the following details in the Filter widget.
- Layer: Layer1
- Tab: Tab1
- Widget: Chart Widget, Table widget
- Link productline column in both widgets
-
Click on the setting icon of the year filter.
-
Enter the following details in the Filter widget.
- Source: Dataset
- Dataset: sales
- Column Name: year
-
Click on the Link filter and widget option.
-
Enter the following details in the Filter widget.
- Layer: Layer1
- Tab: Tab1
- Widget: Chart Widget, Table widget
-
Link year column in both widgets & Both widgets link with year column.
-
Click on Filter view property and click on the + icon of the country, productline, and year.
-
Click on Save and Exit.
-
Adjust widgets as shown in the figure below:
-
Click on the embed icon
 (From the Top-Right Corner of the Dashboard) of the detailed dashboard then Click on Generate button to Generate code and copy the external embed link.
 -
And now Embed URL of detail dashboard will be as below:
http://80.241.217.90:8081/aiv/embed/external/73425774364d68626d34315334376a4d6b4b74694d6d4b584154305949337a584c253246346850435462663159253344/a_u__Admin&a_p__&a_t__eyJhbGciOiJIUzI1NiJ9.eyJzdWIiOiJBZG1pbjo6RGVmYXVsdCIsImlhdCI6MTcyMzQ1MTgxNX0.1Pbs72QXes0oVjjm1nh0U0nVawOkRkJtaLzRz9xzgGo&a_d__Default&a_ex__&a_af__false/country___&productline___&year___- Now just add filter name in the product line and year filter in
<<>>and pass column name country in{{}}the link will be as below,
https://training.aivhub.com:8443/aiv/embed/external/4b5a78366d25324271626b53336950377445634e46796f4475342532426438466453556b3850796e724d6545664545253344/a_u__Reema1&a_p__&a_t__&a_d__Default&a_ex__&a_af__true/productline___<<ProductLine>>&year___<<year>>&country___{{country}}http://80.241.217.90:8081/aiv/embed/external/73425774364d68626d34315334376a4d6b4b74694d6d4b584154305949337a584c253246346850435462663159253344/a_u__Admin&a_p__&a_t__eyJhbGciOiJIUzI1NiJ9.eyJzdWIiOiJBZG1pbjo6RGVmYXVsdCIsImlhdCI6MTcyMzQ1MTgxNX0.1Pbs72QXes0oVjjm1nh0U0nVawOkRkJtaLzRz9xzgGo&a_d__Default&a_ex__&a_af__true/country___&productline___<<ProductLine>>&year___<<year>>&country___{{country}}-
Paste this link after detail: script so whole custom column script will change
&a_af__falseto&a_af__true -
Now, go to the summary Dashboard.
-
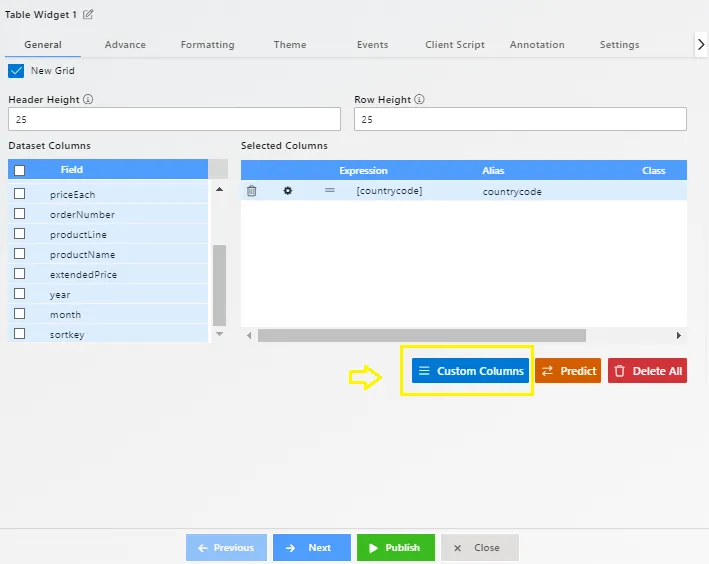
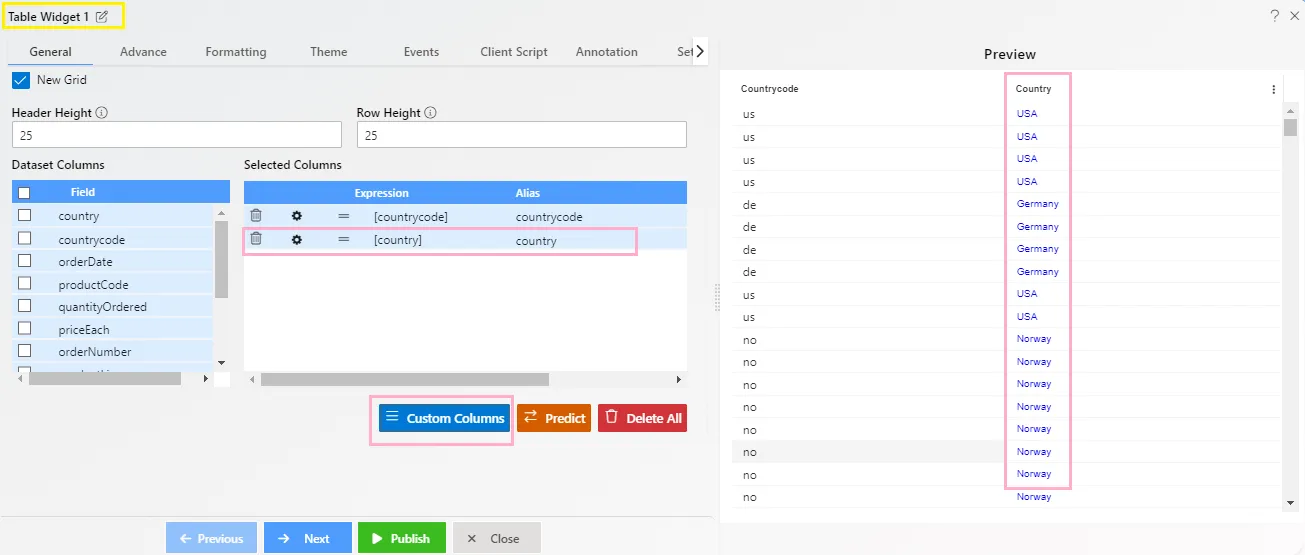
To add a custom column, go to the edit table widget and click on the custom column option from the bottom icon, as shown in the figure below:
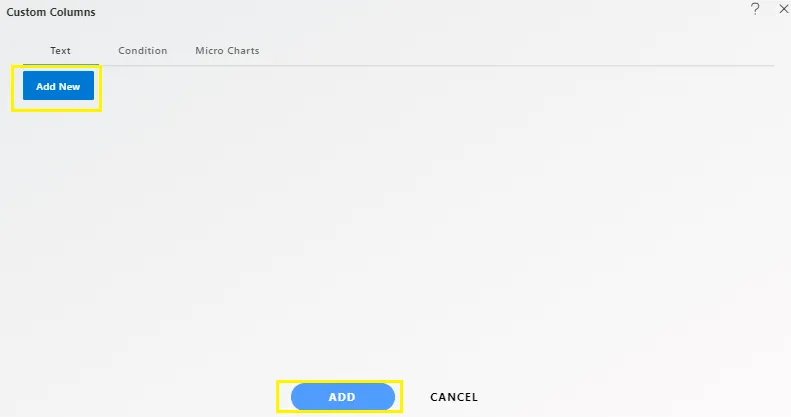
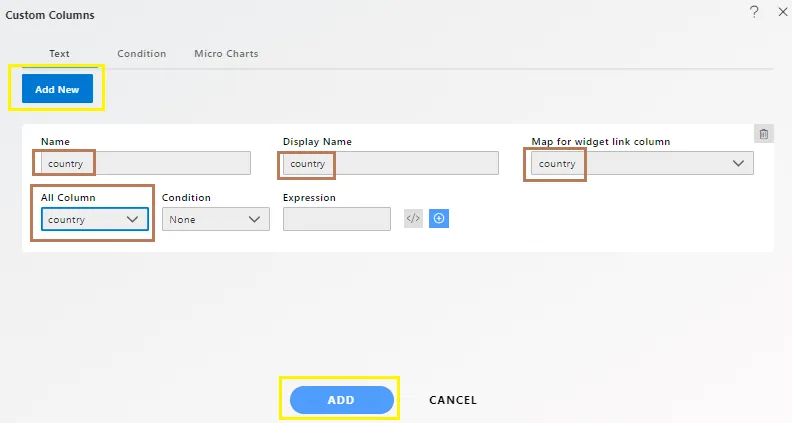
- From the custom column window, click on Add New Button to add a new custom column.
- Enter the following Details in Custom Column.
- Name: country
- All column: country
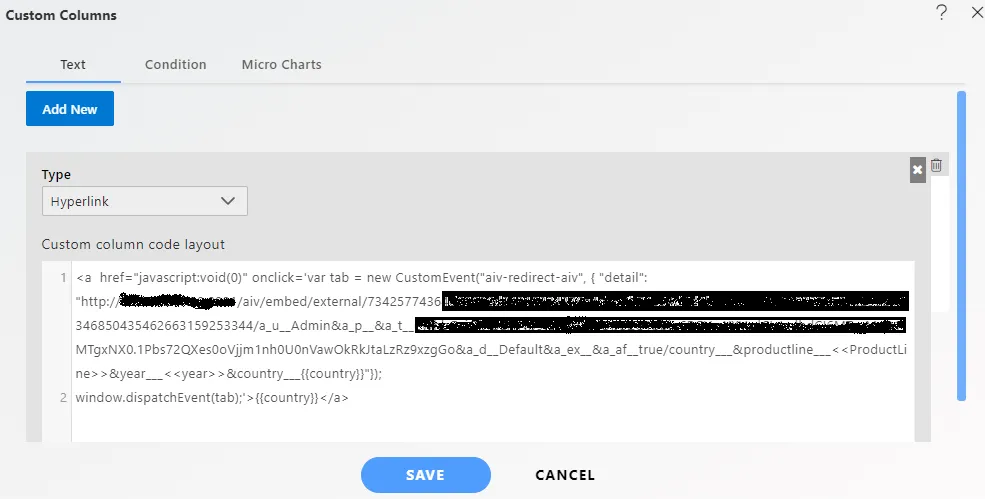
- Click on the expression icon to provide a hyperlink to the Detail dashboard, as shown in the figure below:
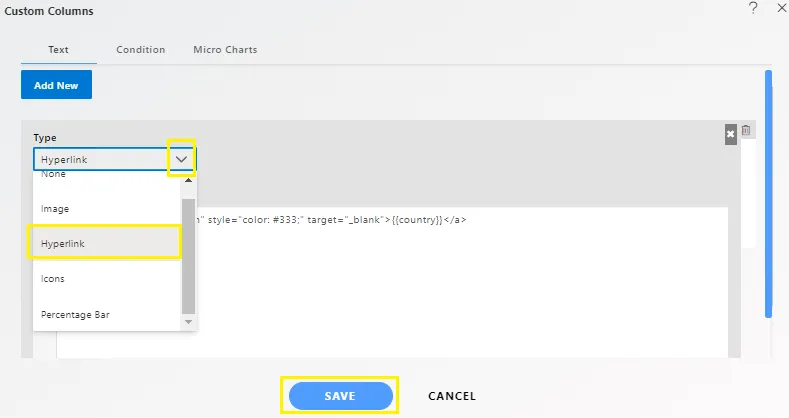
- Enter the following details in it.
- Type: Select Hyperlink from Dropdown list
- In Custom column code Layout write code below:
<a  href="javascript:void(0)" onclick='var tab = new CustomEvent("aiv-redirect-aiv", { "detail": "https://training.aivhub.com:8443/aiv/embed/external/4b5a78366d25324271626b53336950377445634e46796f4475342532426438466453556b3850796e724d6545664545253344/a_u__Reema1&a_p__&a_t__&a_d__Default&a_ex__&a_af__true/productline___<<productline>>&year___<<year>>&country___{{country}}"});
window.dispatchEvent(tab);'>{{country}}</a>
Code Explanation:
- inside the ancle tab, we have used event type onclick, function written inside onclick will be triggered when the user clicks on this custom column.
new CustomEvent("aiv-redirect-aiv", { "detail": "https://aivhub.com/{{month}}/<<FilterName>>" });-
Above code is used to trigger events having a Detail dashboard embed link.
-
In the above link after “Detail”: the Detail Dashboard embed link should be pasted. In this link, if you want to pass column value clicked then use
{{}}and write down the name of column value you want to pass on click. -
Moreover, if there are filters in the summary dashboard and the user wants to pass filter values along with column value then
<<>>is used and inside this filter, the name should be written. [Filter name is Case sensitive]. -
Fill above details, as shown in the figure below:
-
Click on the save button to save the script and click on add button to add a column in the table widget.
-
New custom column will be added to the table widget as below,
-
Click on Publish and Save and Exit button.
-
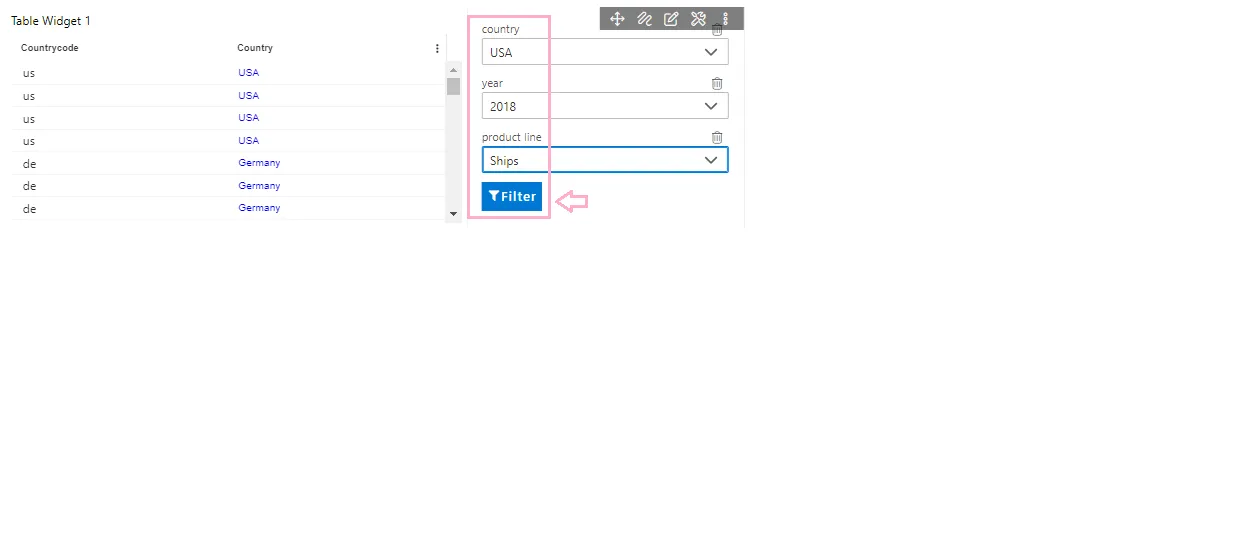
Go to preview mode and apply filters.
-
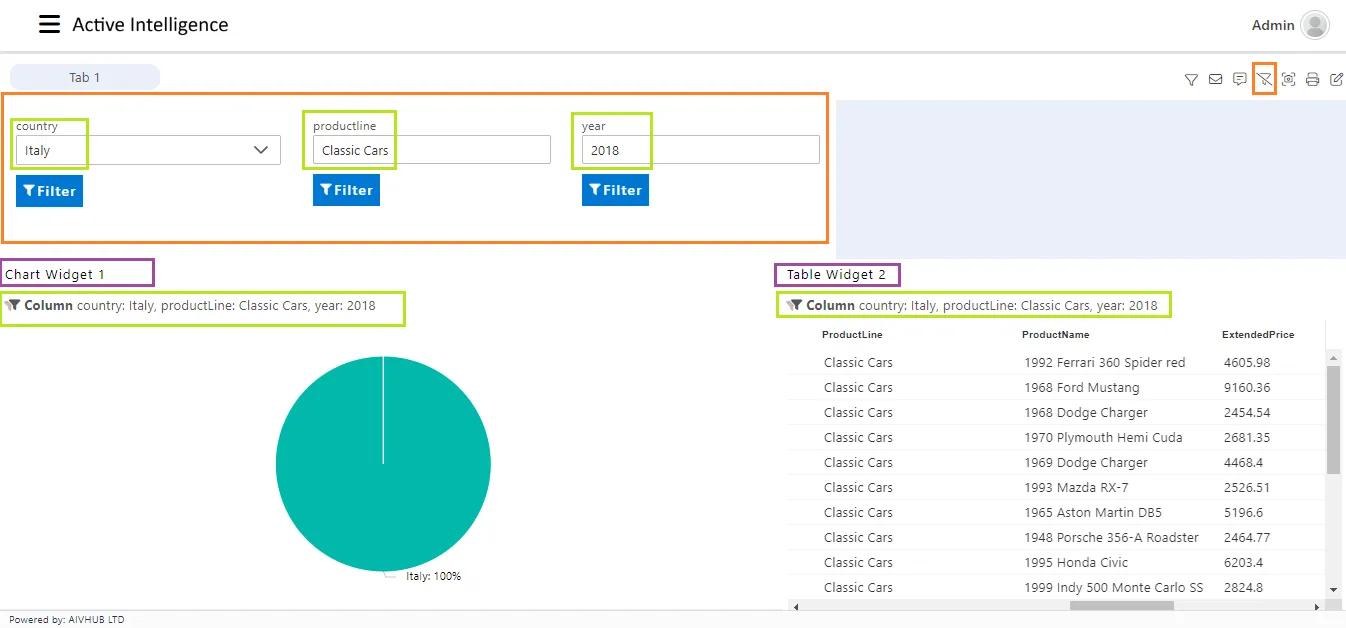
In-country filter select the USA, the Year 2018, productline select Ships and click on the filter button, so it will filter these values as shown in the figure below:
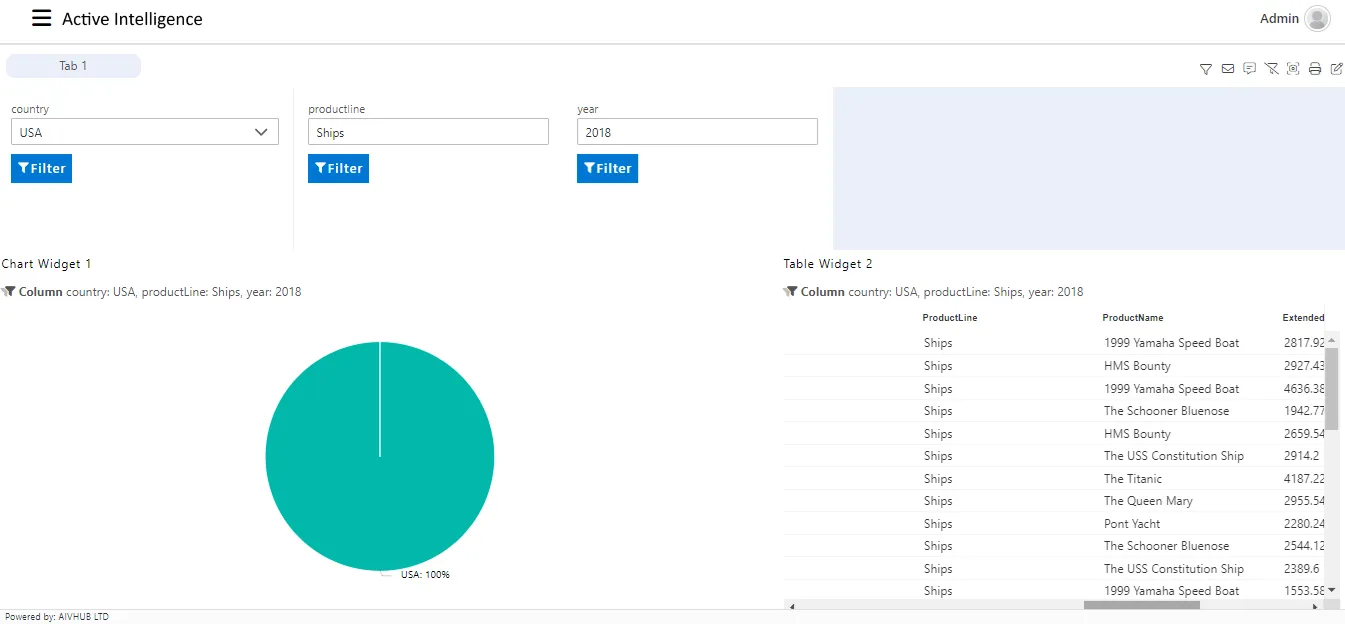
- Click on Country name the USA and it will redirect you to Detail dashboard whose link we have applied in the hyperlink in the custom column, as shown in the figure below:
Common features:
Audit
Clone
Copy
Paste
Move
Upload
Delete
Share
Version
Embed
Download
Property
Save as quicklink