Analysis Widget
Overview
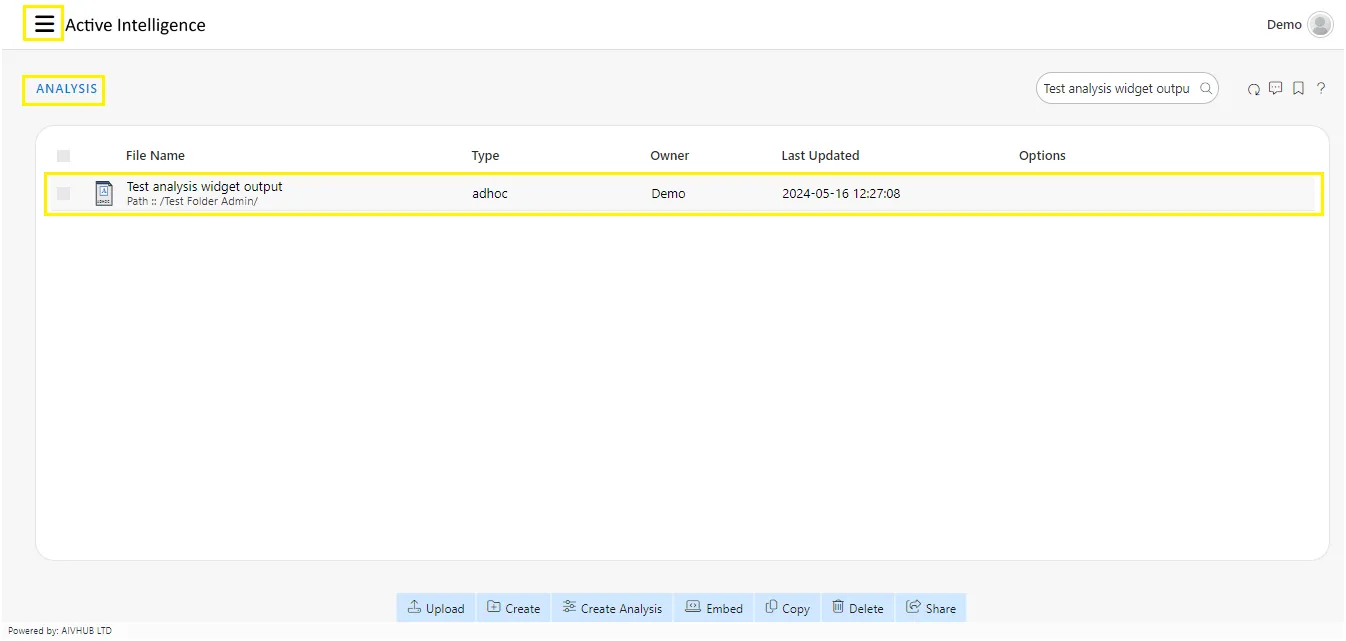
The analysis widget simplifies access to Adhoc analysis reports on the dashboard. Just add the widget, select your report, and it appears on the dashboard. Plus, any report created using the widget is automatically saved in the ad hoc analysis section for future reference.
Analysis widget properties
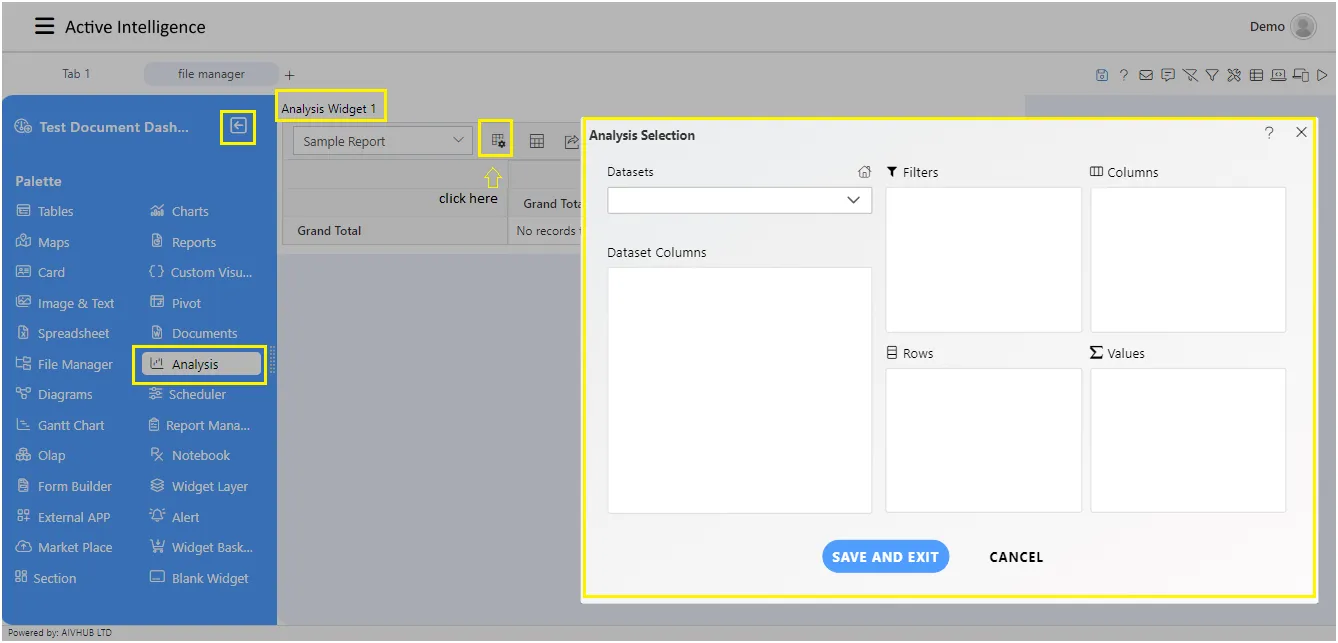
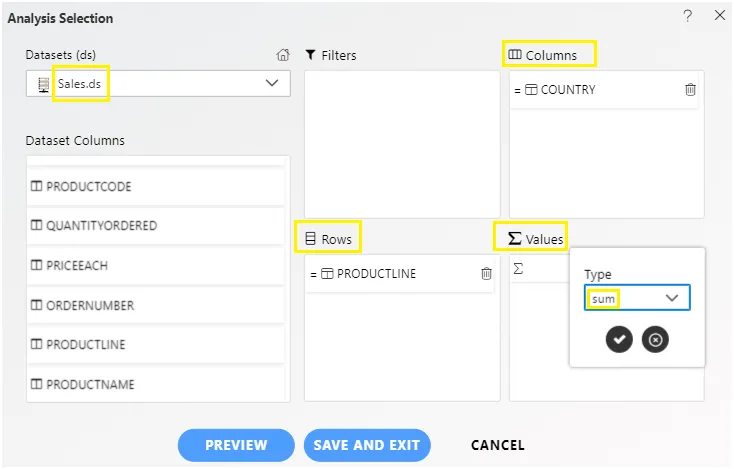
Select Dataset: Users can choose the dataset from the dropdown menu.
After selecting the dataset, the data columns become available in the dataset grid below the dropdown. Users can then drag and drop the columns as needed. The following areas are where users can add the data columns:
- Columns: Values visible in the column titles of the pivot. Users can add more than one column.
- Rows: Values visible in the row titles of the pivot. Users can add more than one row.
- Values: Values visible in the pivot area under the row and column titles, indicating the table content of the pivot.
- Filters: Users can filter the values and display parameterized data on the pivot. Multiple filters can be added as needed.
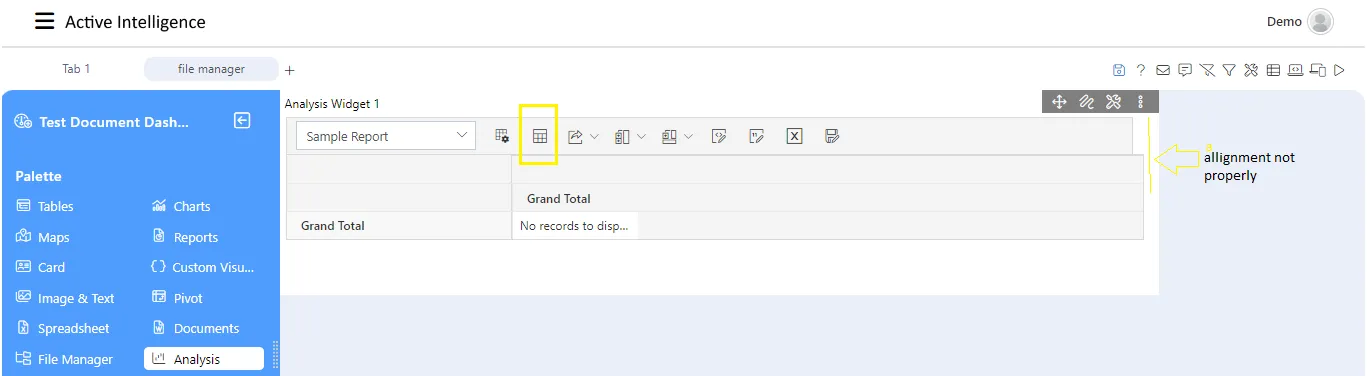
Show Table: This allows users to view and inspect the data directly in a tabular layout, facilitating quick and easy validation of the information they need.
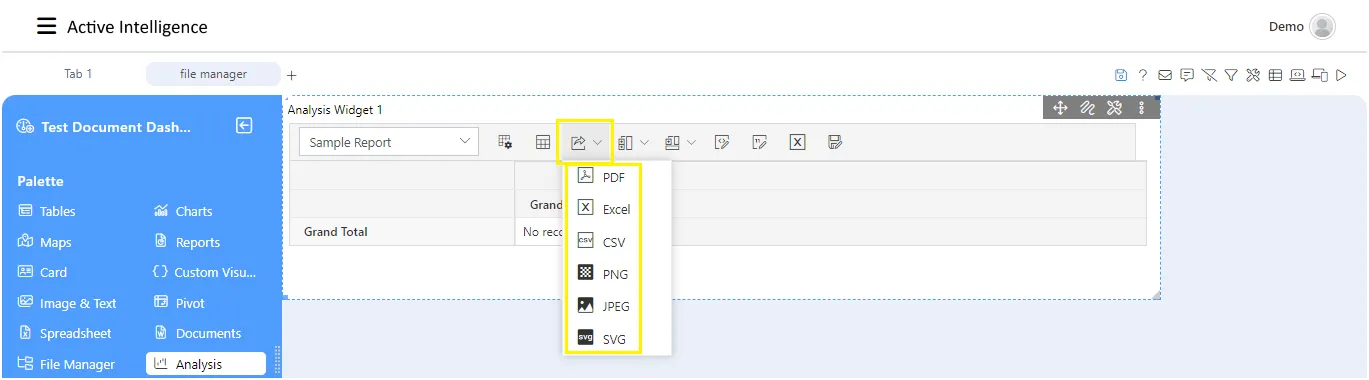
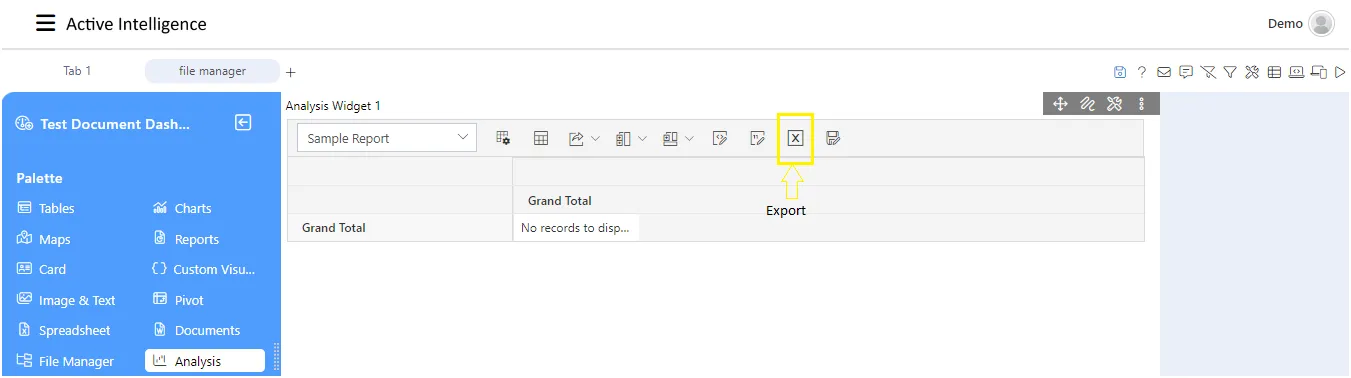
Export: Users can easily export their analysis data in different formats such as PDF, Excel, CSV, PNG, JPEG, and SVG.
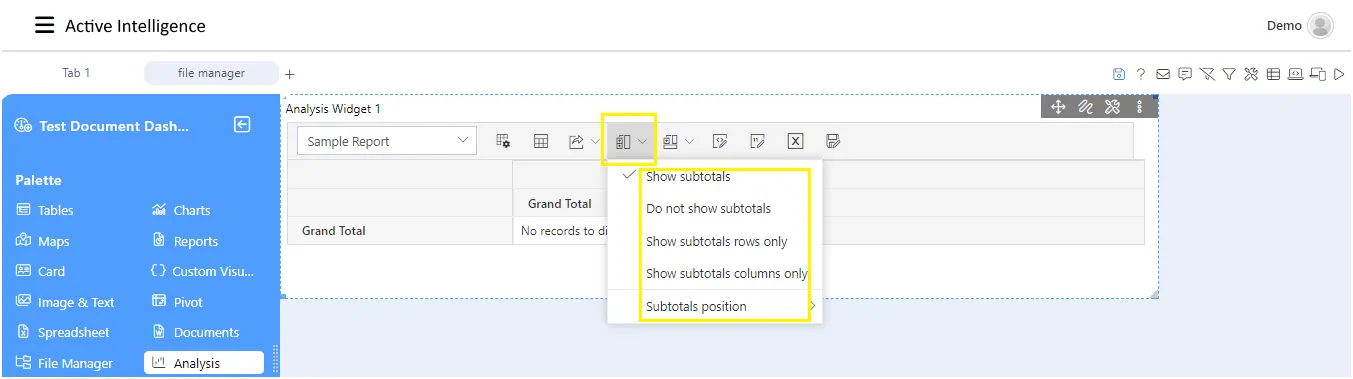
Subtotals and Grand totals: The Subtotal and Grandtotal properties enable users to enhance data visibility in their analysis reports. By selecting options such as “Show Subtotal,” “Show Grandtotal,” “Show Subtotal Rows Only,” or “Show Grandtotal Rows Only,” users can choose which totals to display. Additionally, users have the flexibility to position subtotal and grandtotal rows at the top or bottom of the report, based on their preferences. This customization empowers users to tailor their reports to showcase the most relevant data for their analysis needs.
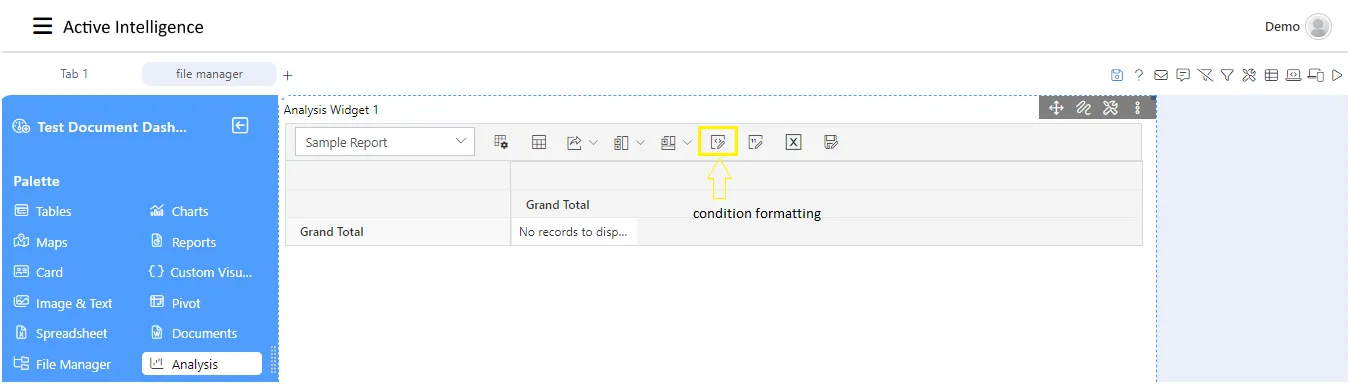
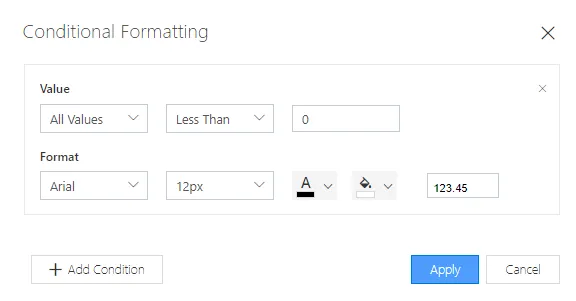
Conditional Formatting: To enhance the visibility of data in reports and make it more effective, users can utilize conditional formatting. This feature allows users to apply color formatting to numeric values based on predefined conditions such as “Less than,” “Greater than,” “Equal to,” “Not equal to,” “Between,” “Not between,” and more. By selecting the overall data and applying these conditions, users can quickly identify trends, outliers, and important insights within their data.
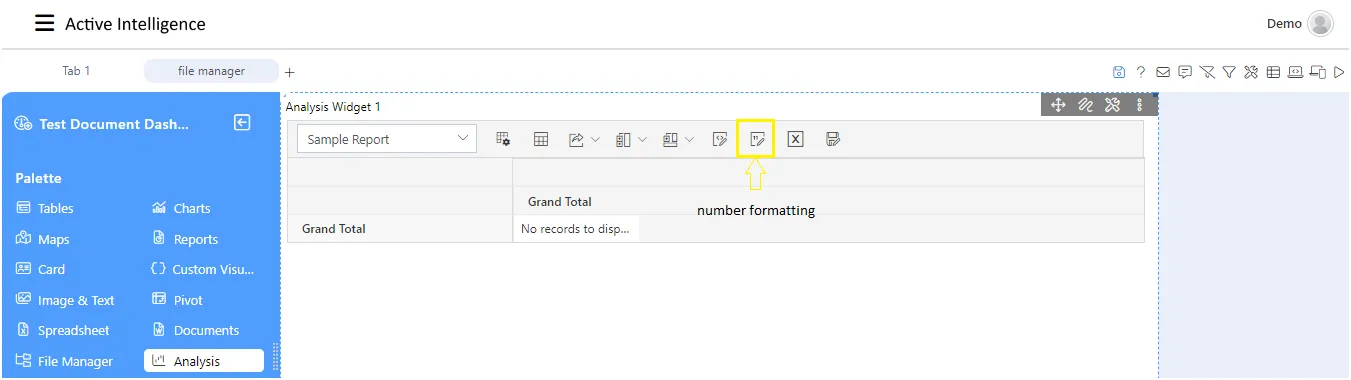
Number formatting: This formatting properties allows user to add numarical format like Number, Currency, Percentage, Custom.
Export: With this feature, users can export their report data to Excel. Excel files are easy to recognize and understand, making it simple to work with the report data outside of the tool.
Save and Save As To save your work in the application, simply click on the “Save” button. This will add the report to your saved list, ensuring that your progress is safely stored and accessible for future

Steps to Create a analysis widget
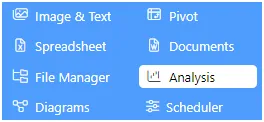
- Find the Analysis icon from the left Vertical Menubar, click on the Marketplace icon, as shown in the figure below:
- Once the widget appear in the dashboard, click on the dataset icon to fetch the dataset in analysis widget, as shown in the figure below:
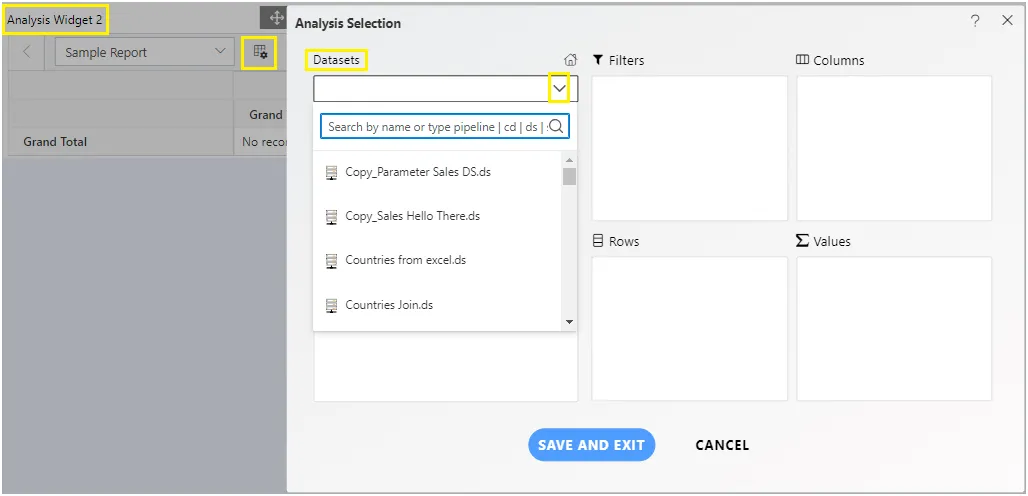
- As you click on the dataset icon, the dataset dialogbox appear in the dashboard, now select the rows,columns and Values.
- After selecting the Rows,Columns and Values in the dataset.
-
Click on publish button.
-
From Save As dialog box, add name and click on the SAVE AS button. you will able to see the saved analysis from the Adhoc Analysis section under the masterdata.
-
Click on Save as button to save the analysis.
-
The example analysis widget below: