Stacked/Area Chart
Create Stacked Line/Area Chart: This video contains how to create stacked line/area Chart in AIV.
-
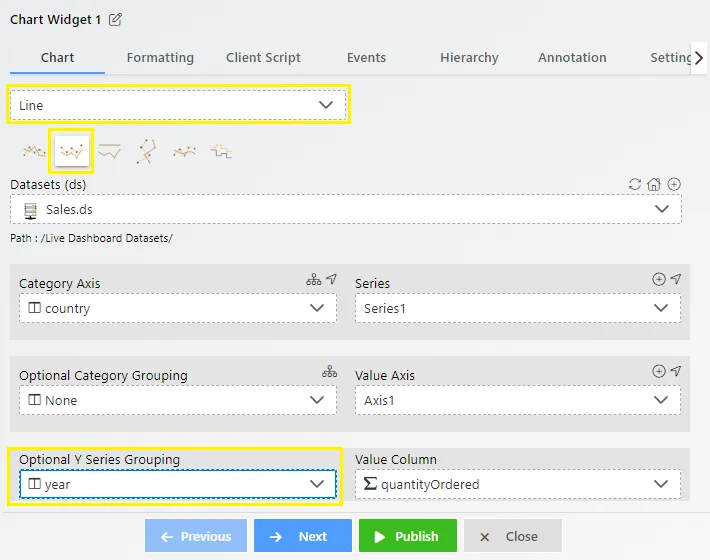
The Edit menu box appears as you click on Line chart icon. And a widget gets added in content place automatically in dashboard.
-
Enter Following detail in chart controls:
Optional Y Series Grouping: Year
-
From Chart icons select Stacked icon.
-
Fill above details in edit box, As Shown in figure.
-
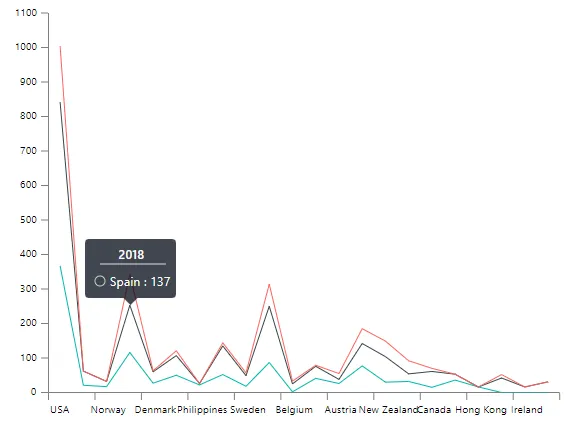
Preview and Save and Exit.
-
Now, match your Line chart Stacked with the below example, it should look like the figure below:
In order to understand in detail about other features, click on the following links:-
Create Stacked Line/Area Chart
Formatting
Event
Hierarchy
Annotation
Settings