Hierarchy Chart
Hierarchy
This function enables the user to create a dynamic view of the data, as the user will drill in each level a new information will be displayed in a different view on clicking on a data point.
This video contains how to add hierarchy for chart in AIV.
Follow the Steps to Line-Area Chart:
-
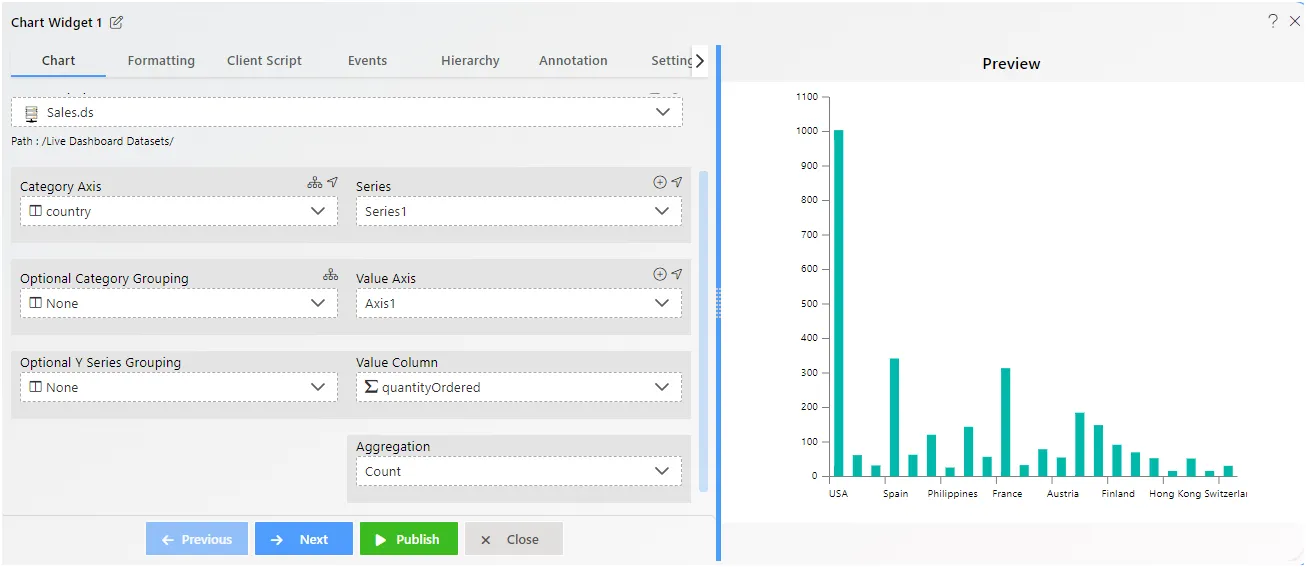
Create the Chart:
- Click on the chart icon in the widget panel to open the edit box.
- Select a chart pattern (e.g., column chart).
Settings:
- Dataset: Sales.DS
- Category Axis: country
- Value Axis: Quantityordered
-
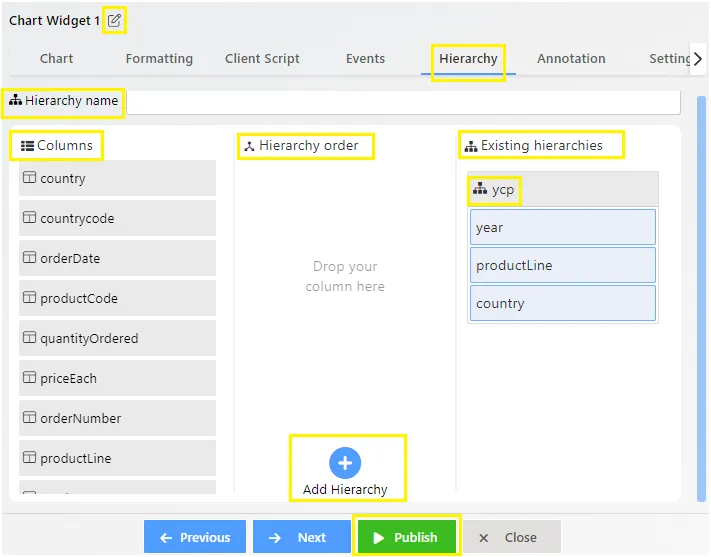
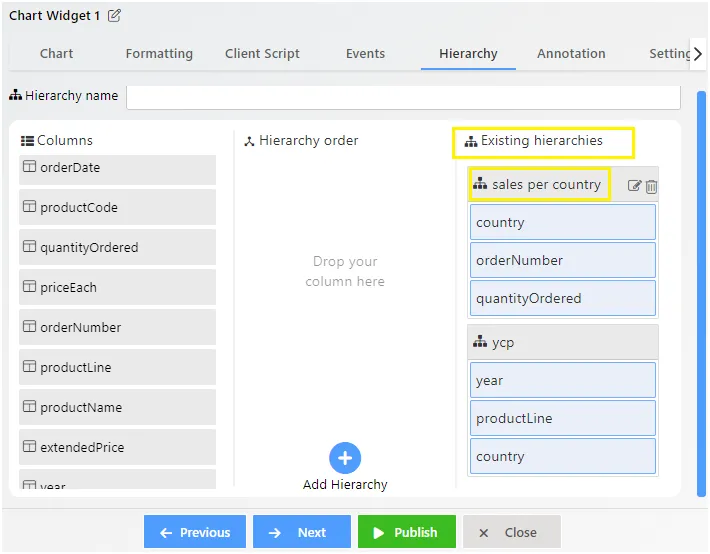
Add Hierarchy: Click on the hierarchy tab to see the options.
-
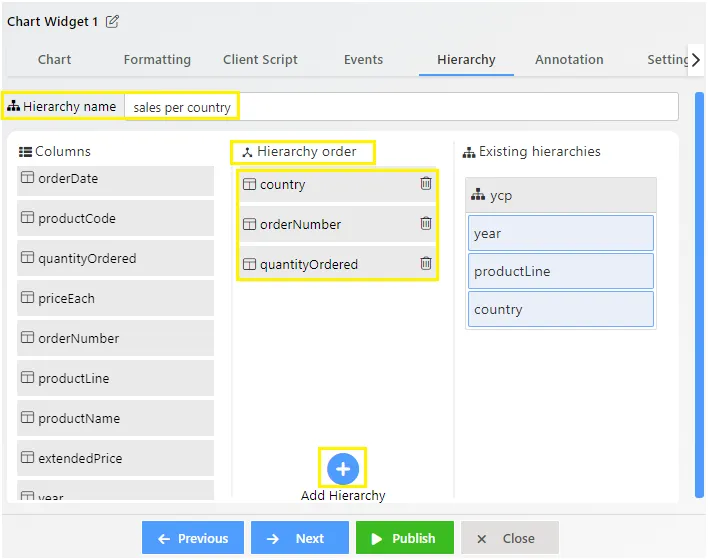
Name the Hierarchy:
- Provide a suitable name for the hierarchy.
- Drag and drop data columns in the desired order.
-
Add Hierarchy: Click on the Add Hierarchy button at the bottom.
-
Confirm Hierarchy: The data columns will appear under Existing Hierarchies.
-
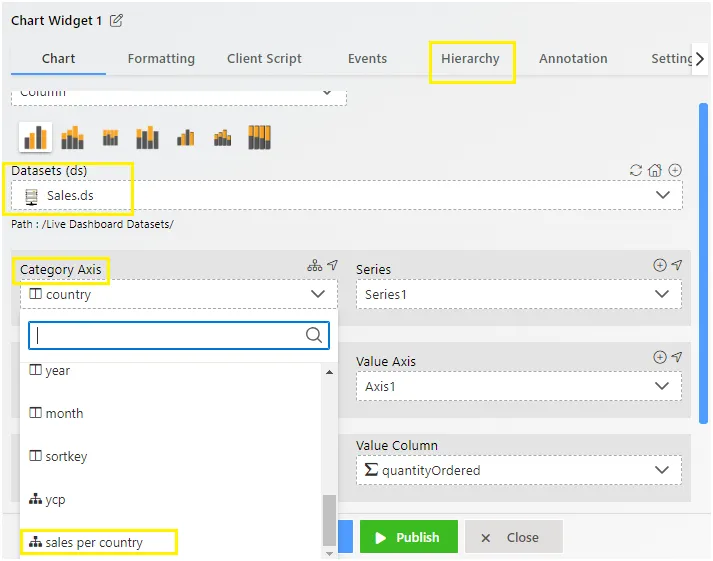
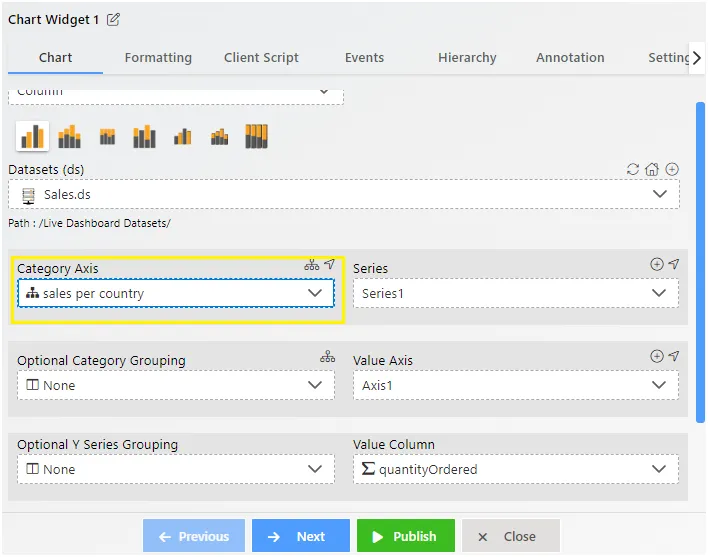
Update Chart:
- Go back to the chart tab.
- Select CountryDrill from the dropdown in the Category Axis option instead of country.
-
Publish and Preview:
- Click on the Publish button.
- Switch to preview mode.
-
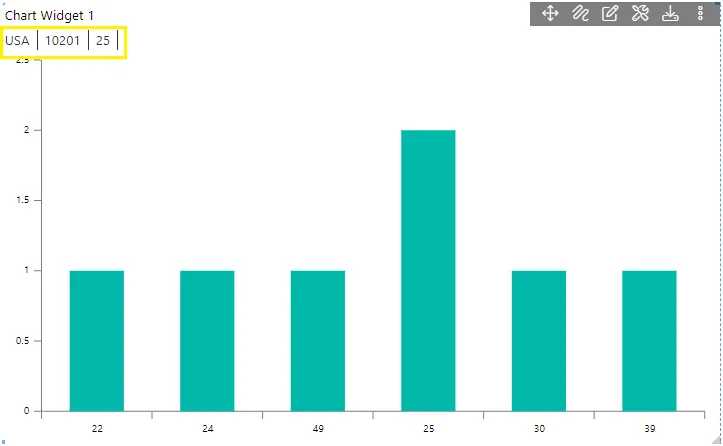
Dynamic Data View: Click on any bar in the chart to view dynamic data for that country.
-
View Stages: All stages will appear in the top-left corner of the chart.