Pie-Donut Chart Formatting
The Formatting properties enable you to control and customize the appearance of information in a pie or donut chart through three categories: General, Series, and Legend properties.
Formatting Properties: This video explains how to use the formatting properties of the pie-donut chart in AIV.
Accessing Formatting Properties: To access the formatting properties, click on the Formatting tab on the pie or donut chart.

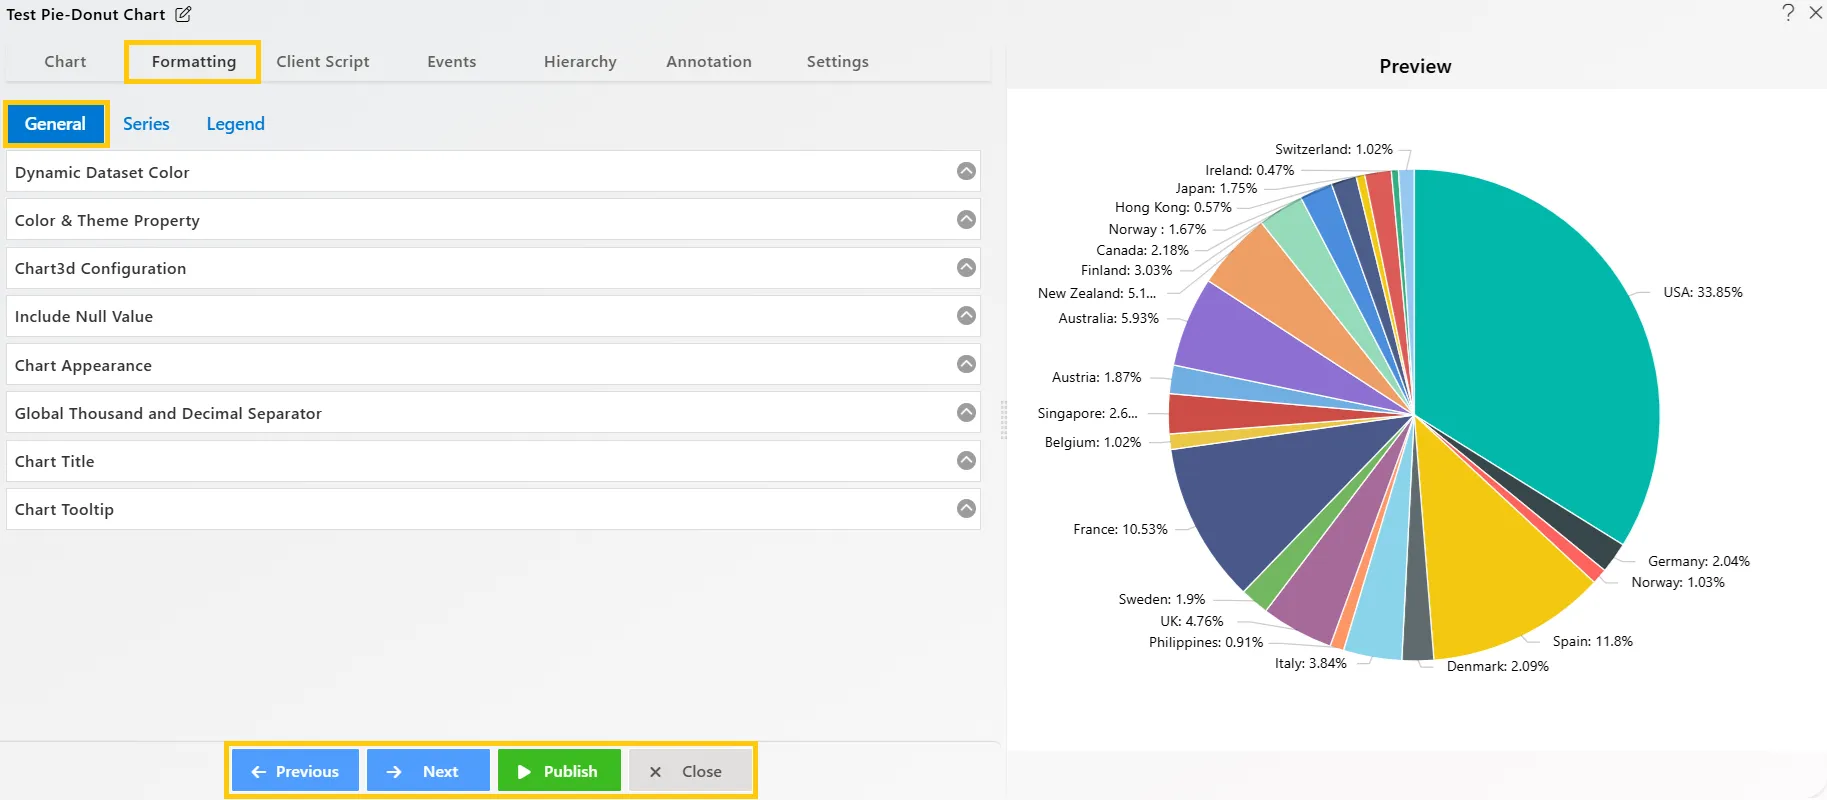
General Properties
-
The General settings allow you to change the Color and Theme according to the user’s preferences, add a Chart Title for better clarity, and enable Chart Tooltips so that the value is displayed when hovering over the chart.
-
The bottom menu contains the following buttons:
-
Previous and Next: These buttons are used to navigate between the tabs in the chart’s edit menu.
-
Publish: This button is used to publish the chart.
-
Cancel: Clicking this button will close the chart’s edit box. If you publish the widget, the changes you applied will be saved. However, if you do not publish, the changes will not be saved, and the edit box will simply close.
-
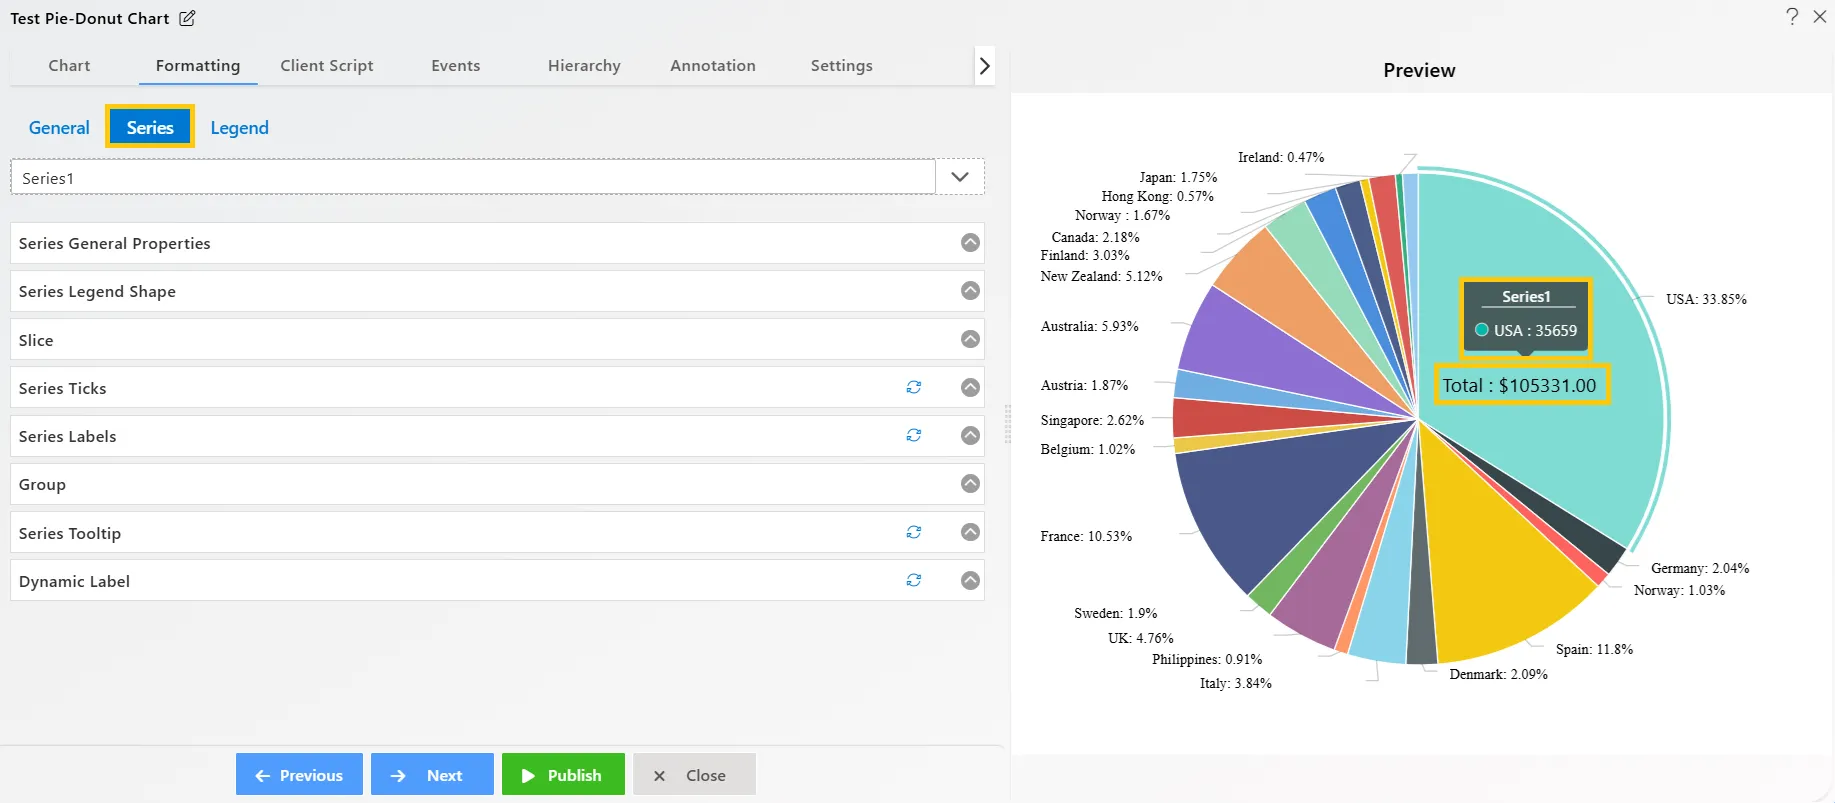
Series Properties
Series Properties are used to customize the appearance and behavior of the pie chart slices. This includes settings for slice appearance, series tick appearance, series labels, grouping of series, custom tooltips, and dynamic labels. These options allow you to fine-tune the display of each series in the chart, making it more visually informative and interactive.
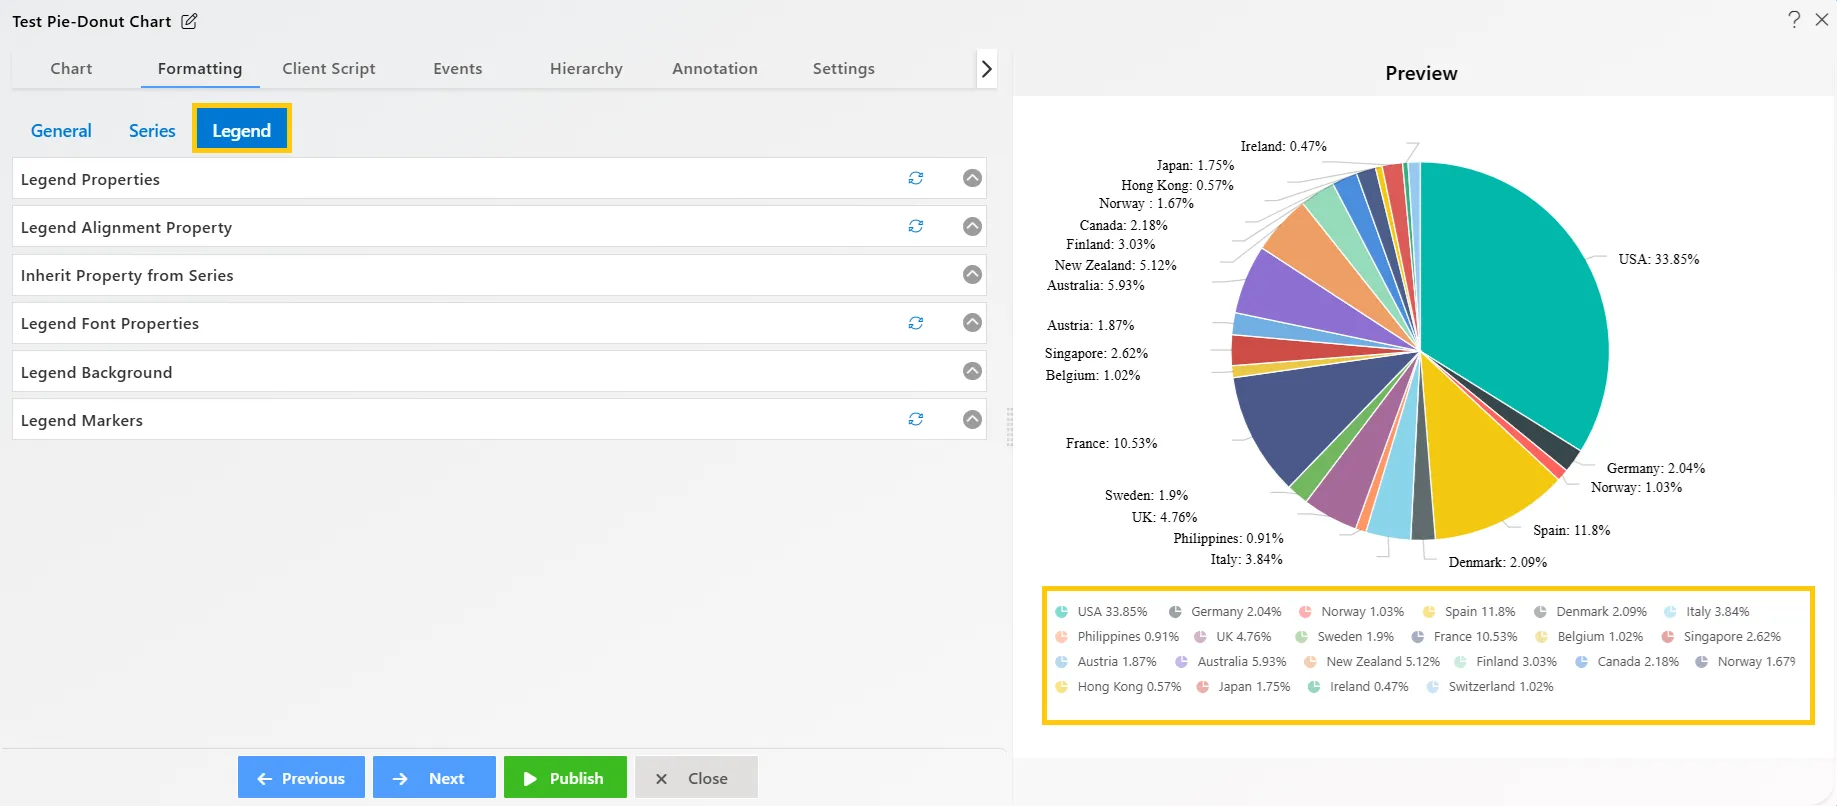
Legend Properties
Legends properties are used to add legends to the pie chart and apply user required appearance settings according to the user’s preferences.These properties include legend alignment, inheritance from series, font properties, legend background, and legend markers.