Pie Chart General Fomatting
The General Properties are as follows:
General - Dynamic Dataset Color
Overview: This feature lets you pick colors based on your dataset’s values. Simply choose the color you want by selecting the corresponding value from the dataset column.
For more information on Dynamic Dataset Color click here
General - Color and Theme Property
Overview: Users select colors and themes for charts by category, globally, or for specific groups, enhancing customization and visual appeal effortlessly.
For more information on Color and Theme Property click here
General - Include Null Value
Overview: This feature allows for the inclusion of null values on the chart, ensuring comprehensive data representation. Users can visualize data gaps seamlessly, facilitating accurate analysis and decision-making within the chart.
For more information on Include Null Value click here
General - Chart Appearance
Overview: The pie chart is unique due to its round shape, setting it apart from other chart types. Users can customize the chart’s appearance by adjusting the radius, inner radius, start angle, and end angle.
Description:
-
Inner Radius: Adjusts the space within the pie chart. Increasing or decreasing this value changes the size of the central hole in the donut chart.
-
Radius: Modifies the overall size of the pie chart. Users can increase or decrease this value to make the chart larger or smaller.
-
Start Angle: Sets the starting position of the pie slices. The total angle for the entire data set is 360 degrees, which represents a full circle. By default, the start angle is 0 degrees.
-
End Angle: Controls the ending position of the pie slices. The total angle for the entire data set is 360 degrees, representing a full circle. By default, the end angle is set to 360 degrees.
General - Global Thousand and Decimal Separator
Overview: Adding decimal and thousand separators enhances the clarity and meaning of numerical values, making them easier to interpret and understand at a glance.
For more information on Global Thousand and Decimal Separator click here
General - Chart Title
Overview: User can add the required title on the chart by using the chart title.
For more information on Chart Title click here
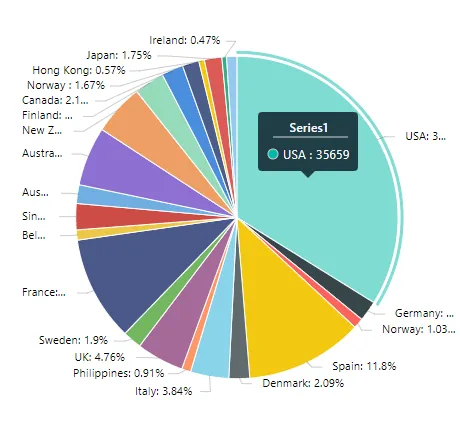
General - Chart Tooltip
Overview: Tooltips allow users to view additional information when hovering over chart elements.
For more information on Chart Tooltip click here