Custom Visualization Widget
Overview
Custom visualization provides the function to add custom code into AIV. by using this users can make required visualizations like charts, maps, tables, user interface for the dashboard, custom filters, etc. The AIV application provides the wide range of charts although user can add the custom chart using this component, the user need to add the HTML, JavaScript and CSS code blocks to visualize the charts on dashboard.
Custom Visualization: This video contains how to create custom visualization in AIV.
Custom visualization features as follows
General
The general properties allows user to add the dataset where user can fetch the required data on the custom visualization widget.
Properties
Work in progress!
Client script
Client scripts enable the system to execute specified code on the client (web browser) when client-based events occur, such as form loading, after form submission, or when a field value changes. Thoughtfully designed client scripts can shorten the time it takes to fill out a form and enhance the user experience.
HTML
In the HTML section, you can write code to create the structure of your web page. This includes adding headings, paragraphs, images, and other elements to organize your content and make it look good.
Javascript
In the Javascript section, you can write code to make your web page interactive. This means you can add features like buttons that change when you click them, forms that validate input, and animations that make your page more dynamic.
CSS
In the CSS section, you can write code to style your web page. This includes changing colors, fonts, spacing, and layout to make your page look exactly how you want it to. CSS helps you create a visually pleasing design that matches your style.
Some of the example of Custom Visualization Here, we have example to user required charts, you can click on each of the chart and access the code of chart widget.
Example 1:
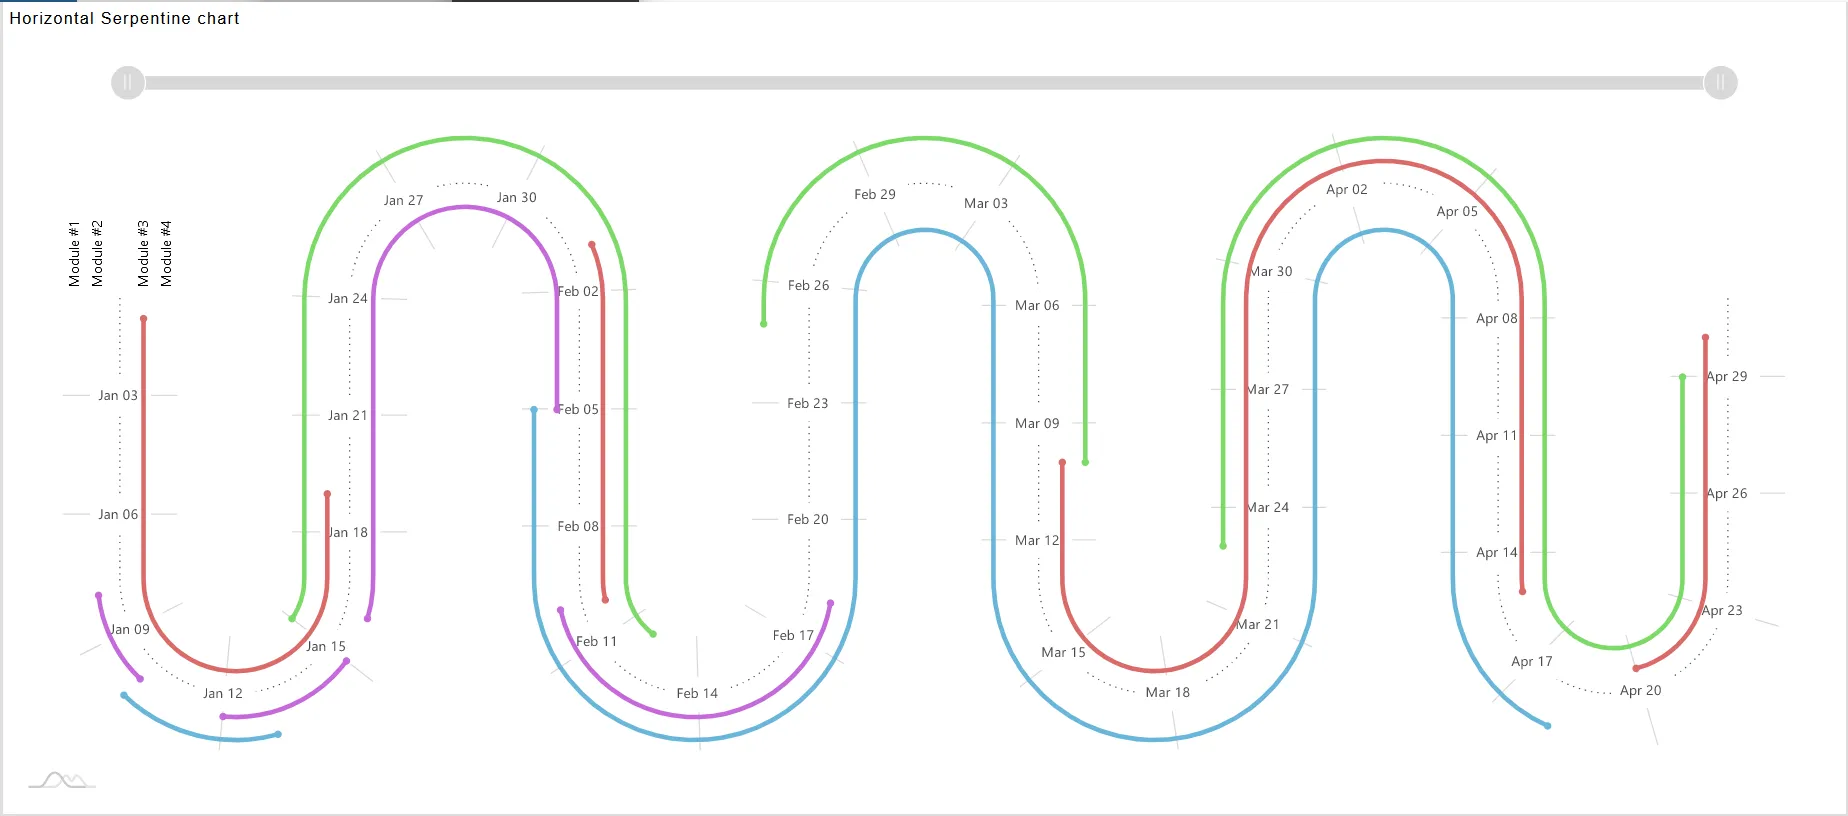
To create the above example put the code in relevant tabs:
HTML
 <script src="https://cdn.amcharts.com/lib/4/core.js"></script>
<script src="https://cdn.amcharts.com/lib/4/charts.js"></script>
<script src="https://cdn.amcharts.com/lib/4/plugins/timeline.js"></script>
<script src="https://cdn.amcharts.com/lib/4/plugins/bullets.js"></script>
<script src="https://cdn.amcharts.com/lib/4/themes/animated.js"></script>
<div id="chartdiv"></div>
JavaScript
// Themes begin
am4core.useTheme(am4themes_animated);
// Themes end

var chart = am4core.create("chartdiv", am4plugins_timeline.SerpentineChart);
chart.curveContainer.padding(20,20,20,20);
chart.levelCount = 8;
chart.orientation = "horizontal";
chart.fontSize = 11;

var colorSet = new am4core.ColorSet();
colorSet.saturation = 0.6;

chart.data = [ {
  "category": "Module #1",
  "start": "2016-01-10",
  "end": "2016-01-13",
  "color": colorSet.getIndex(0),
  "task": "Gathering requirements"
}, {
  "category": "Module #1",
  "start": "2016-02-05",
  "end": "2016-04-18",
  "color": colorSet.getIndex(0),
  "task": "Development"
}, {
  "category": "Module #2",
  "start": "2016-01-08",
  "end": "2016-01-10",
  "color": colorSet.getIndex(5),
  "task": "Gathering requirements"
}, {
  "category": "Module #2",
  "start": "2016-01-12",
  "end": "2016-01-15",
  "color": colorSet.getIndex(5),
  "task": "Producing specifications"
}, {
  "category": "Module #2",
  "start": "2016-01-16",
  "end": "2016-02-05",
  "color": colorSet.getIndex(5),
  "task": "Development"
}, {
  "category": "Module #2",
  "start": "2016-02-10",
  "end": "2016-02-18",
  "color": colorSet.getIndex(5),
  "task": "Testing and QA"
}, {
  "category": "",
  "task": ""
},{
  "category": "Module #3",
  "start": "2016-01-01",
  "end": "2016-01-19",
  "color": colorSet.getIndex(9),
  "task": "Gathering requirements"
}, {
  "category": "Module #3",
  "start": "2016-02-01",
  "end": "2016-02-10",
  "color": colorSet.getIndex(9),
  "task": "Producing specifications"
}, {
  "category": "Module #3",
  "start": "2016-03-10",
  "end": "2016-04-15",
  "color": colorSet.getIndex(9),
  "task": "Development"
}, {
  "category": "Module #3",
  "start": "2016-04-20",
  "end": "2016-04-30",
  "color": colorSet.getIndex(9),
  "task": "Testing and QA"
}, {
  "category": "Module #4",
  "start": "2016-01-15",
  "end": "2016-02-12",
  "color": colorSet.getIndex(15),
  "task": "Gathering requirements"
},{
  "category": "Module #4",
  "start": "2016-02-25",
  "end": "2016-03-10",
  "color": colorSet.getIndex(15),
  "task": "Development"
}, {
  "category": "Module #4",
  "start": "2016-03-23",
  "end": "2016-04-29",
  "color": colorSet.getIndex(15),
  "task": "Testing and QA"
} ];

chart.dateFormatter.dateFormat = "yyyy-MM-dd";
chart.dateFormatter.inputDateFormat = "yyyy-MM-dd";

var categoryAxis = chart.yAxes.push(new am4charts.CategoryAxis());
categoryAxis.dataFields.category = "category";
categoryAxis.renderer.grid.template.disabled = true;
categoryAxis.renderer.labels.template.paddingRight = 25;
categoryAxis.renderer.minGridDistance = 10;
categoryAxis.renderer.innerRadius = -60;
categoryAxis.renderer.radius = 60;

var dateAxis = chart.xAxes.push(new am4charts.DateAxis());
dateAxis.renderer.minGridDistance = 70;
dateAxis.baseInterval = { count: 1, timeUnit: "day" };

dateAxis.renderer.tooltipLocation = 0;
dateAxis.startLocation = -0.5;
dateAxis.renderer.line.strokeDasharray = "1,4";
dateAxis.renderer.line.strokeOpacity = 0.7;
dateAxis.tooltip.background.fillOpacity = 0.2;
dateAxis.tooltip.background.cornerRadius = 5;
dateAxis.tooltip.label.fill = new am4core.InterfaceColorSet().getFor("alternativeBackground");
dateAxis.tooltip.label.paddingTop = 7;

var labelTemplate = dateAxis.renderer.labels.template;
labelTemplate.verticalCenter = "middle";
labelTemplate.fillOpacity = 0.7;
labelTemplate.background.fill =  new am4core.InterfaceColorSet().getFor("background");
labelTemplate.background.fillOpacity = 1;
labelTemplate.padding(7,7,7,7);

var categoryAxisLabelTemplate = categoryAxis.renderer.labels.template;
categoryAxisLabelTemplate.horizontalCenter = "left";
categoryAxisLabelTemplate.adapter.add("rotation", function (rotation, target) {
  var position = dateAxis.valueToPosition(dateAxis.min);
  return dateAxis.renderer.positionToAngle(position) + 90;
})

var series1 = chart.series.push(new am4plugins_timeline.CurveColumnSeries());
series1.columns.template.height = am4core.percent(20);
series1.columns.template.tooltipText = "{task}: [bold]{openDateX}[/] - [bold]{dateX}[/]";

series1.dataFields.openDateX = "start";
series1.dataFields.dateX = "end";
series1.dataFields.categoryY = "category";
series1.columns.template.propertyFields.fill = "color"; // get color from data
series1.columns.template.propertyFields.stroke = "color";
series1.columns.template.strokeOpacity = 0;

var bullet = new am4charts.CircleBullet();
series1.bullets.push(bullet);
bullet.circle.radius = 3;
bullet.circle.strokeOpacity = 0;
bullet.propertyFields.fill = "color";
bullet.locationX = 0;


var bullet2 = new am4charts.CircleBullet();
series1.bullets.push(bullet2);
bullet2.circle.radius = 3;
bullet2.circle.strokeOpacity = 0;
bullet2.propertyFields.fill = "color";
bullet2.locationX = 1;

chart.scrollbarX = new am4core.Scrollbar();
chart.scrollbarX.align = "center"
chart.scrollbarX.width = am4core.percent(90);

var cursor = new am4plugins_timeline.CurveCursor();
chart.cursor = cursor;
cursor.xAxis = dateAxis;
cursor.yAxis = categoryAxis;
cursor.lineY.disabled = true;
cursor.lineX.strokeDasharray = "1,4";
cursor.lineX.strokeOpacity = 1;

dateAxis.renderer.tooltipLocation2 = 0;
categoryAxis.cursorTooltipEnabled = false;
CSS
body {
font-family: -apple-system, BlinkMacSystemFont, "Segoe UI", Roboto, Helvetica, Arial, sans-serif, "Apple Color Emoji", "Segoe UI Emoji", "Segoe UI Symbol";
}

#chartdiv {
width: 100%;
height: 600px;
}
.demo-theme-dark .demo-background {
background: #000;
}
Example 2:
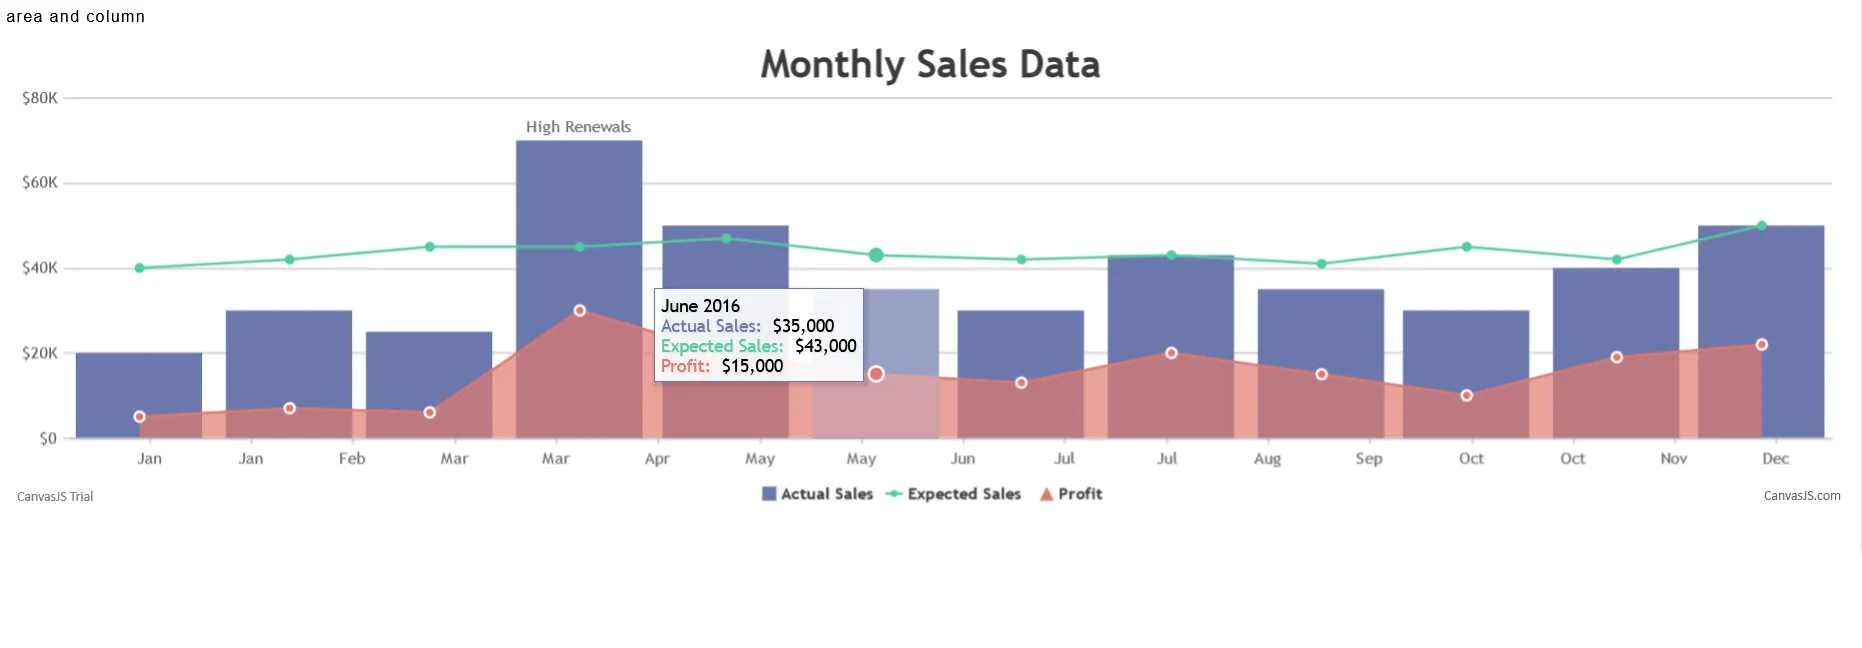
To create the above example put the code in relevant tabs:
HTML
<!DOCTYPE HTML>
<html>
<head>
<script>

</script>
</head>
<body>
<div id="chartContainer" style="height: 370px; width: 100%;"></div>
<script src="https://canvasjs.com/assets/script/canvasjs.min.js"></script>
</body>
</html>
JavaScript
                            window.onload = function () {

                                var chart = new CanvasJS.Chart("chartContainer", {
                                    animationEnabled: true,
                                    theme: "light2",
                                    title: {
                                        text: "Monthly Sales Data"
                                    },
                                    axisX: {
                                        valueFormatString: "MMM"
                                    },
                                    axisY: {
                                        prefix: "$",
                                        labelFormatter: addSymbols
                                    },
                                    toolTip: {
                                        shared: true
                                    },
                                    legend: {
                                        cursor: "pointer",
                                        itemclick: toggleDataSeries
                                    },
                                    data: [
                                    {
                                        type: "column",
                                        name: "Actual Sales",
                                        showInLegend: true,
                                        xValueFormatString: "MMMM YYYY",
                                        yValueFormatString: "$#,##0",
                                        dataPoints: [
                                            { x: new Date(2016, 0), y: 20000 },
                                            { x: new Date(2016, 1), y: 30000 },
                                            { x: new Date(2016, 2), y: 25000 },
                                            { x: new Date(2016, 3), y: 70000, indexLabel: "High Renewals" },
                                            { x: new Date(2016, 4), y: 50000 },
                                            { x: new Date(2016, 5), y: 35000 },
                                            { x: new Date(2016, 6), y: 30000 },
                                            { x: new Date(2016, 7), y: 43000 },
                                            { x: new Date(2016, 8), y: 35000 },
                                            { x: new Date(2016, 9), y:  30000},
                                            { x: new Date(2016, 10), y: 40000 },
                                            { x: new Date(2016, 11), y: 50000 }
                                        ]
                                    },
                                    {
                                        type: "line",
                                        name: "Expected Sales",
                                        showInLegend: true,
                                        yValueFormatString: "$#,##0",
                                        dataPoints: [
                                            { x: new Date(2016, 0), y: 40000 },
                                            { x: new Date(2016, 1), y: 42000 },
                                            { x: new Date(2016, 2), y: 45000 },
                                            { x: new Date(2016, 3), y: 45000 },
                                            { x: new Date(2016, 4), y: 47000 },
                                            { x: new Date(2016, 5), y: 43000 },
                                            { x: new Date(2016, 6), y: 42000 },
                                            { x: new Date(2016, 7), y: 43000 },
                                            { x: new Date(2016, 8), y: 41000 },
                                            { x: new Date(2016, 9), y: 45000 },
                                            { x: new Date(2016, 10), y: 42000 },
                                            { x: new Date(2016, 11), y: 50000 }
                                        ]
                                    },
                                    {
                                        type: "area",
                                        name: "Profit",
                                        markerBorderColor: "white",
                                        markerBorderThickness: 2,
                                        showInLegend: true,
                                        yValueFormatString: "$#,##0",
dataPoints: [
{ x: new Date(2016, 0), y: 5000 },
{ x: new Date(2016, 1), y: 7000 },
{ x: new Date(2016, 2), y: 6000 },
{ x: new Date(2016, 3), y: 30000 },
{ x: new Date(2016, 4), y: 20000 },
{ x: new Date(2016, 5), y: 15000 },
{ x: new Date(2016, 6), y: 13000 },
{ x: new Date(2016, 7), y: 20000 },
{ x: new Date(2016, 8), y: 15000 },
{ x: new Date(2016, 9), y:  10000},
{ x: new Date(2016, 10), y: 19000 },
{ x: new Date(2016, 11), y: 22000 }
]
}]
});
chart.render();

function addSymbols(e) {
var suffixes = ["", "K", "M", "B"];
var order = Math.max(Math.floor(Math.log(e.value) / Math.log(1000)), 0);

                                    if(order > suffixes.length - 1)
                                        order = suffixes.length - 1;

                                    var suffix = suffixes[order];
                                    return CanvasJS.formatNumber(e.value / Math.pow(1000, order)) + suffix;
                                }

                                function toggleDataSeries(e) {
                                    if (typeof (e.dataSeries.visible) === "undefined" || e.dataSeries.visible) {
                                        e.dataSeries.visible = false;
                                    } else {
                                        e.dataSeries.visible = true;
                                    }
                                    e.chart.render();
                                }

                                }