EmbedLink with Pivot using GlobalParameter
Ths below document is removed from the web, if you are able to see it, please report us!
Embed Link with pivot using global parameter: This video contains how to use Embed Link with pivot using global parameter.
In this Document you will learn to Create a dashboard and add a Card chart widget and Table widget. You will learn create embed link and how to connect embed link with one dashboard to another dashboard and filter detail dashboard with global filter parameters.
[note: to apply global filters, parameterized dataset should be used in detail dashboard]
Use case: You have one summary level of Dashboard which contains summarized data. You don’t want to show detail data in this dashboard. Also, you have another dashboard which contains Detail level of data which is called Detailed dashboard. Now if you want to see detail data of summarized data and by clicking on summarized data it should redirect to the detail dashboard you have created with filter value applied on summary dashboard.
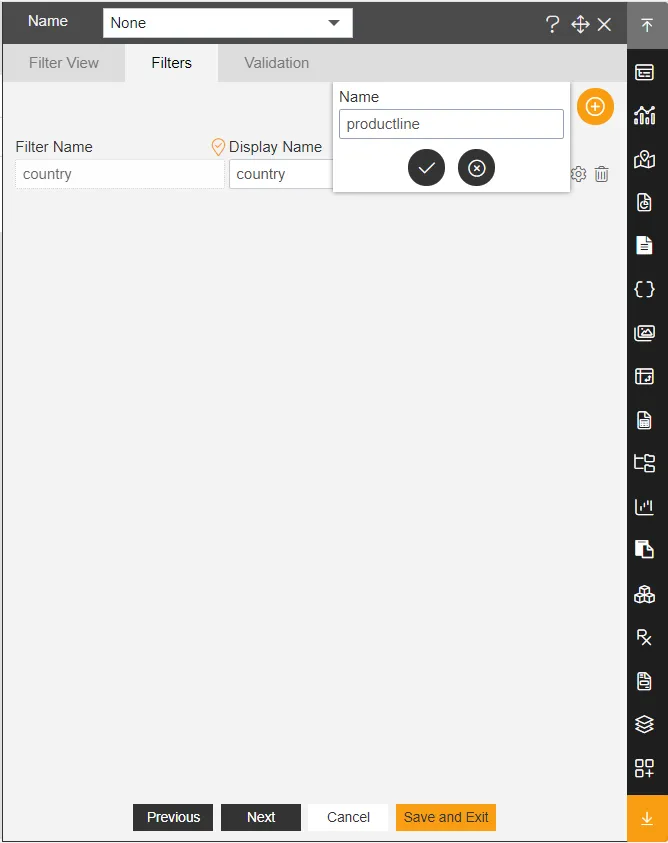
-In this document we will see how to meet this use case. So, we have one summary level of dashboard and one detail level of dashboard. Summary level dashboard contains pivot table showing grouped data and detail dashboard have table widget showing detailed data of that column chart. Detail dashboard table has 2 parameters 1. country and 2. Productline
-In this scenario we will use pivot table. When you click on any numbers it will redirect us to detail data dashboard. Here in pivot table, we have to pass rows and column values of data we are clicking.

Click on hamburger icon.
![]()
Click on (+) icon, from Dashboard tab.
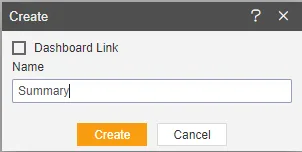
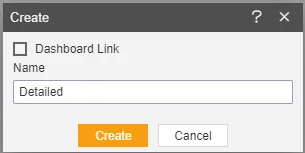
The Create Dashboard Dialog box will pop up on screen. Enter Dashboard Name as shown in Figure.
Click on Create After entering Dashboard Name in dialog box.
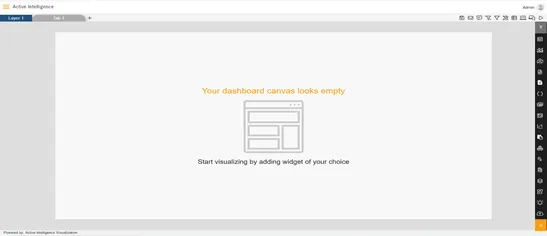
You will see an Empty Dashboard, As shown in figure below:
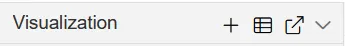
From left Vertical Menu Select the Pivot Widget icon.
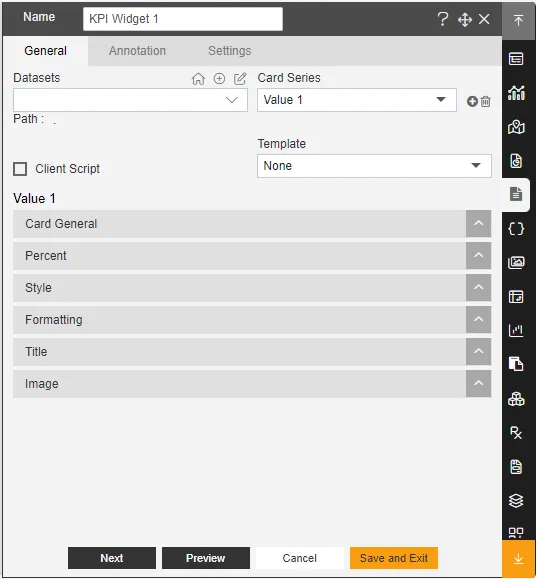
The Edit menu box appears as you click on Pivot chart icon. And a widget gets added in content place automatically in dashboard, As shown in Figure below:
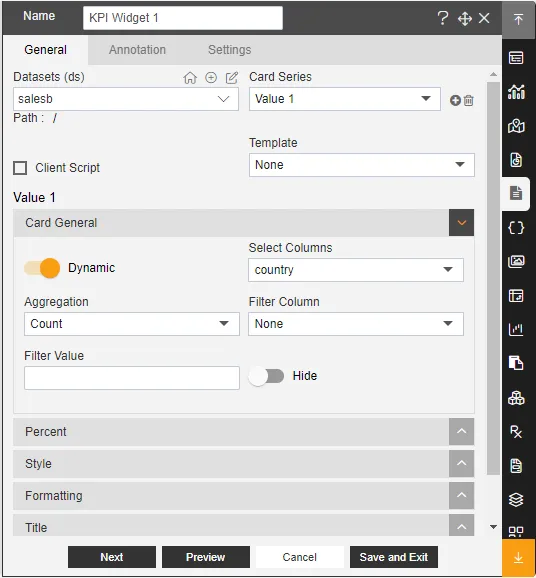
Enter Following details in Pivot:
Type: Table
Dataset: Salesb.ds
Drag and drop country in rows and productLine in Columns.
Drag and drop country in Values.
Fill above details in edit box, As Shown in figure;
Click on Save and Exit.
Pivot widget is shown in Figure Below:
Create a New Dashboard and give Name Detailed Data of the dashboard, As shown in figure Below:
From left Vertical Menu Select the Table Widget icon.
The Edit menu box appears as you click on Table Widget icon. And a widget gets added in content place automatically in dashboard, As shown in Figure below:
Enter Following details in General Property:
Dataset: Parameter.ds
In Dataset Column Select All the Field.
Fill above details in edit box, As Shown in figure below;
Click on Publish button, As shown in figure below:
Click on Embed icon 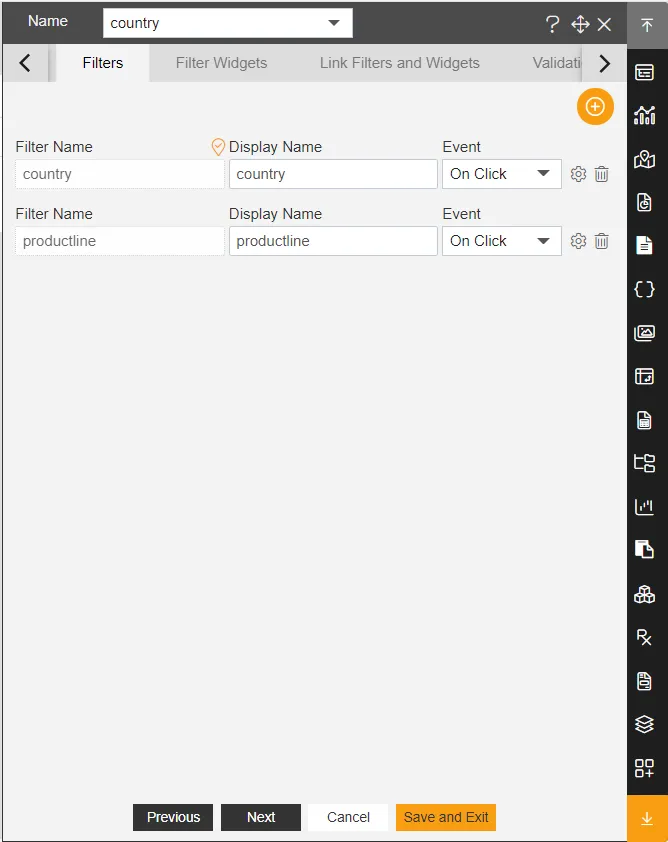 of the Detailed Data Dashboard, As shown in Figure Below:
Copy the Link of Internal Embed in Embed.
Click on Cancel.
Open the Pivot Summery Dashboard in Edit mode.
Enter Following details in Pivot Property:
-Click on Hyperlink dropdown and select Custom Link
Fill above details As shown in figure below:

Click on Preview Save and Exit.
Now Click on Preview mode.
Here If we want to see detail data of Belgium with classic cars, just click on 4 number and it will take row value as Belgium and column value as classic cars in embed URL.
It will redirect on Detailed Data Dashboard. You can see data is filtered by country Belgium and Product line Classic Cars, As shown in figure Below:
Here’s the revised and refined version of your document:
Embed Link with Pivot Using Global Parameter:
This document explains how to create an embed link with a pivot table using global parameters. By following the steps, you’ll learn how to create a dashboard with a card chart widget and a table widget, connect the embed link between dashboards, and apply global filter parameters to the detailed dashboard.
Note: To apply global filters, a parameterized dataset should be used in the detailed dashboard.
Use Case:
You have a summary-level dashboard that contains summarized data, and you do not want to show detailed data on this dashboard. Additionally, you have another dashboard, referred to as the Detailed Dashboard, which contains detailed data. When you click on summarized data in the summary dashboard, you want it to redirect to the detailed dashboard with the appropriate filter values applied.
In this scenario, we will use a pivot table. When you click on any numbers in the pivot table, it will redirect to the detailed dashboard, passing the row and column values of the data you clicked on.
-
Click on the hamburger icon.
-
Click on the (+) icon from the Dashboard tab.
-
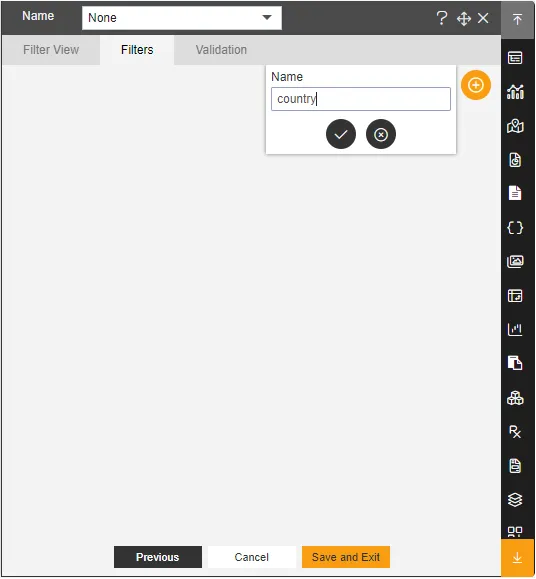
In the Create Dashboard dialog box, enter the dashboard name as shown in the figure.
-
Click on Create after entering the dashboard name.
-
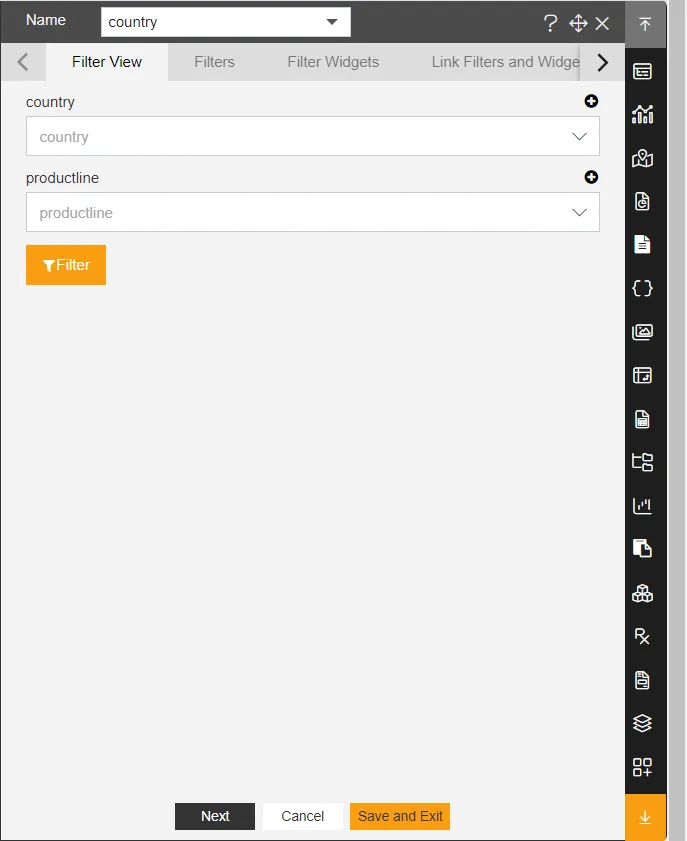
You will see an empty dashboard as shown below:
-
From the left vertical menu, select the Pivot Widget icon.
-
The edit menu box will appear after you click on the Pivot Widget icon. The widget will be added to the dashboard automatically, as shown below:
-
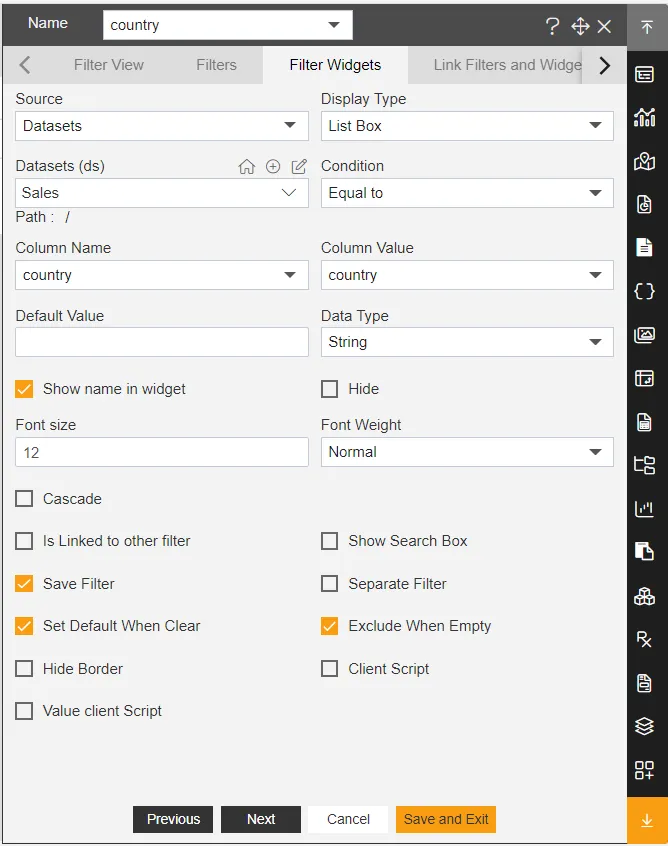
Enter the following details in the Pivot settings:
- Type: Table
- Dataset: Salesb.ds
Then, drag and drop the following fields:
- Country in rows
- ProductLine in columns
- Country in values
The filled details should look like the figure below:
-
Click on Save and Exit.
-
The Pivot widget will be displayed as shown below:
-
Create a new dashboard and name it Detailed Data, as shown in the figure below:
-
From the left vertical menu, select the Table Widget icon.
-
The edit menu box will appear after you click on the Table Widget icon, and the widget will be added to the dashboard automatically, as shown below:
-
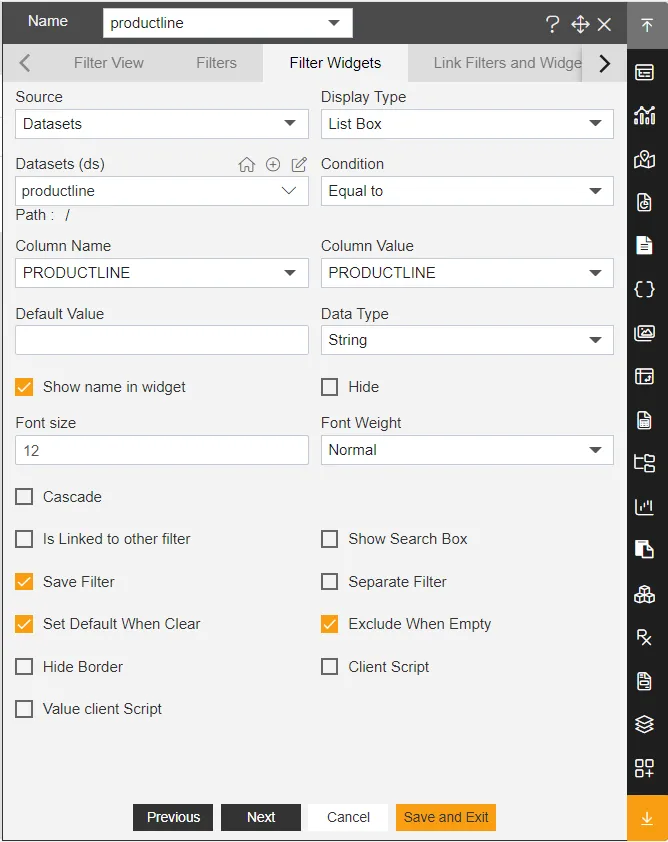
Enter the following details in the General Property section:
- Dataset: Parameter.ds
- Dataset Column: Select all fields
The filled details should look like the figure below:
- Click on the Publish button, as shown below:
- Click on the Embed icon of the Detailed Data Dashboard, as shown below:
-
Copy the link from the Internal Embed section.
-
Click on Cancel.
-
Open the Pivot Summary Dashboard in Edit mode.
-
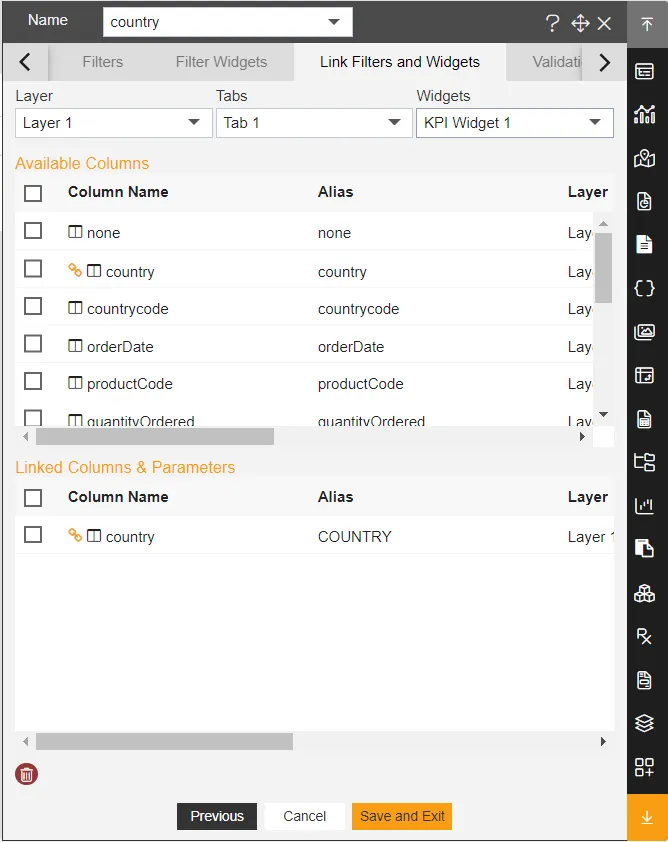
In the Pivot Property section, do the following:
- Click on the Hyperlink dropdown and select Custom Link.
- Link:
http://localhost:8080/aiv/embed/internal/aivHubInternalEmbed/a_i__212&a_n__DetailedData&a_as__dashboards&a_af__true/aivg_country___{{country}}&aivg_productline___{{productLine}}
The filled details should look like the figure below:
-
Click on Preview, Save, and Exit.
-
Switch to Preview mode.
-
To see detailed data for Belgium with Classic Cars, click on the number “4.” The system will use the row value “Belgium” and the column value “Classic Cars” in the embed URL.
-
The system will redirect to the Detailed Data Dashboard, where the data will be filtered by country (Belgium) and product line (Classic Cars), as shown below: