Event Filter with Report
Introduction
This document explain how to use events to filter report in dashboard. BIRT report can be either in same dashboard or it can be embed link of report open in new browser tab.
Objective
The objective of this document is to guide the user to create and get hands-on with the event to filter reports.
Prerequisites
Users will be required following dataset to understand this filter scenario;
-
customers.ds dataset
-
customer details.rptdocument report
Download above files by clicking here. extract this file and upload the dataset in the dataset section and upload the report in the report section using drag and drop.
Use case
Detailed data of any dashboard can be represented in tabular format or in BIRT report format. this detailed data can be added in a different tab of the same dashboard or in a different dashboard. but common use case found is when we click on any widget to open its detail data, the detail data table or report should get filtered by clicked value. here we have described a scenario where the user clicks on a customer number and it will redirect the user to the second tab and filter the report widget with the clicked value.
Second secario here explained is on click of customer number it will open embed report in a new tab with clicked value
Steps to follow
Please follow these steps to cascade filter and understand it’s function;
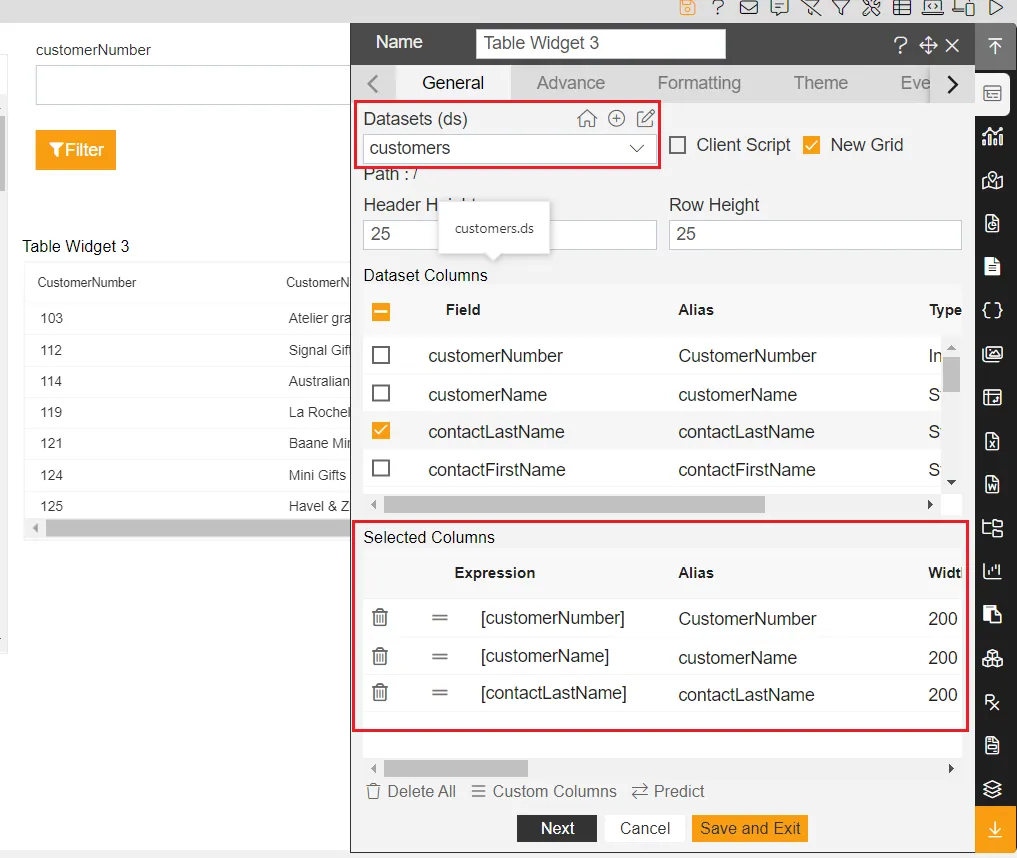
- Create a new dashboard and add a table widget to it. provide the following properties in the table widget;
Datasets: customers.ds
Select columns: customerNumber, customerName & contactLastName
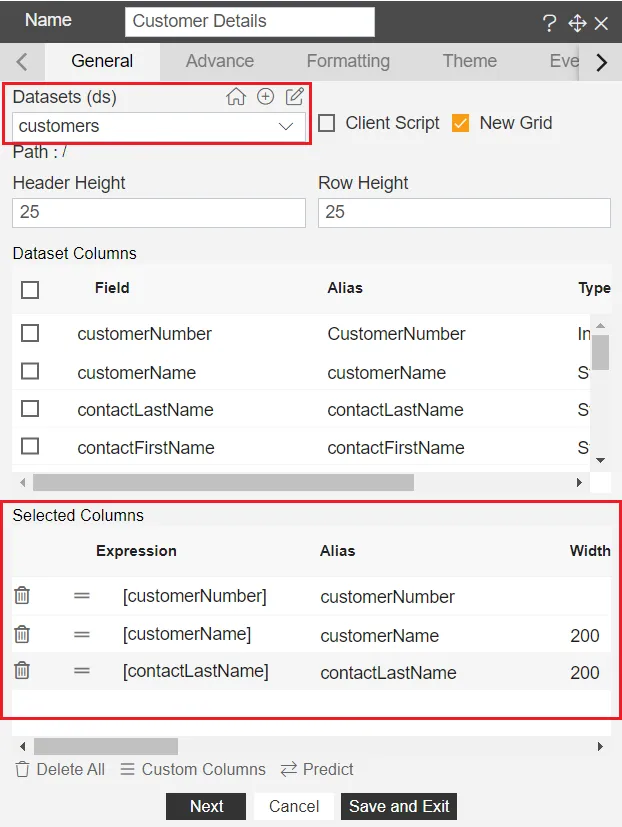
-
Click on save and exit to save changes.
-
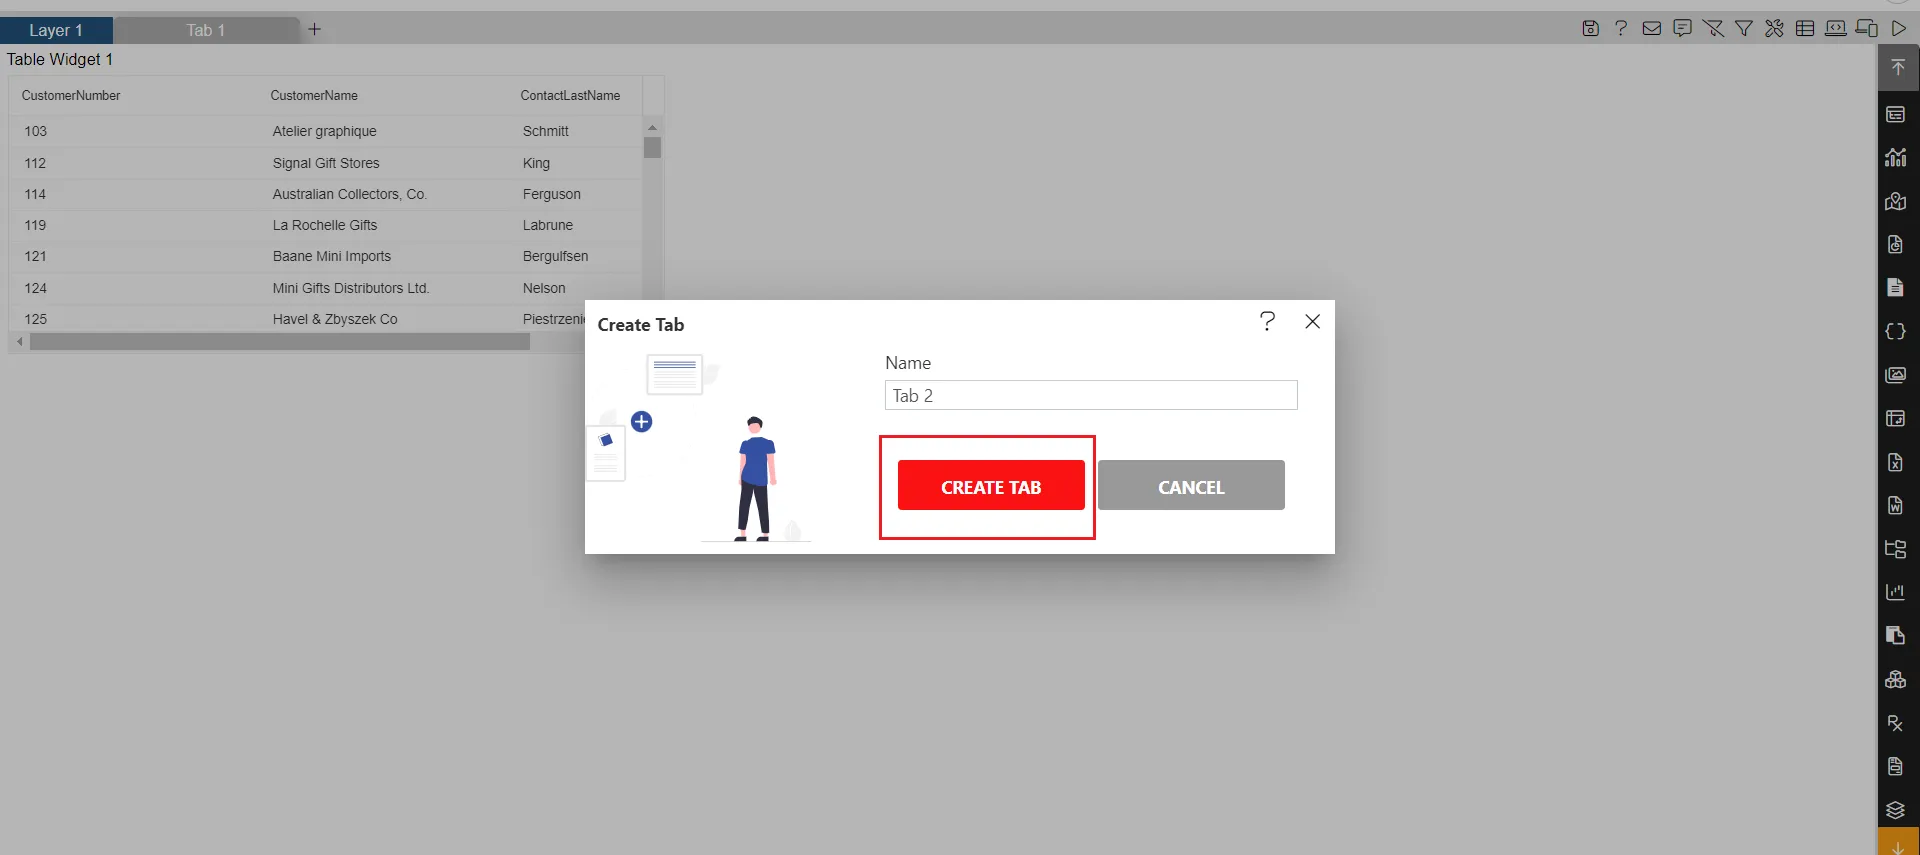
Create a new tab.
- Add a report widget.
- select customer details report from the list of reports.
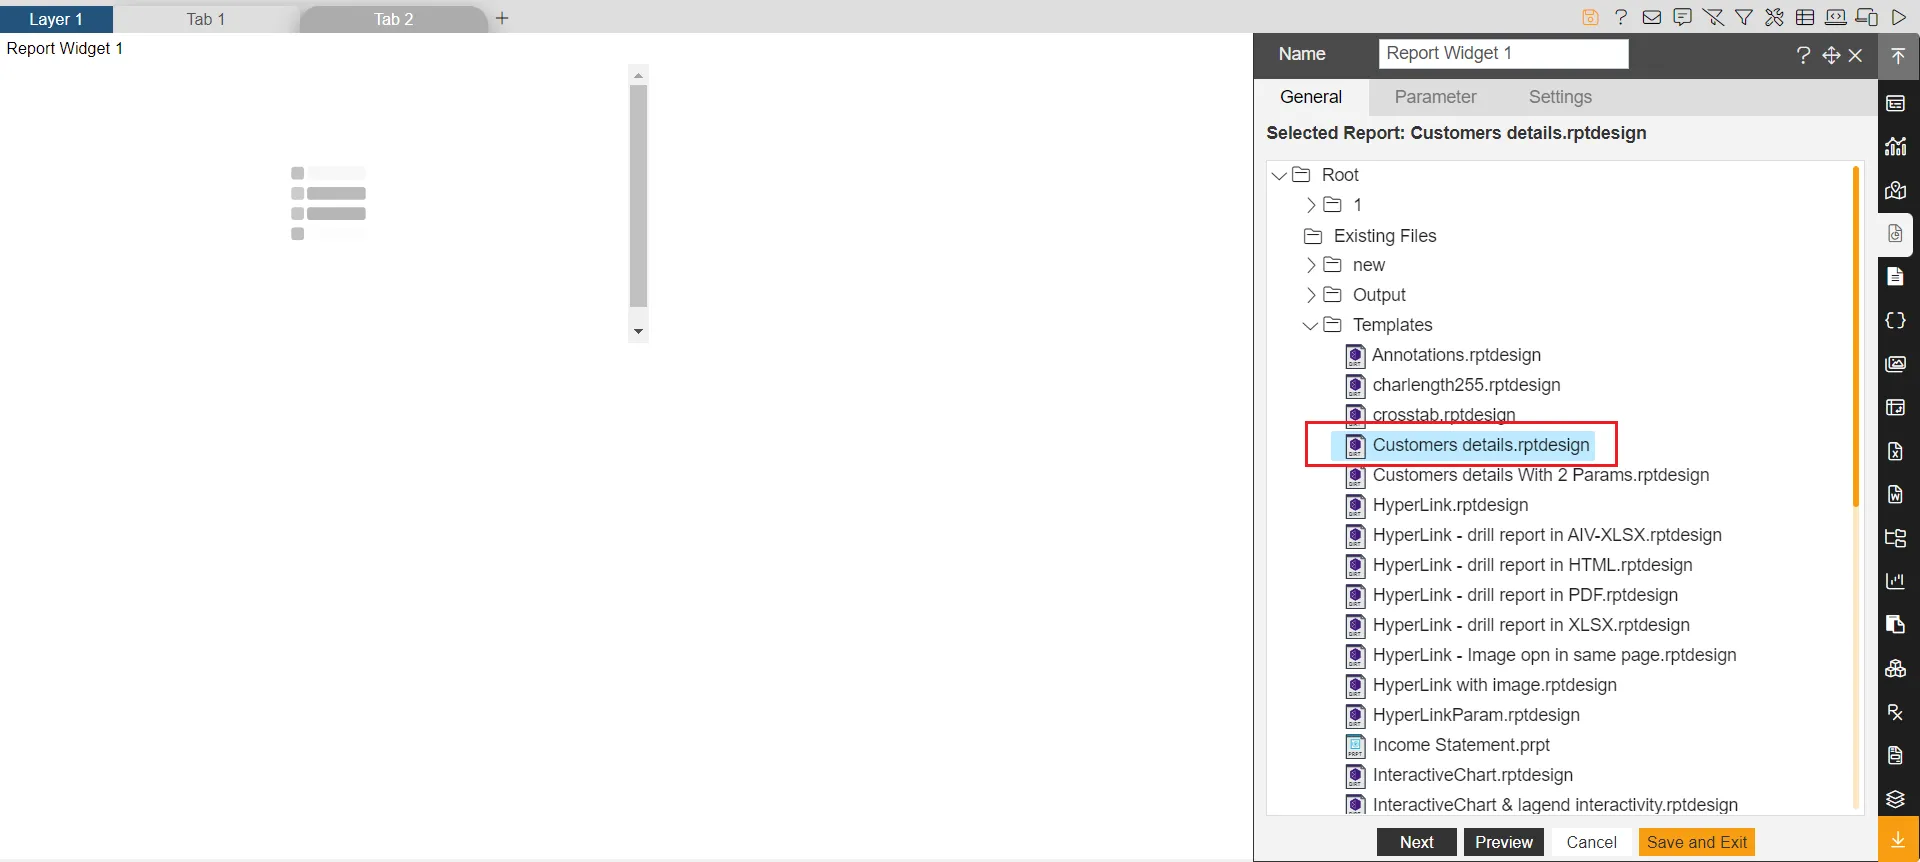
- When you click on the report, it will take you to Parameter tab. here select report Output Type and provide the default value of the report parameter.
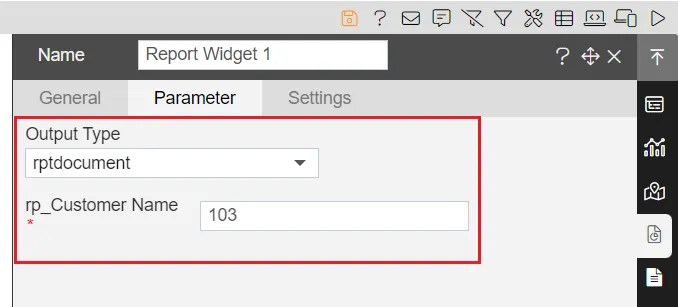
- Click on save and exit to save the changes. resize the widget and go to preview mode and check the report widget formed in preview mode.
-
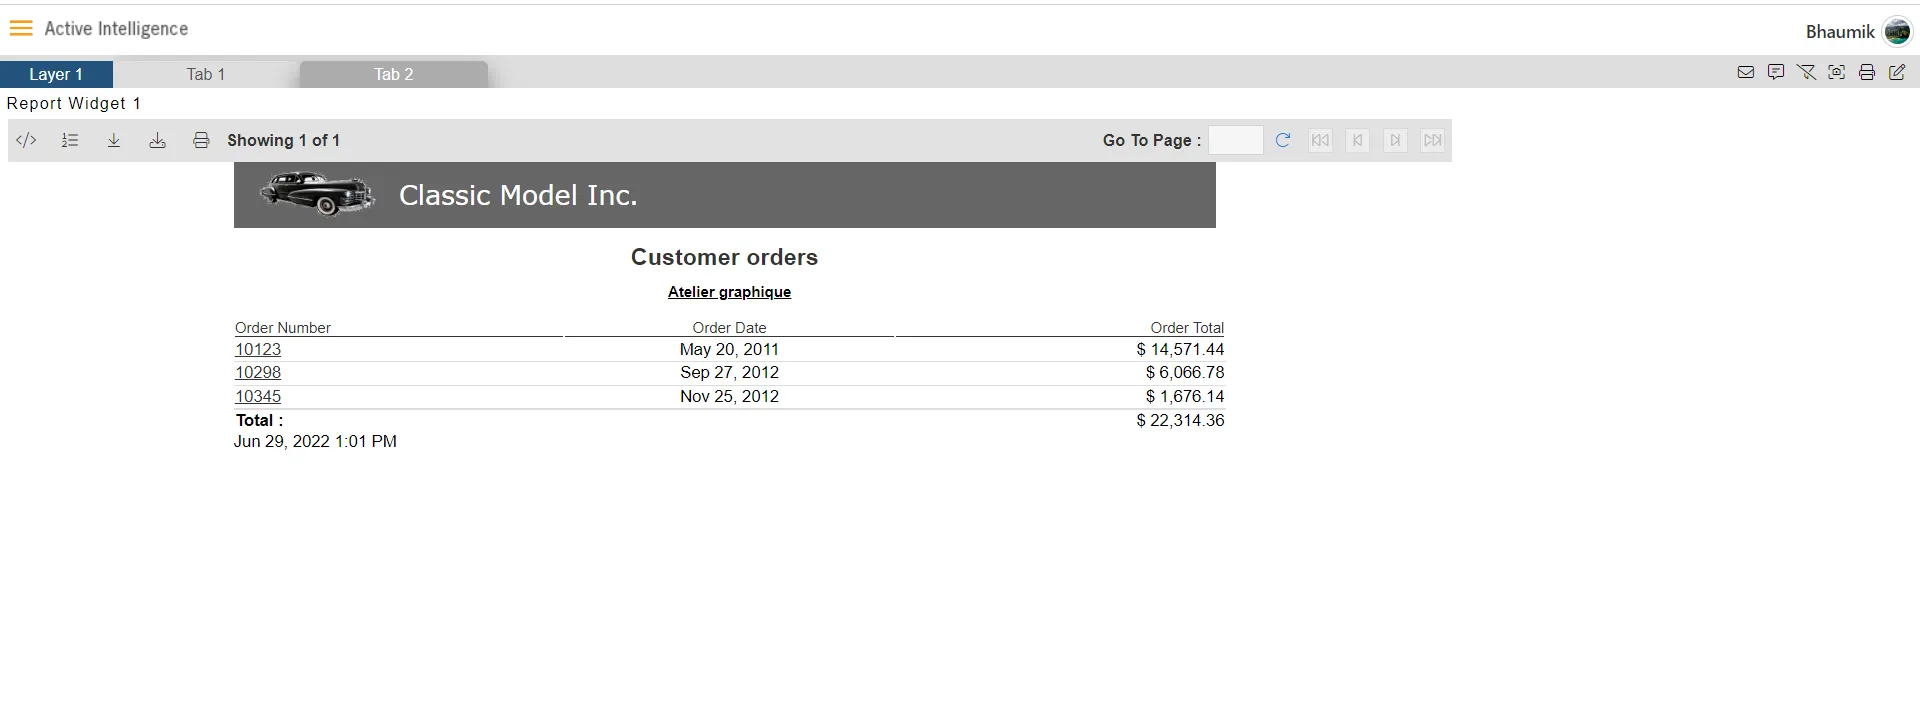
Now when the user clicks on the customer number from the table widget in tab 1 will take us to tab 2 and open the report filtered by a clicked customer number value.
-
To do this, we need to create a custom column and provide a script that redirects user on tab 2 and filter report.
-
To create a custom column, go to dashboard edit mode and edit the table widget from tab 1.
-
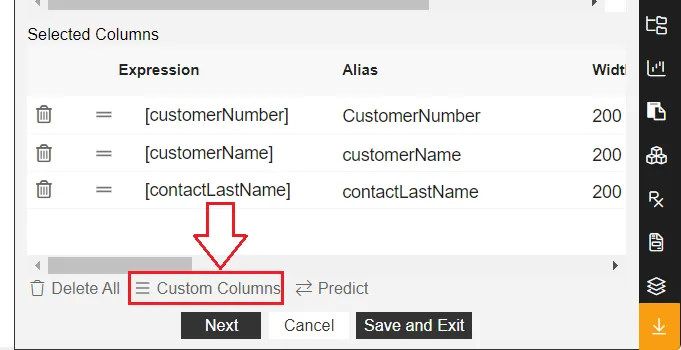
Click on the custom column to add a custom column.
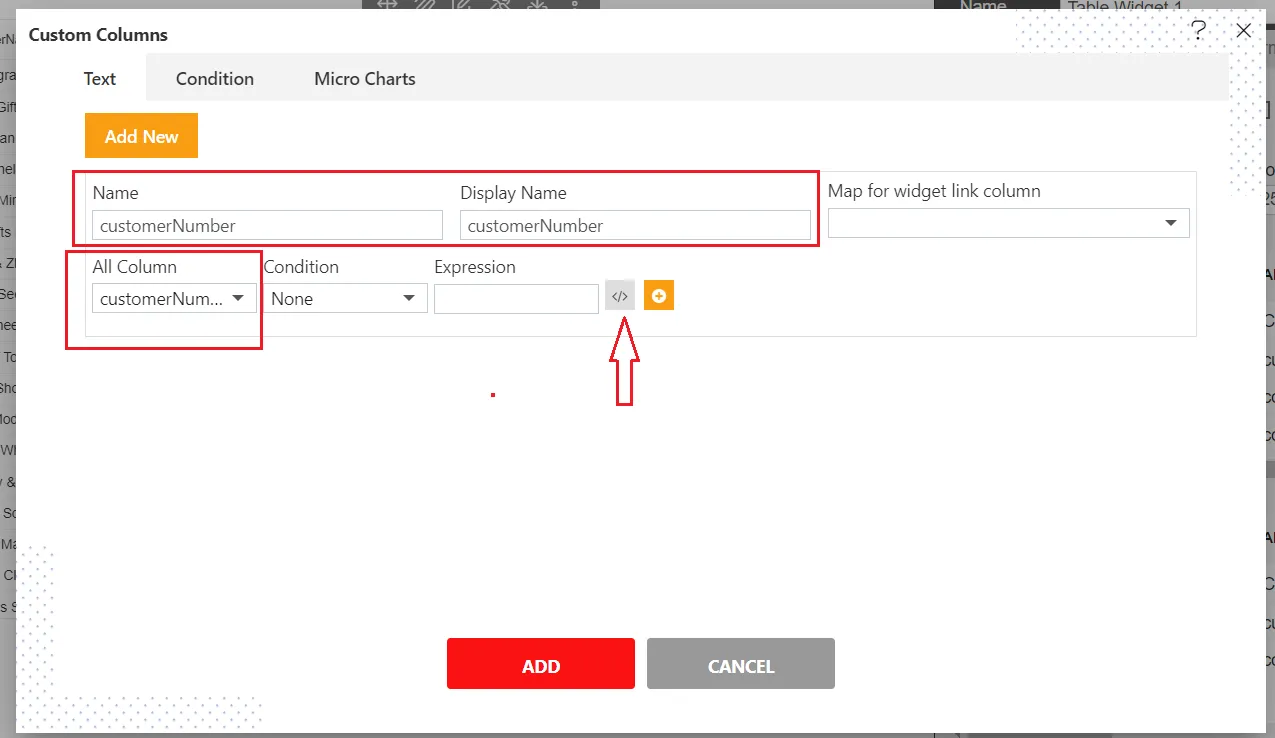
- Click on Add New, provide Name & Display Name , select customerNumber column from the dropdown. click on expression button to add hyperlink.
- In expression builder, paste script provided below,
<a  href="javascript:void(0)" onclick='var tab = new CustomEvent("aiv-change-tab", {"detail": 1 });
window.parent.dispatchEvent(tab);
var item = {{customerNumber}};
setTimeout(function(){
var filter = new CustomEvent("aiv-filter-call", {"detail": {"customerNumber": item}  });
window.parent.dispatchEvent(filter); });'>{{customerNumber}}</a>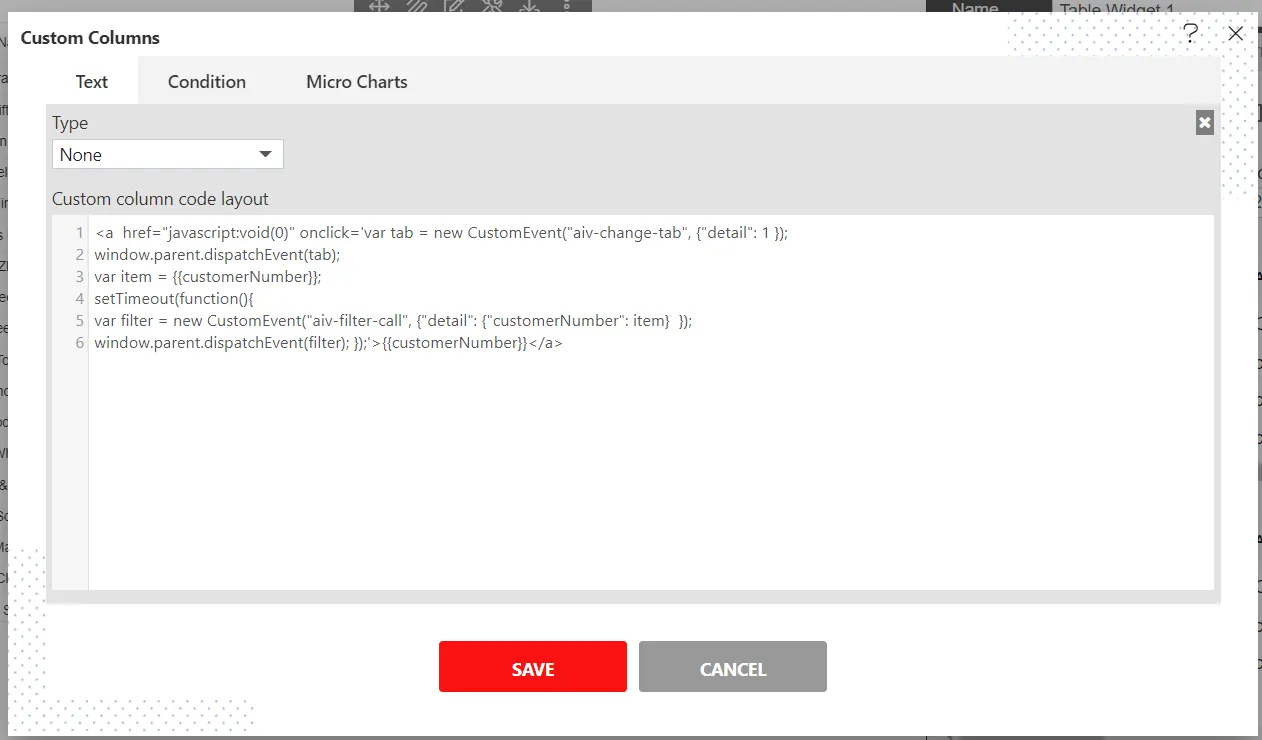
Script explanation: This script takes the on-click value from the table and passes this value to an intermediate filter and this filter passes clicked value in to report widget. at the same time when the user clicks on the customer number script will redirect the user to the second tab.
In line number 5 at {"detail": {"customerNumber": item} } customerNumber is the filter name. we will create this in following steps.
-
Click on the save button to save the changes and click on Add button to add this column to table widget.
-
Now you can see 2 customer number columns, one is selected from the dataset and the second is the custom column we have just created. so delete the column selected from the dataset.
-
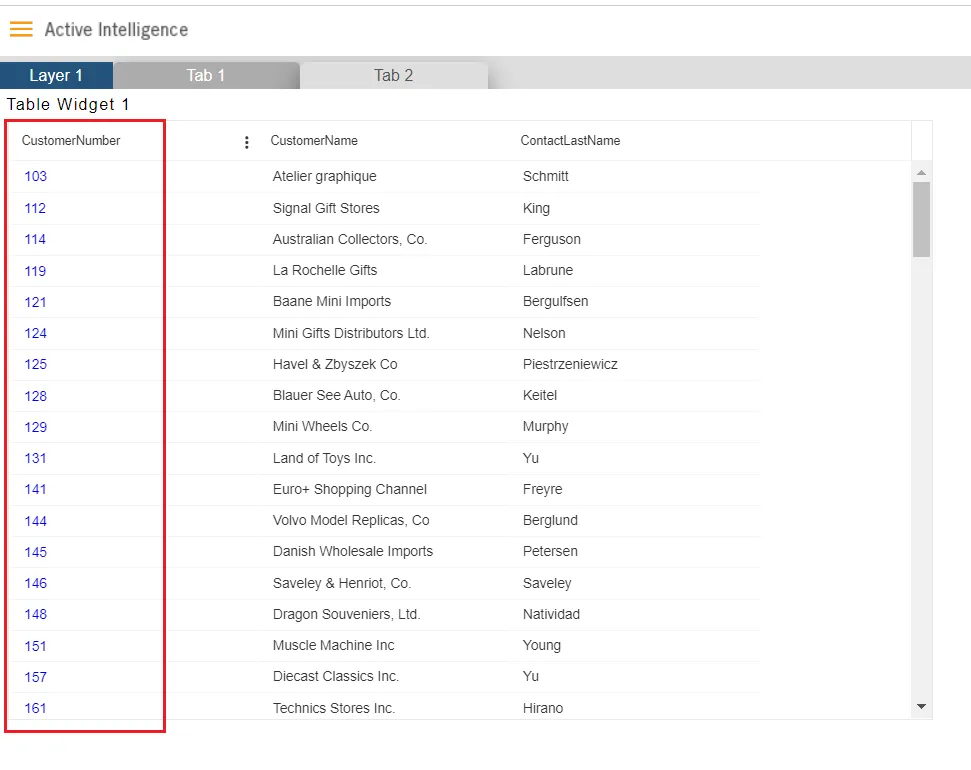
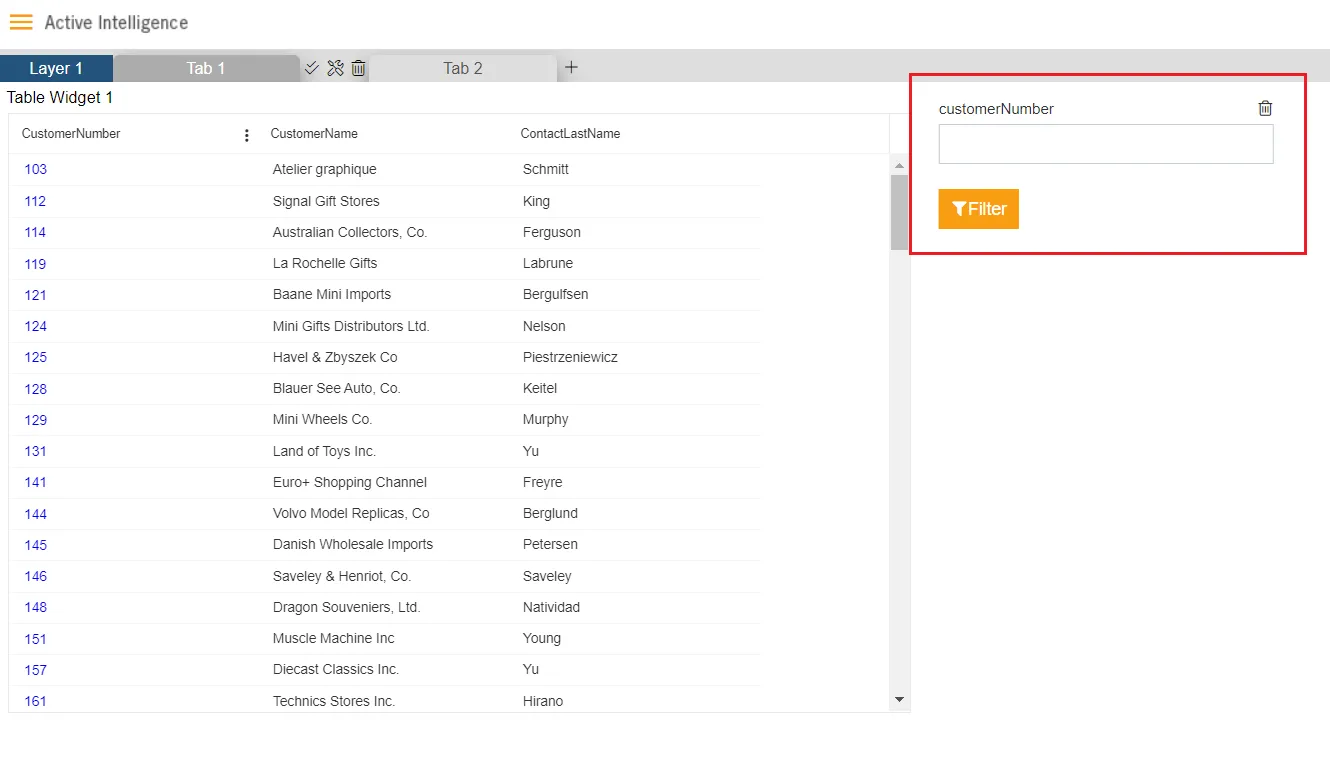
Go to dashboard preview mode and you can see a screen like the below image,
Create filter
-
Click on dashboard edit mode to make changes.
-
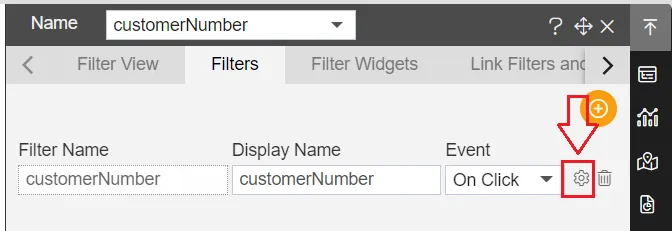
Create a filter named customerNumber, keep event type On Change and click on the setting icon to configure the filter.
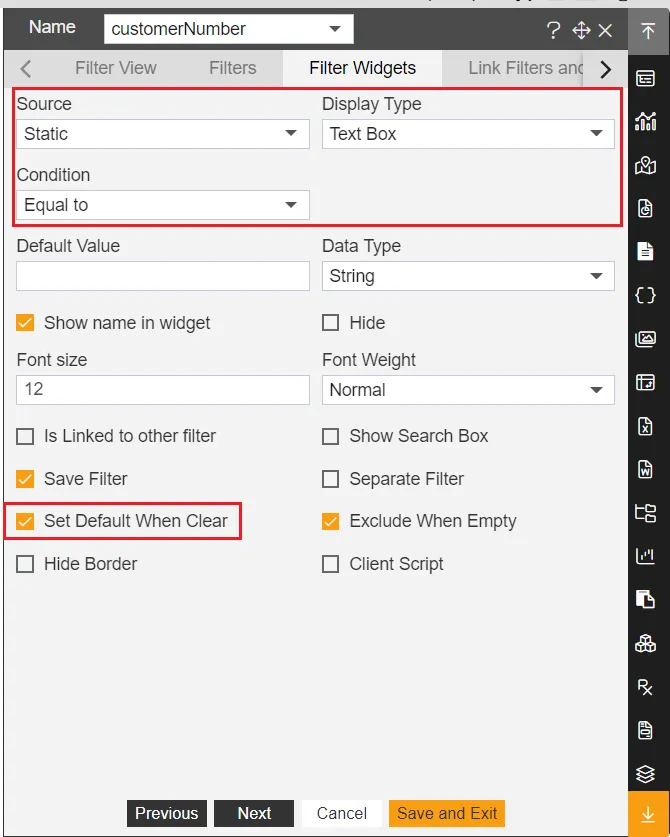
- In Filter Widgets tab select properties as below;
Source: Static
Display Type: Text Box
Condition: Equal to
Set Default When Clear: Marked
-
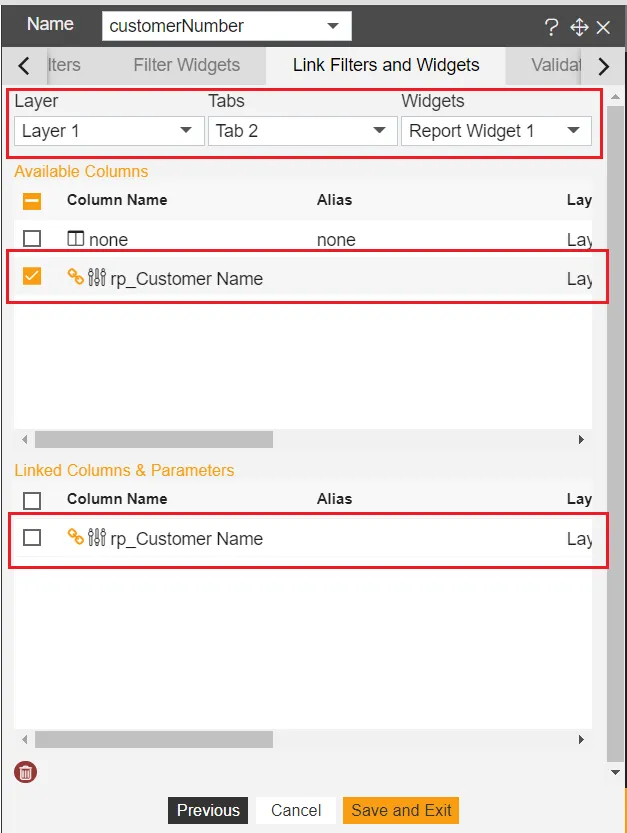
Click on Link Filters and Widgets tab to link filter with report widget
-
In this tab, select following properties,
**Layer:**Layer 1
Tabs: Tab 2
Widgets: Report Widget 1
Select report parameter rp_Customer Name to link filter with this parameter.
-
Click on save and exit to save these changes.
-
Again click on the filter icon to add a filter to the dashboard. go to Filter View and click on the + icon to add this filter to active tab.
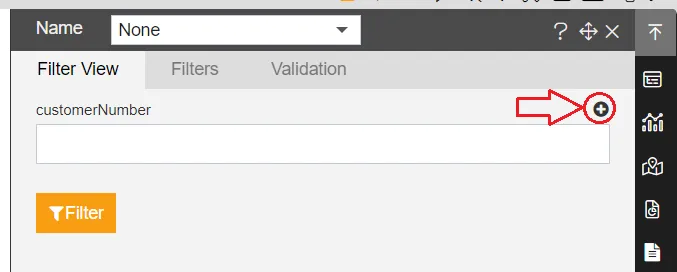
- You can see screen like below image,
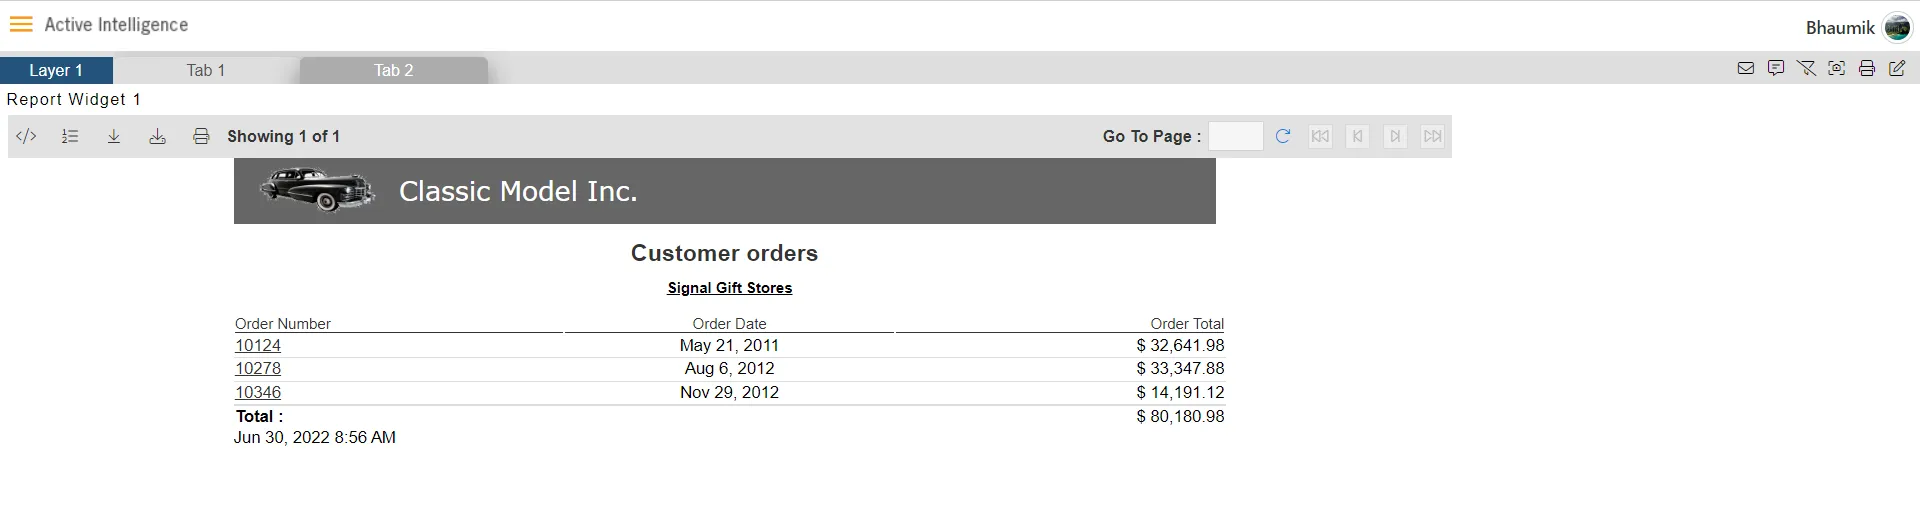
- Go to dashboard preview mode and click on any customer number from the table. as soon as you click on the customer number, it will redirect you to the second tab and filter the report with a clicked customer number value. here we have clicked on customer number 114.
-
Edit the dashboard and add a new widget to demonstrate the second scenario.
-
Edit the dashboard and add a new table widget in tab 1
-
Provide the following properties to the table widget;
Datasets: Customers.ds
Columns to select: CustomerNumber, customerName, contactLastName
-
Click on save and exit to save the changes.
-
You can see screen like below;
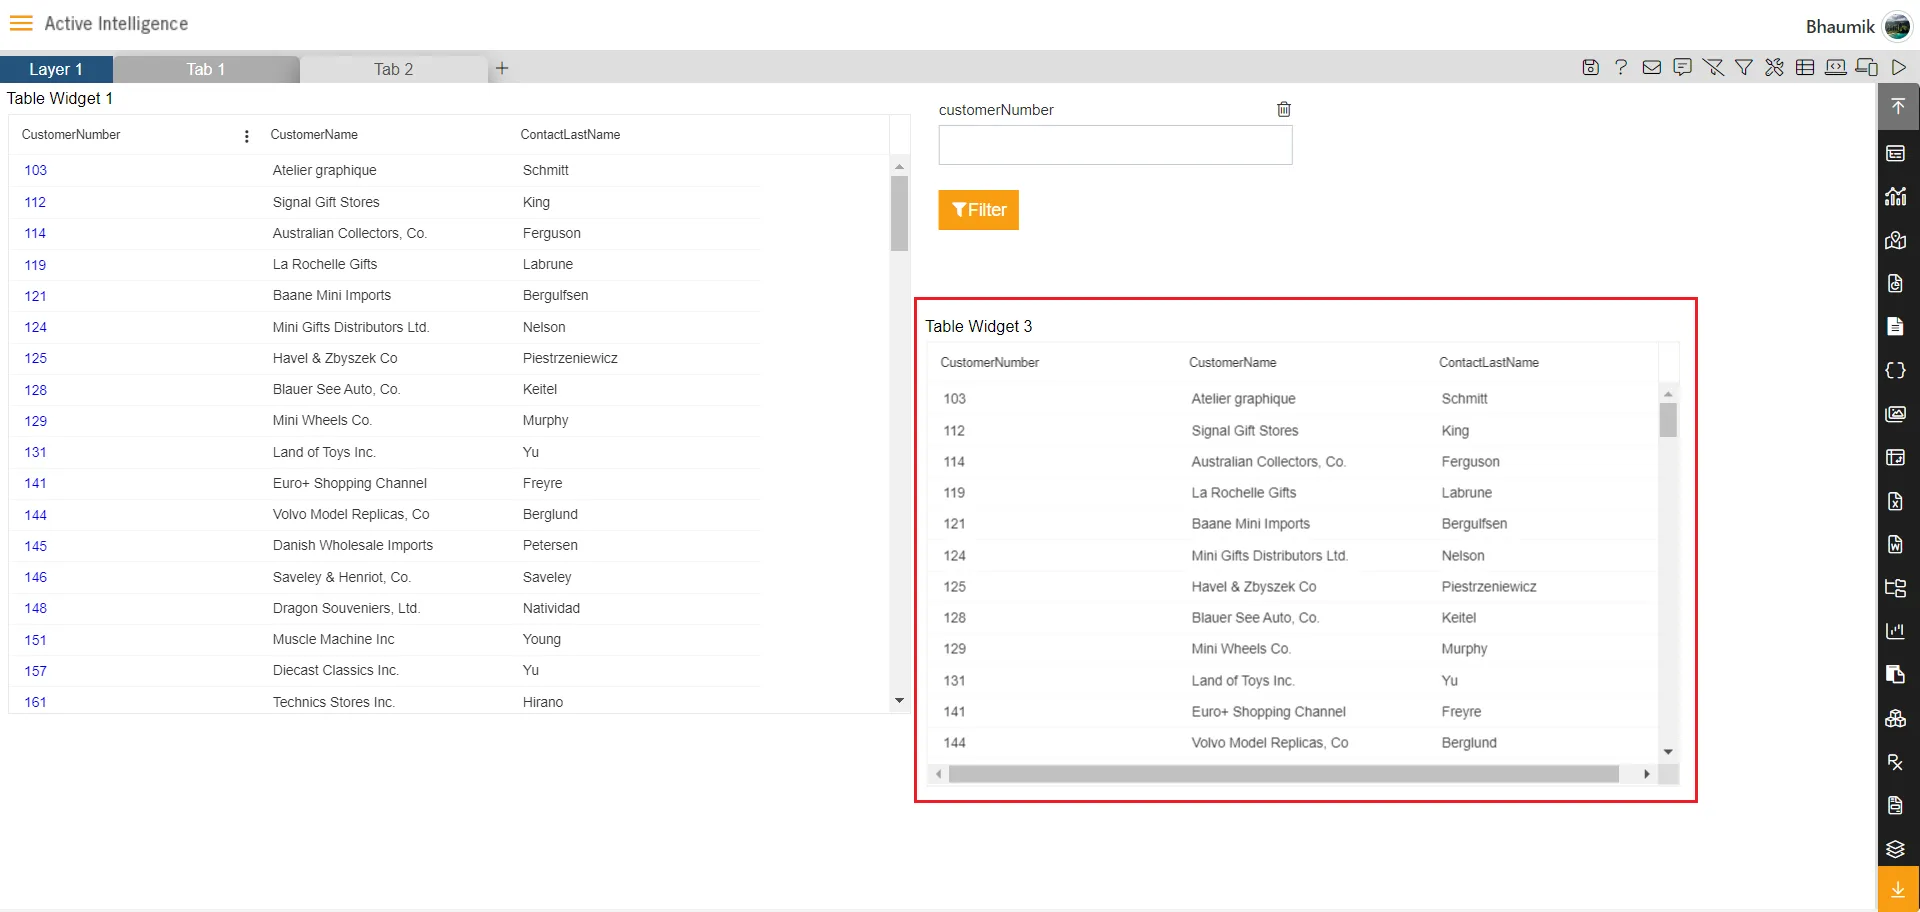
-
Now we need to create an external embed link of the report to open the report in Embed mode. go to the report section and find where you have uploaded Customers details.reptdesign.
-
Select this report and right-click on the report and select Embed option. you will see Bind parameter window. provide a default parameter value here.
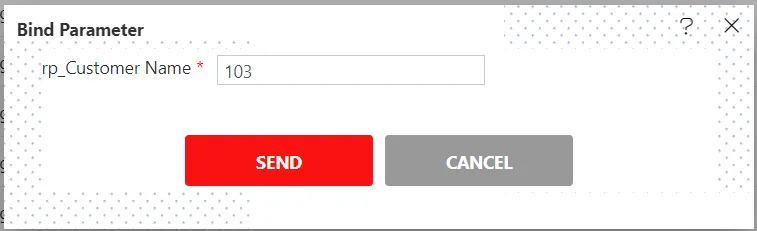
-
Click on Send button to generate embed link
-
In embed dialog box uncheck Bypass checkbox and click on generate button to generate external embed link
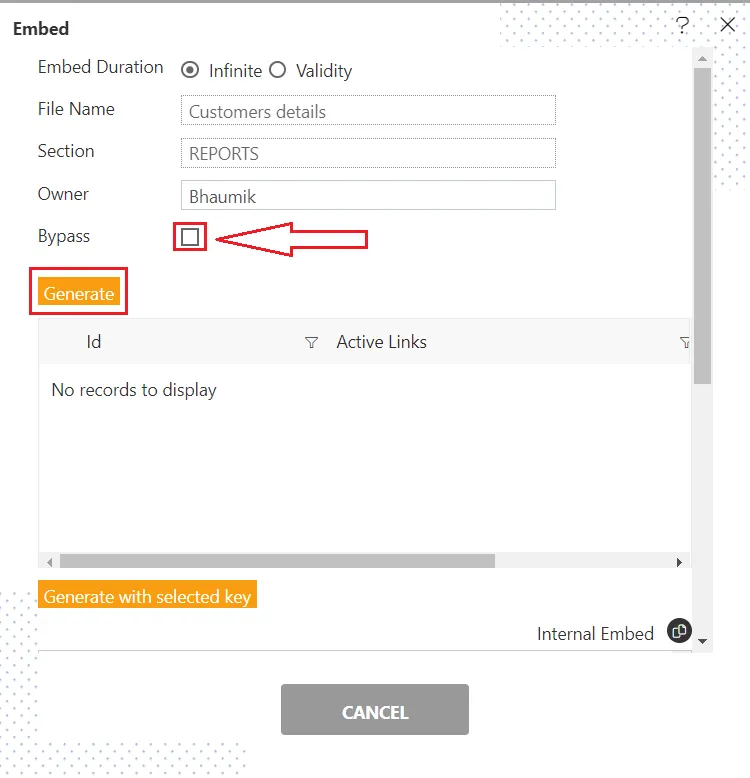
- Scroll down and copy the external embed link. external embed link will look like the below script;
https://localhost:8080/aiv/embed/external/4942597769655045554f784e39447a32574957643848715030624b79586e394f6b76574d392532467959487938253344/a_u__Admin&a_p__&a_t__&a_d__Default&a_ex__&a_af__false/rp_Customer Name___103-
Before using this embed link, provide a valid password for authentication. find &a_p__ attribute in this link and provide a password after this attribute. for example &a_p__password
-
Now take this updated link and go to the dashboard where we have created the 2nd table widget and edit the table widget.
-
Click on the custom column option of this table and you will see a screen like the below,

- Click on add new and provide the following details,
**Name:**customerNumber
**Display Name:**customerNumber
**All Column:**customerNumber
**Condition:**None
- Click on Expression builder and add the below script;
<a  href="javascript:void(0)" onclick='var tab = new CustomEvent("aiv-redirect-aiv", { "detail": ""});
window.dispatchEvent(tab);'>{{customerNumber}}</a>- In this script, at detail attribute
{ "detail": ""}you need to provide a report external embed link you have created and modified in the erlier stage. just like below,
<a  href="javascript:void(0)" onclick='var tab = new CustomEvent("aiv-redirect-aiv", { "detail": "https://training.aivhub.com:8443/aiv/embed/external/4942597769655045554f784e39447a32574957643848715030624b79586e394f6b76574d392532467959487938253344/a_u__Admin&a_p__password&a_t__&a_d__Default&a_af__false/rp_Customer Name___103"});
window.dispatchEvent(tab);'>{{customerNumber}}</a>-
Click on the save button to save the script.
-
Click on ADD button to add this column to the table.
-
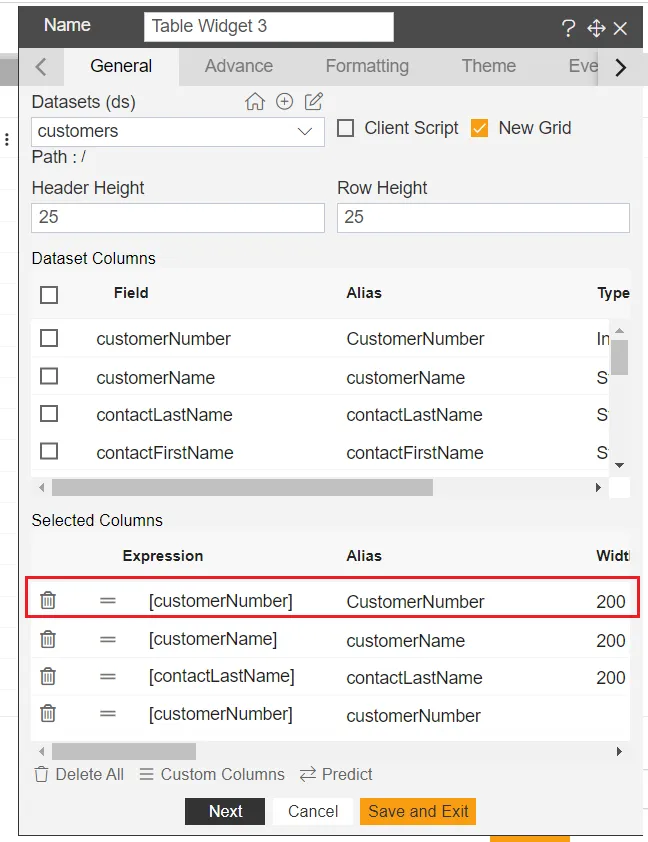
Delete one customerNumber column from the top to avoid duplicate columns. Click on the save and exit button to save the changes. you will see a screen like the below,
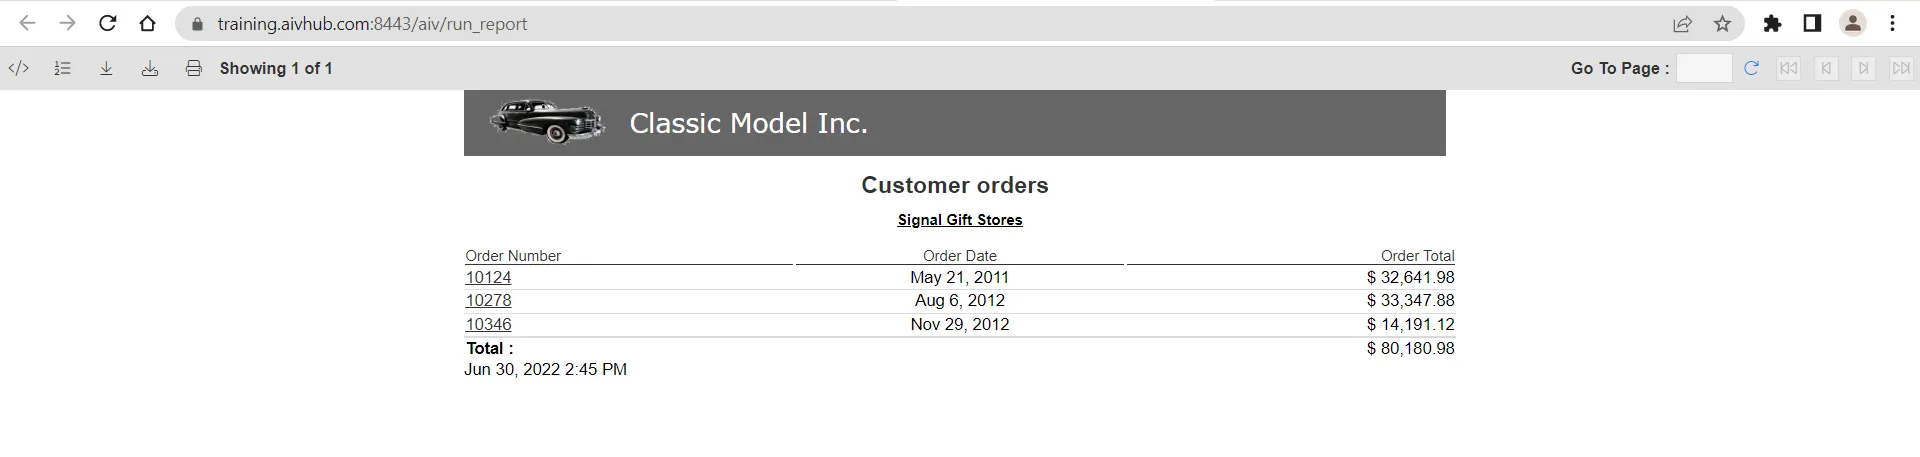
- Go to dashboard preview mode and click on any customer number. once you click on the customer number, it will open an embed report in a new tab filtered with clicked data.
This way users can use events in the table to open detailed data in the report widget and filter report data with clicked values.