Gantt Chart widget
Introduction
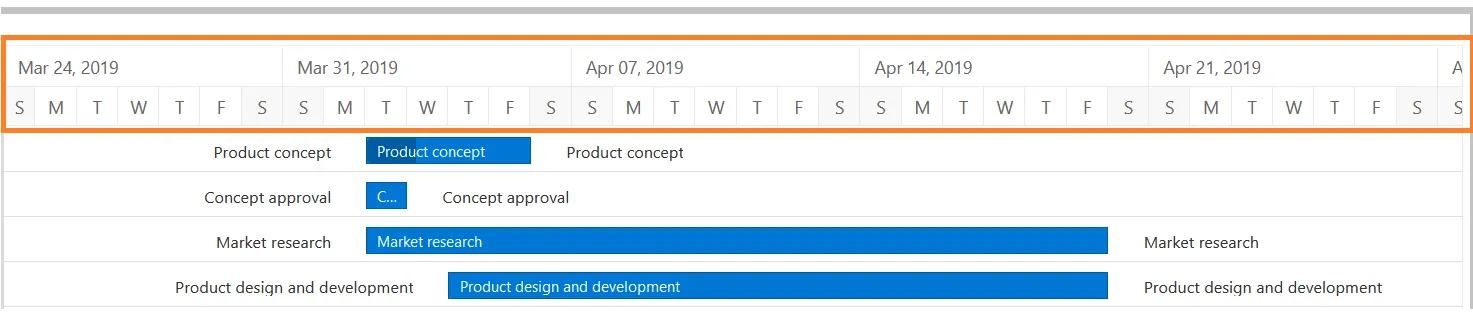
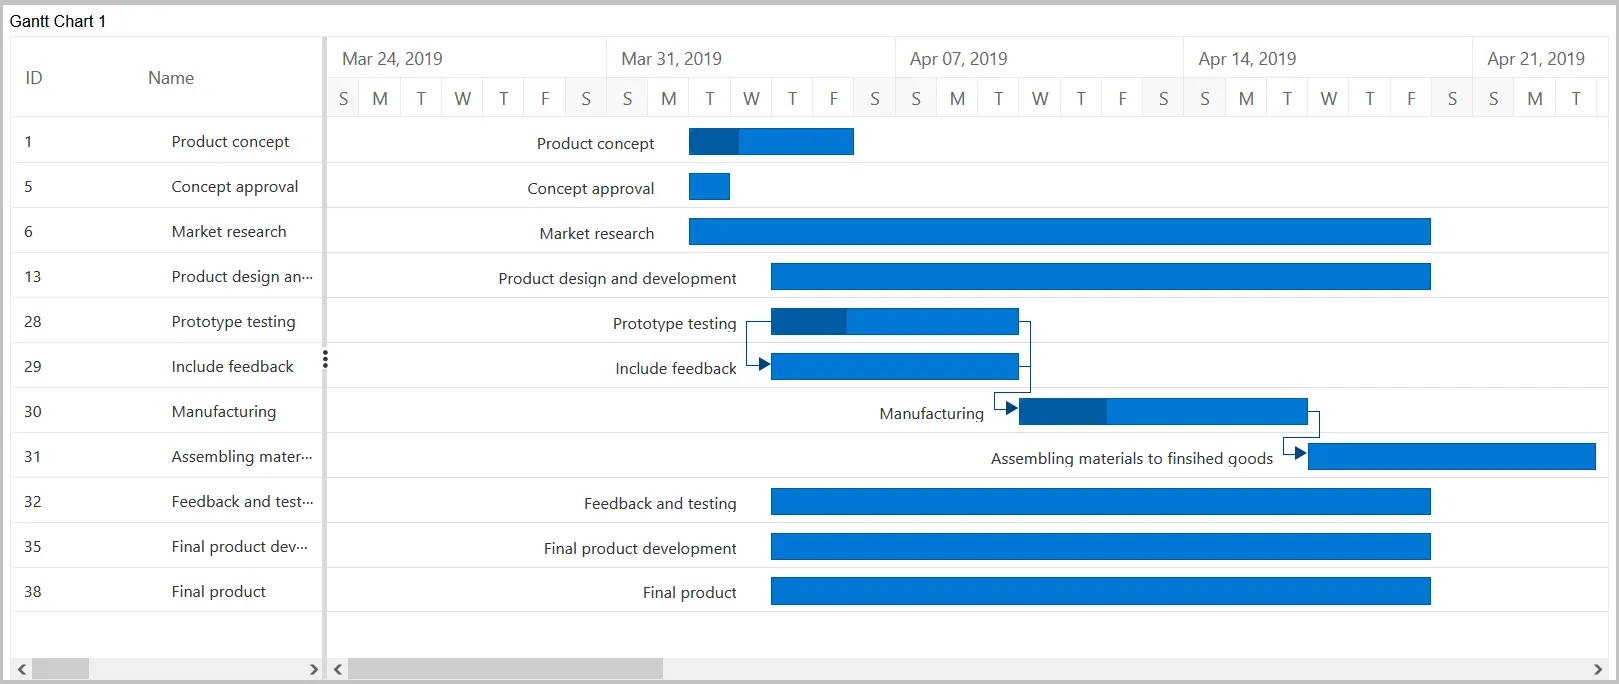
A Gantt chart, commonly used in project management, is one of the most popular and useful ways of displaying activities (tasks or events) against time. On the left side of the chart is a list of the activities, and along the top is a suitable time scale. Each activity is represented by a bar, with the position and length of the bar reflecting the start date, duration, and end date of the activity.
The Gantt chart is a project management tool that provides a Microsoft Project-like interface for scheduling and managing projects. Its intuitive user interface allows you to visually manage tasks, task relationships, and resources in a project.
What is a Gantt Chart Used for in Project Management?
In project management, Gantt charts are used for planning and scheduling projects. A Gantt chart is incredibly useful because it simplifies complex projects into an easy-to-follow plan and tracks the status of tasks as work progresses. Gantt charts also help you keep track of project deadlines, milestones, and hours worked, enabling you to spot and address delays or overages before they disrupt your project.
Who Uses Gantt Charts?
Gantt charts are used by project managers, business owners, team leaders, and executives in many different industries across various departments. Here are just a few types of companies and teams that use Gantt charts to plan, schedule, and execute their projects:
- Construction
- Consulting agencies
- Marketing teams
- Design and creative
- Manufacturing
- Human resources
- Software development
- Event planning
When Should You Use a Gantt Chart?
A Gantt chart is useful when your project requires more planning than a basic to-do list. Here are a few signs you need a Gantt chart to get the job done:
- Your project has a hard deadline.
- Multiple people or teams are involved in the project and need to be coordinated.
- A boss, client, or team member wants to see a visual timeline of the project from beginning to end.
- Your project involves some complexity, such as tasks that need to be completed in a specific order.
- Team members work on multiple projects simultaneously, and you need to manage their workloads.
- You have a good idea of how long each task should or can take.
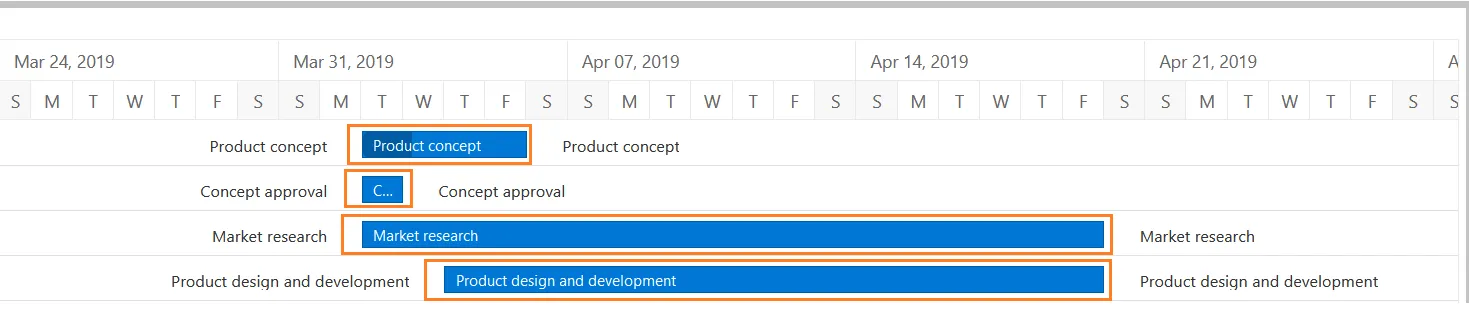
What Are the Components of a Gantt Chart?
Every Gantt chart includes the following basic parts:
-
Timeline: Runs horizontally across the top of the Gantt chart and shows months, weeks, days, and years.
-
Dateline: A vertical line that highlights the current date on the Gantt chart.
-
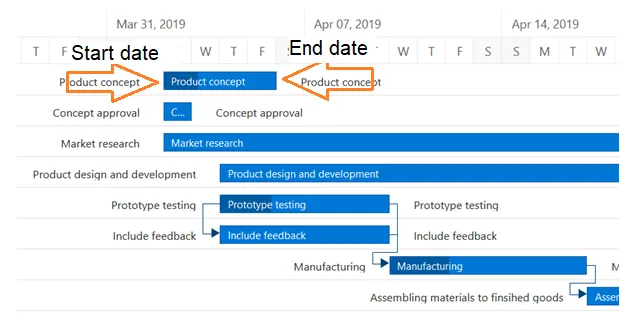
Bars: Horizontal markers on the right side of the Gantt chart that represent tasks and show progress, duration, and start and end dates.
-
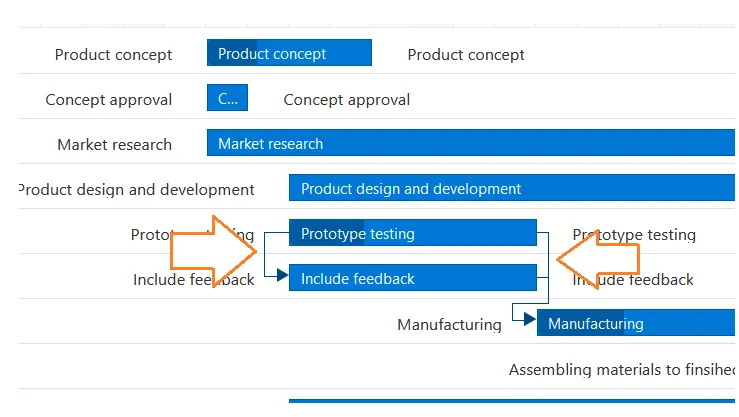
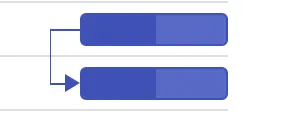
Dependencies: Blue lines that connect tasks that need to happen in a certain order.
-
Progress: Shows how far along work is and may be indicated by percentage complete and/or bar shading.
-
Task Title: The title of the task appears on the bars.
-
Task Duration: The duration of the task appears as the size of the taskbar.
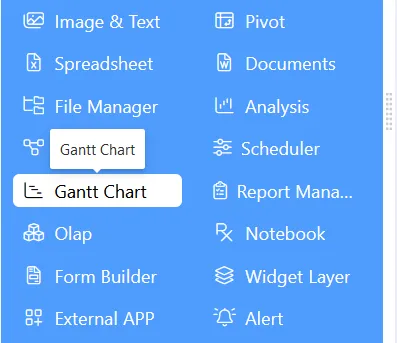
Steps to Add the Gantt Chart to the Dashboard
- Click on the Gantt chart icon from the left-vertical menu bar, as shown in the figure below:
- The Gantt chart edit menu looks like the figure below:
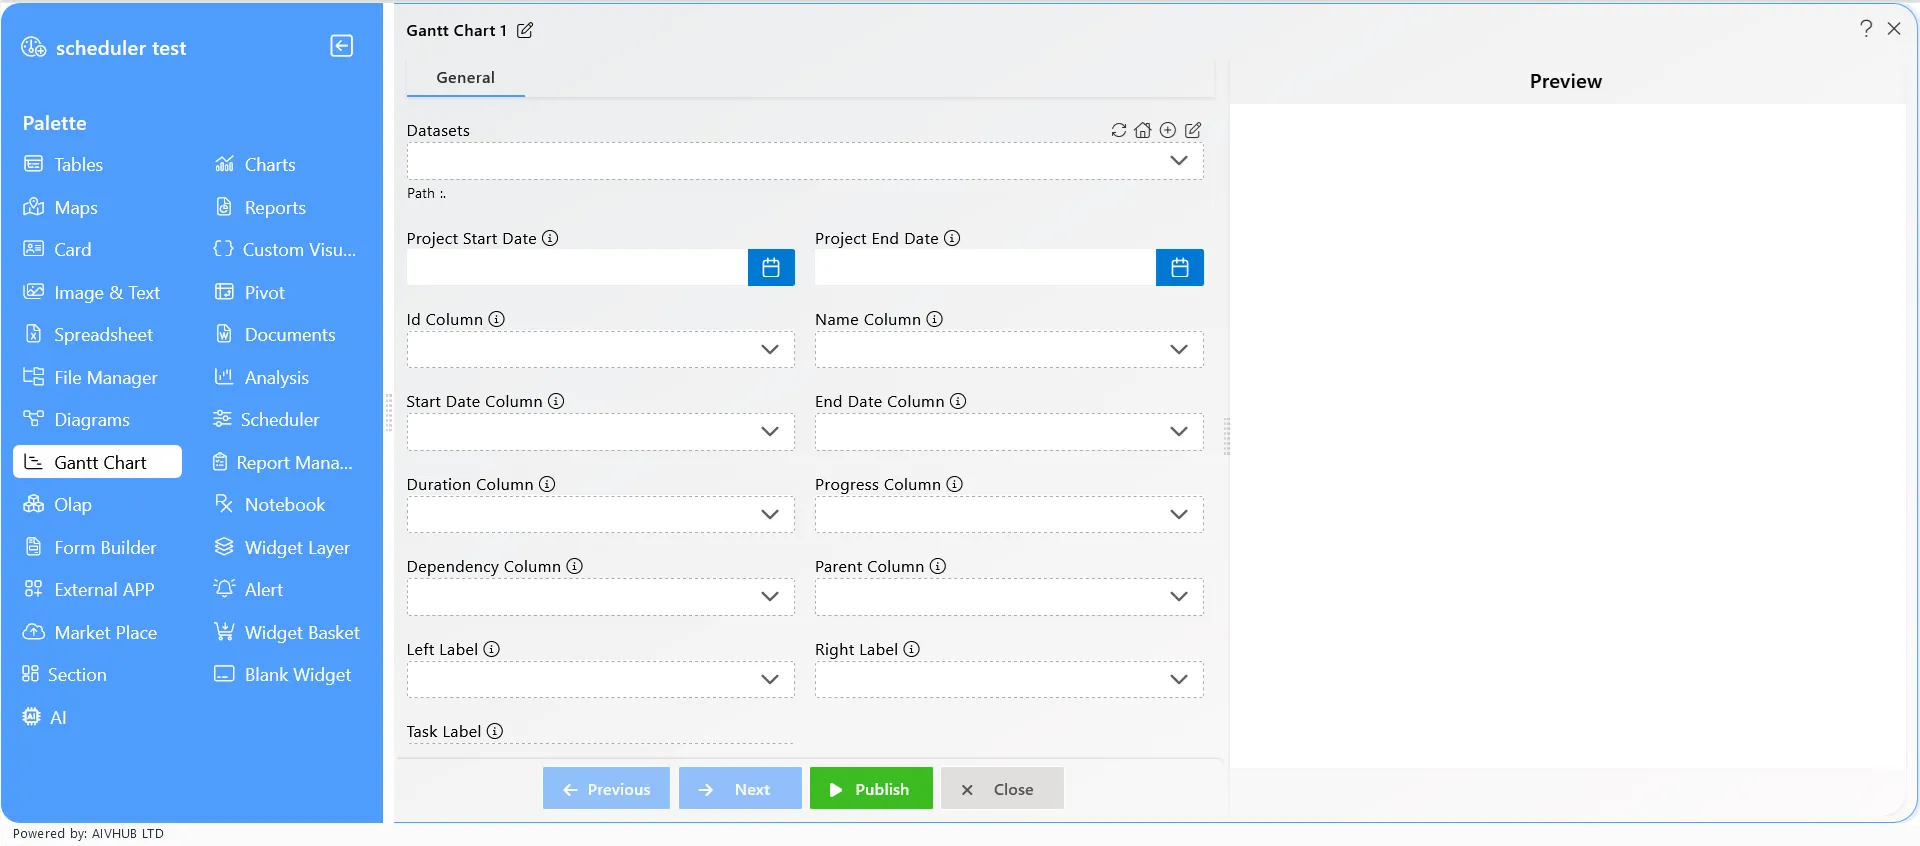
-
By selecting the dataset, the user can add events/tasks to the Gantt chart.
-
The data must contain properties like Project start date, End date, Id column, Name column, Start date column, End date column, Duration column, Progress column, Dependency column, Parent column, Left label, Right label, Task label.
-
After selecting the data, click on the “Save and Exit” button to save the Gantt chart widget.
Features of Gantt Chart
-
Dataset: Users need to add the dataset to see the tasks and their timeline on the Gantt chart. The data columns should include Project start date, End date, Id column, Name column, Start date column, End date column, Duration column, Progress column, Dependency column, Parent column, Left label, Right label, Task label.
-
Project Start Date: Users must select the project start date, which indicates the start of the Gantt chart. The user should keep the start date as per the dataset.
-
Project End Date: Users must select the project end date, which indicates the end of the Gantt chart. The user should keep the end date as per the dataset.
-
Id Column: The ID of the data value rows. Users can define infinite IDs, and each ID should be a unique number.
-
Name Column: The name column defines the title of the project and should contain only characters.
-
Start Date Column: The starting date of the project should be in the format
dd:mm:yyyy. It appears on the chart when the project starts. -
End Date Column: The ending date of the project should be in the format
dd:mm:yyyy. It appears on the chart when the project is finished. -
Duration Column: The duration defines the lifespan of the project and must be numeric (e.g., 2 days, 6 days, 30 days).
-
Progress Column: The progress shows the completion of the project by indicating its progress.
-
Dependency Column: Dependencies are any tasks or activities that are either dependent on the previous completion of a task or on which a task is dependent. It is a simple relationship between two or more tasks in a project. Whenever there’s a project, expect a dependency.
-
Parent Column: In a Gantt chart, each task relies on other tasks. Here, it needs to add the parent task ID over any of the tasks. The task ID helps to place the parent task in the Gantt chart.
-
Left Label & Right Label: The labels indicate the label position on the task’s left and right sides in the Gantt chart.
-
Task Label: This label indicates the main title label, which appears on the task bar in the Gantt chart.
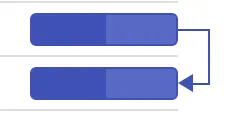
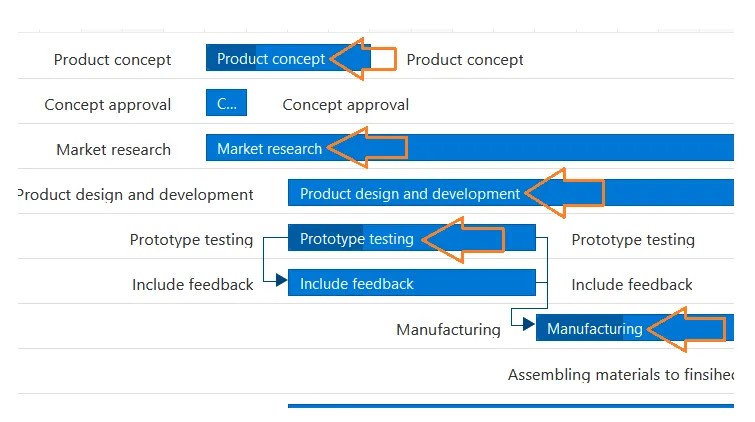
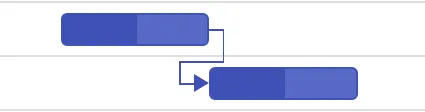
Understanding Task Dependency in Gantt Charts
Task dependency or task relationship can be established between two tasks in Gantt. This dependency affects the project schedule. If you change the predecessor of a task, it will affect the successor task, which will affect the next task, and so on. Relationships can be established between parent-parent tasks, child-child tasks, parent-child tasks, and child-parent tasks.
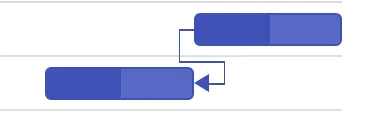
Task Relationship Types
Task relationships are categorized into four types based on the start and finish dates of the task:
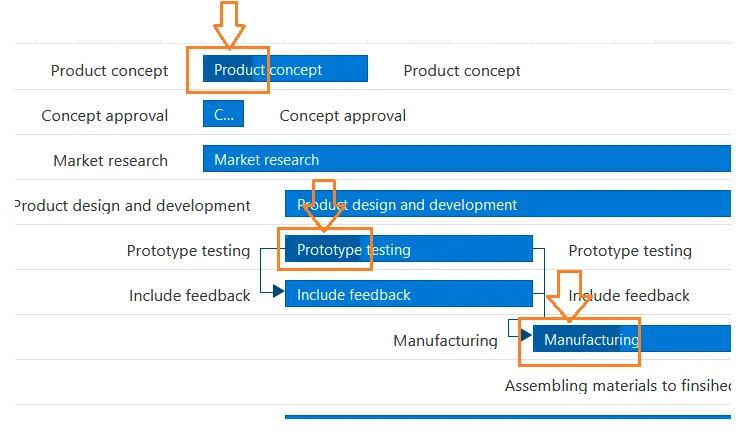
-
Start to Start (SS): You cannot start a task until the dependent task also starts.
-
Start to Finish (SF): You cannot finish a task until the dependent task is started.
-
Finish to Start (FS): You cannot start a task until the dependent task is completed.
-
Finish to Finish (FF): You cannot finish a task until the dependent task is completed.