Dynamic Linking
Dynamic Linking:
This video contains how to dynamically link widgets in AIV.AIV application allows its users to dynamically link widgets that are present across different layers and tabs.
For instance, if a table and chart are linked dynamically, then on the click of any cell in the table, detail of that particular cell will be displayed in the chart.
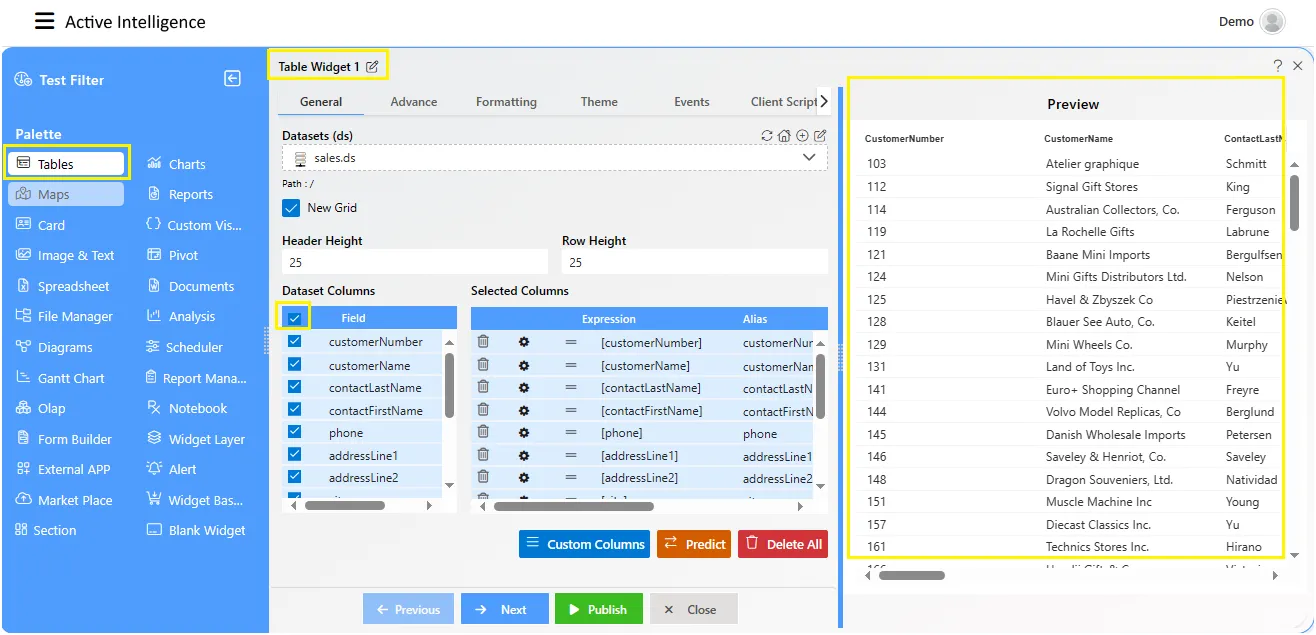
In this example, we will dynamically link table widget displaying sales of products in first layer with the pie chart depicting the percentage of sale of products based on line of products in the second layer which we had created in the previous chapter.
In order to learn how to create multiple layers, visit the previous chapter by clicking on ← Previous button.
In order to dynamically link widgets across different layers follow the steps below:-
- As seen in the previous session, our first layer contains a table widget shown in the figure below:-
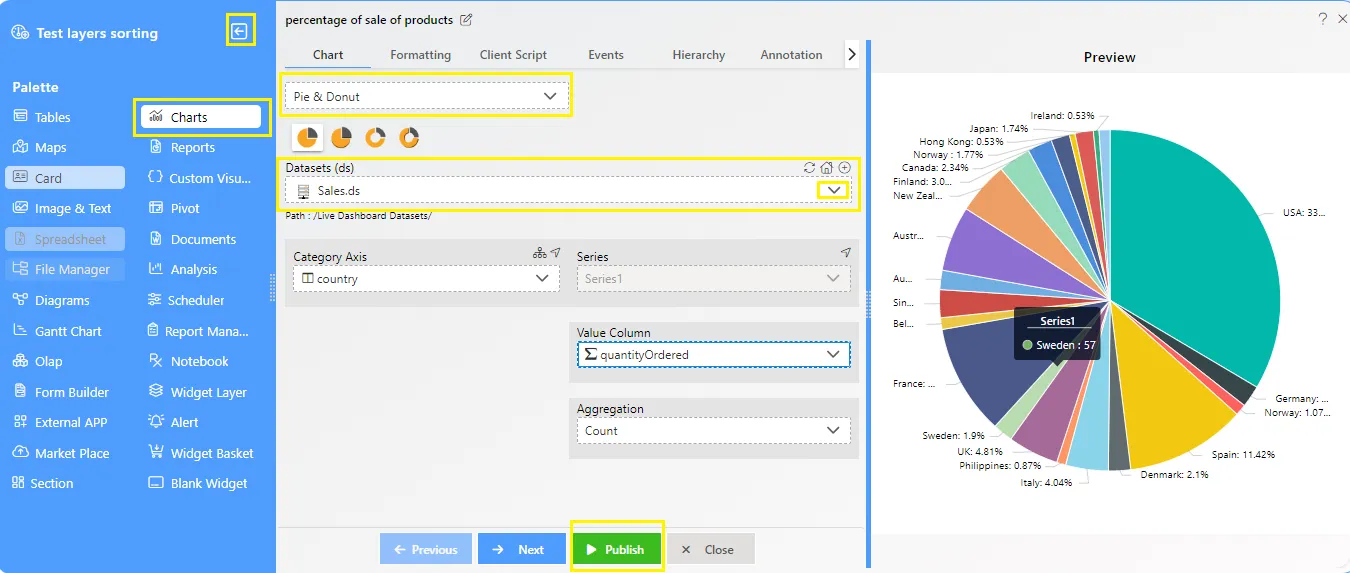
- Similarly, we had created the following pie chart displaying line of products in the second layer.
-
Now we will create a dynamic link between the table in the first layer and pie chart in the second layer as follows:-
-
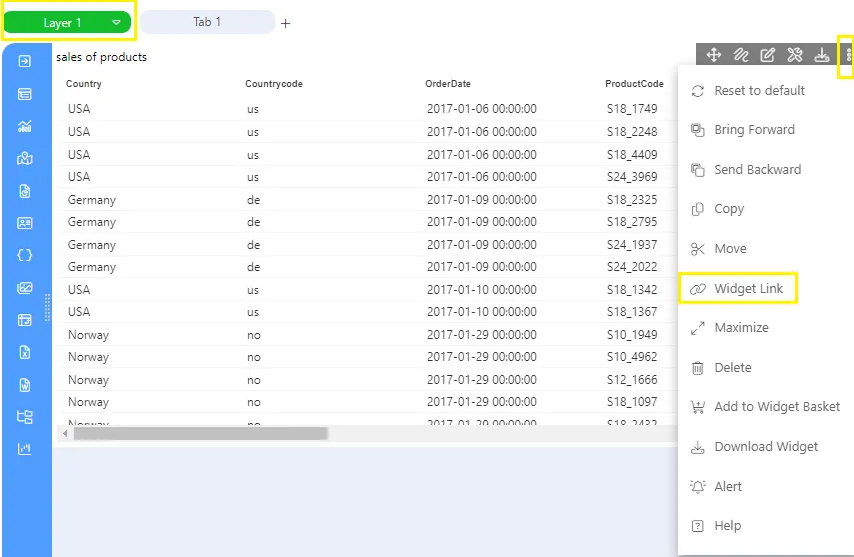
Click on the side ellipsis in your table widget which displays sales of products in the first layer.
-
This will open the following menu:-
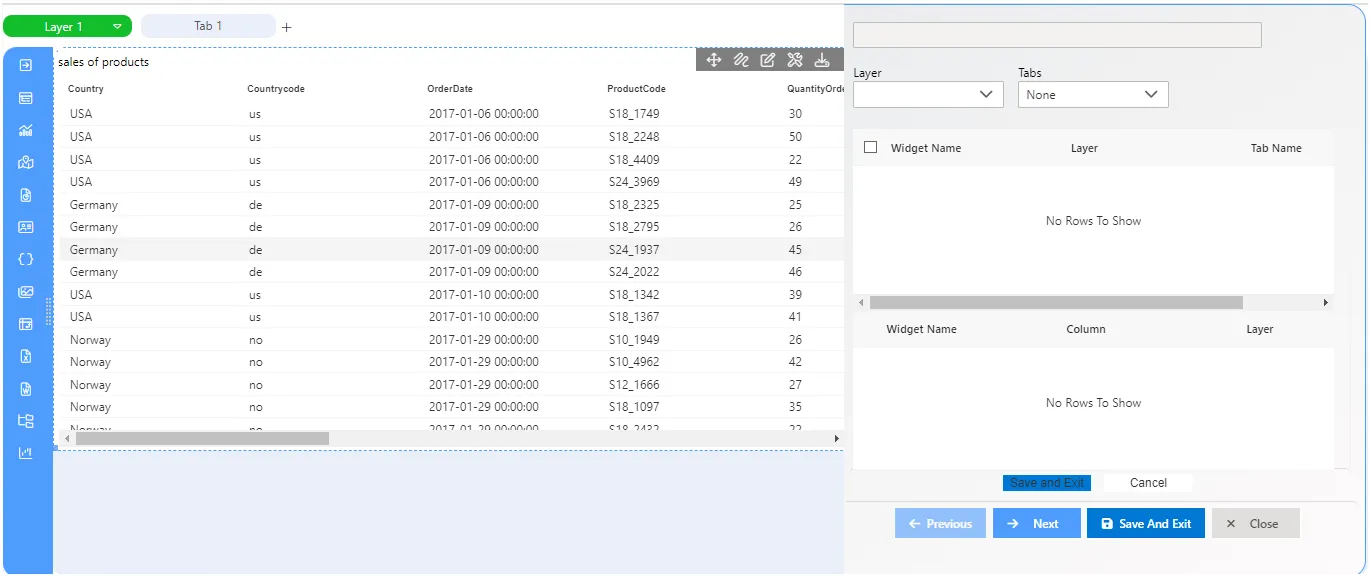
- Click on Dynamic Link and following configuration box will be opened.
-
Select productLine in Linked Column, Layer as layer2 and Tab as tab1 from the dropdown menu.
-
Check the Line of Products checkbox and select productLine column from dropdown as follows:-
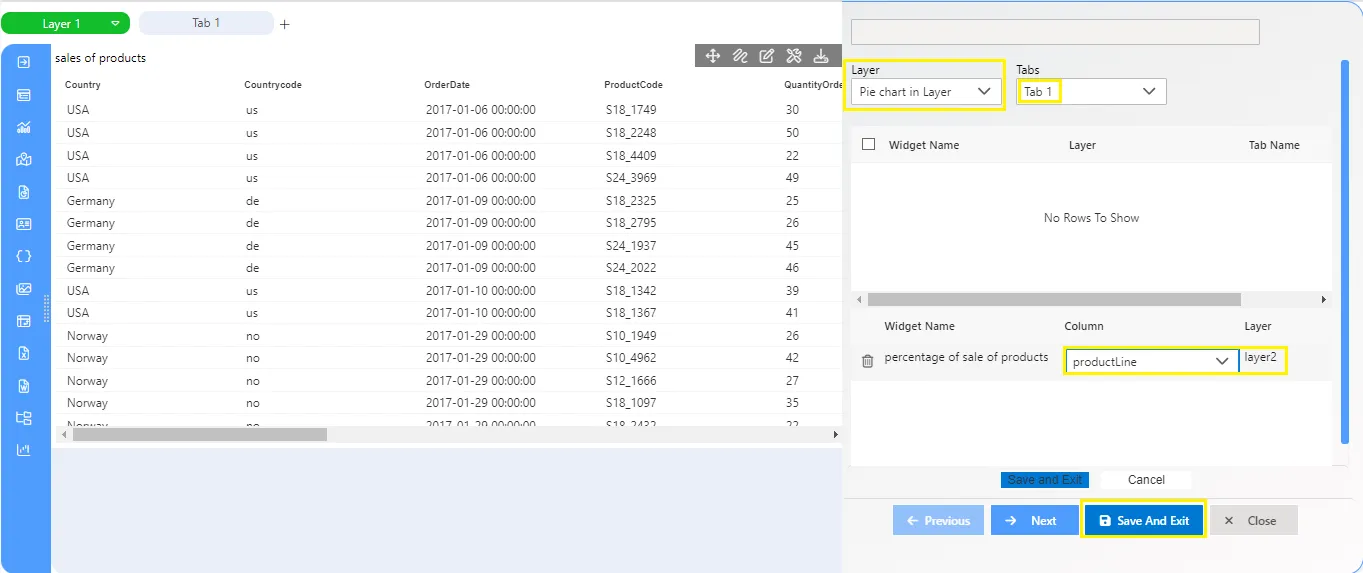
-
Finally, click on the to apply the dynamic link on productLine.
-
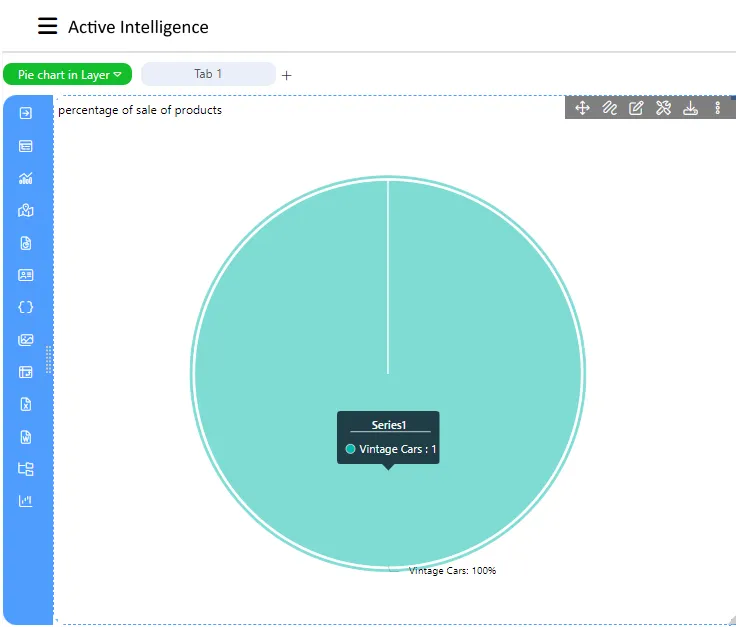
Now if the user clicks on any productLine, say Vintage Cars in the first layer, the pie chart in the second layer will display data only for that particular line of products.
-
You can check the output by going to layer two by clicking on the topmost icon which will open a dropdown as follows:-
-
The chart in the second layer will be displayed as above:-
-
As the user had clicked on vintage cars, the chart displays data related to that product line only.