Filter Data
AIV application allows its users to apply filters on widgets that are present across different layers and tabs.
Filter Data: This video contains how to Filter Data in AIV.
Filtering Data Across Layers
In this example, we will apply a filter to the table widget that displays product sales in the first layer and to the pie chart that shows the percentage of sales based on the product line in the second layer, which we created in the previous chapter. For more details about filters, please refer to the Filters section of the training manuals. To learn how to create multiple layers, you can visit the previous chapter by clicking on “Create Layers” in this section.
To apply filters to widgets across different layers, follow these steps:
-
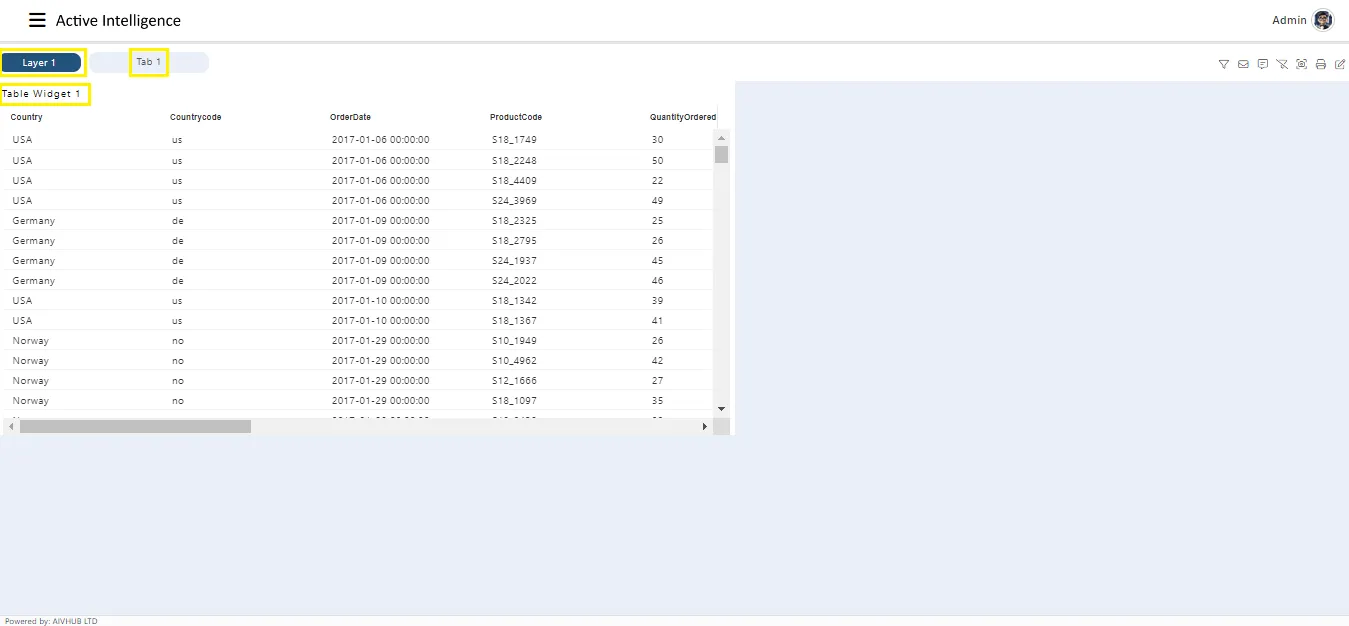
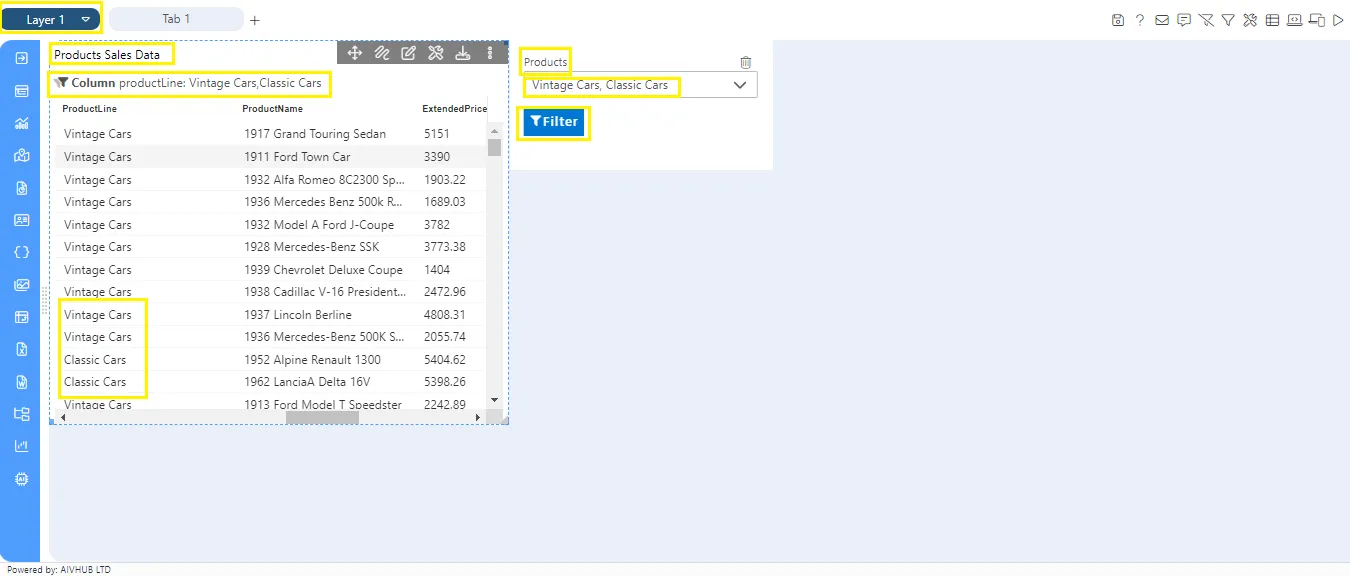
As shown in the previous session, the first layer contains a table widget, as illustrated in the figure below:
-
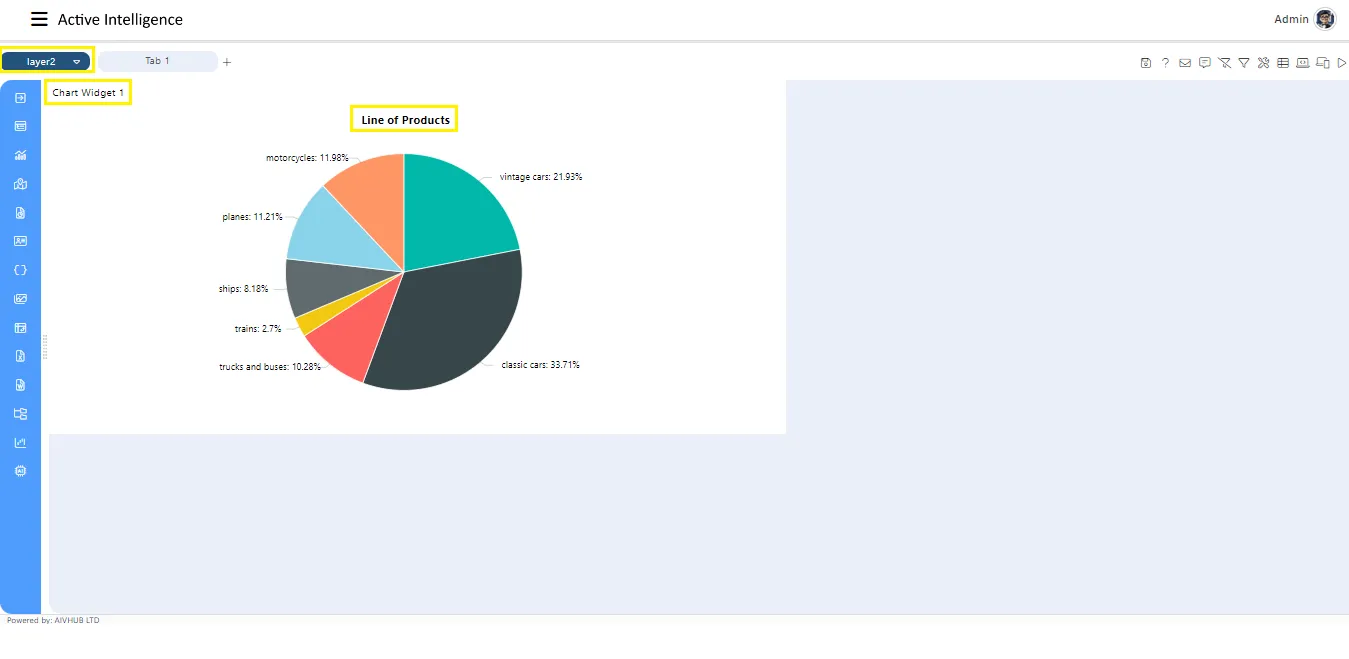
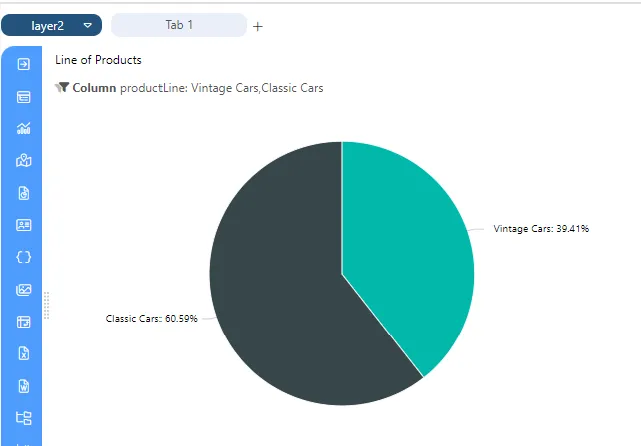
Similarly, the following pie chart was created in the second layer to display the product lines:
-
Now, we will apply filters to the table in the first layer and the pie chart in the second layer.
-
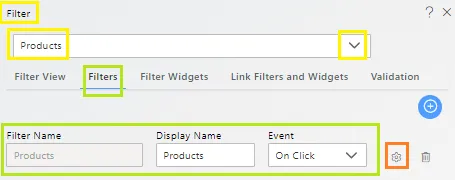
To do this, click on Component from the list of components in the dashboard. A configuration box will open as shown below:

-
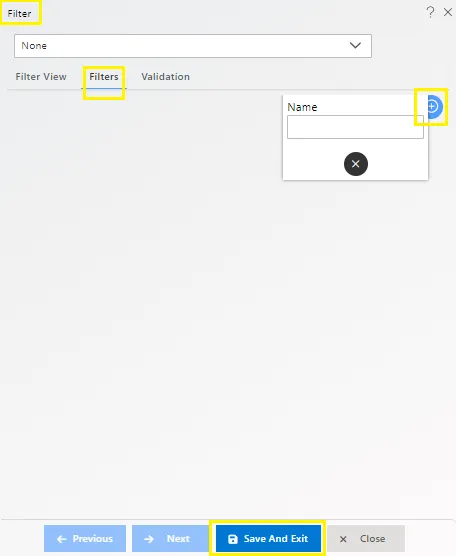
Go to the Filters tab, as shown in the figure above, and click to add a new filter. This tab displays all existing filters and allows the user to add new ones.
-
This action will open the following dialog box:
-
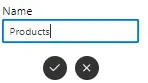
Here, we have created a filter named “Products” to filter the sales data based on the product line.
-
Click the Save button to save the filter. It will then appear under the Filters tab, as shown below:
-
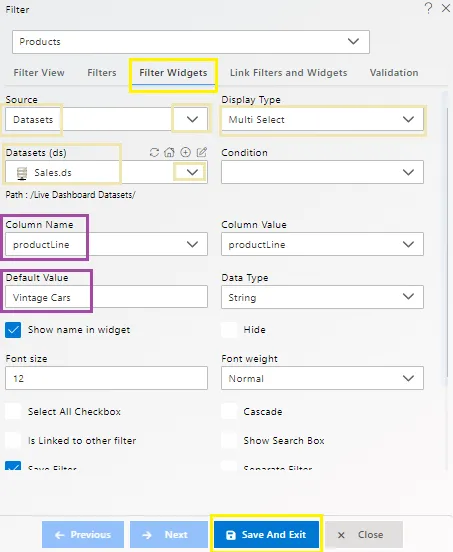
Now, go to the Filter Widgets tab to link the filter with the dataset:
-
For this example, select Display Type as Multi-Select from the dropdown menu, as shown in the figure above.
-
Select the
Sales.dsdataset from the Datasets dropdown menu. Then, select Column Name and Column Value asproductLinefrom the dropdown, and set the Default Value asVintage Cars, as shown in the figure below: -
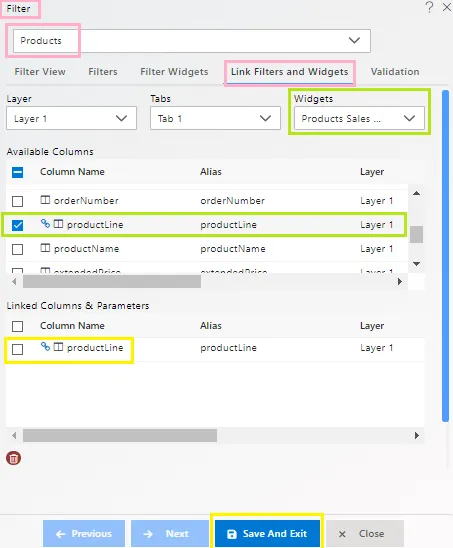
Finally, to link the filters to the widgets, go to the Link Filters and Widgets tab as follows:
-
As shown in the figure, select
layer1,tab1, andProduct Sales Datafrom the dropdown menu. -
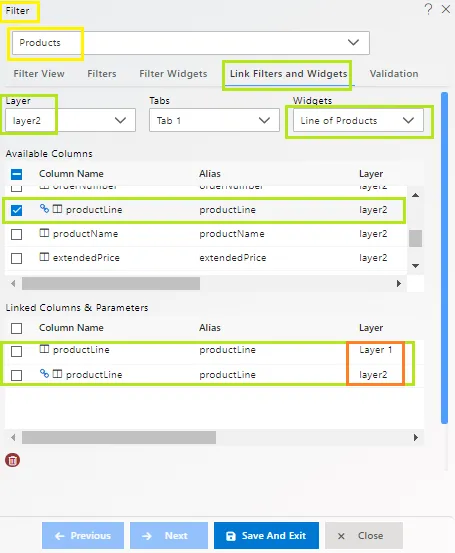
Similarly, apply the filter to the chart in the second layer as follows:
-
Finally, go to the Filter View to apply the filter, as shown below:
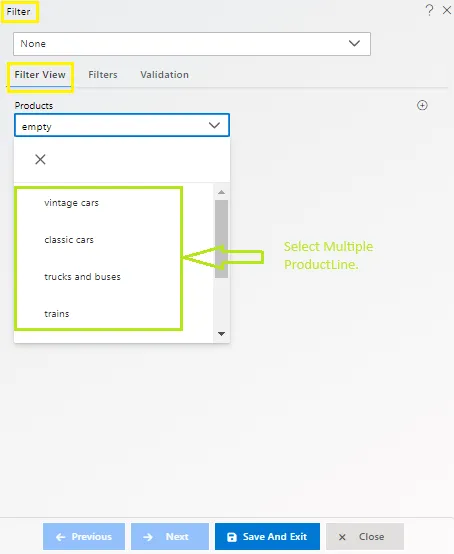
-
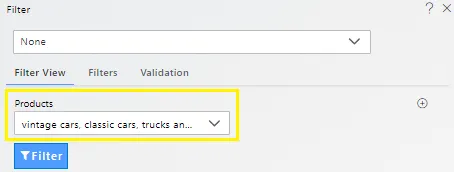
Click the button to filter the values for the selected countries, as shown below:
-
You can check the output by going to layer two by clicking on the topmost icon, which will open a dropdown menu as shown below:
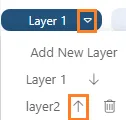
-
The chart in the second layer will be displayed as follows:
-
The user can also add a layer widget to check the changes reflected on both widgets simultaneously.
-
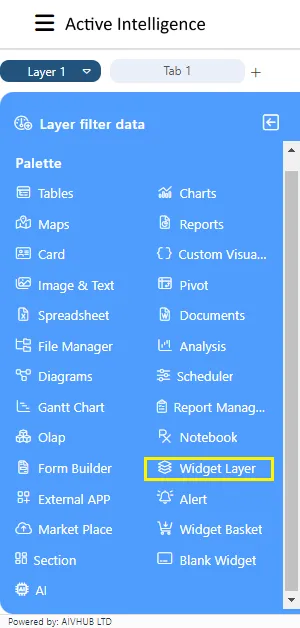
Click on the Component icon from the top-right corner menu; a list of available components will open as follows:
-
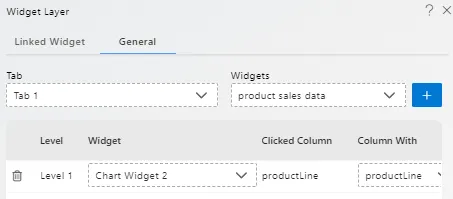
Click on Component from the list of components in the dashboard. A configuration box will open as follows:
-
Provide a name as shown in the figure and select Tab 1 from the dropdown menu.
-
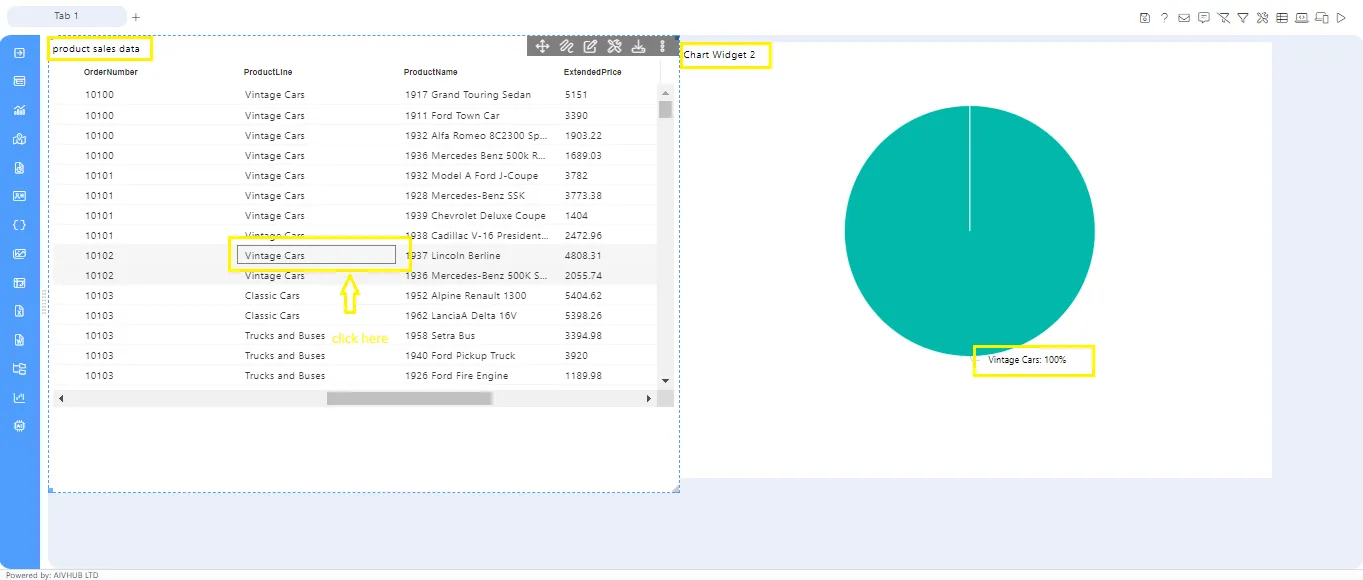
Now, the user can click on any cell in the table to see the changes reflected in the chart, or vice versa, as shown in the figure below:
-
Similarly, the user can dynamically link widgets across multiple tabs in different layers of the AIV dashboard.