Multi Layer Widget
-
Click on hamburger icon.

-
Click on the (+) icon from Visualization Tab.

-
The Create Dashboard Dialog Box will pop up on Screen Enter Dashboard Name as Shown in figure.

-
Click on Create after entering Dashboard Name in Dialog Box.
-
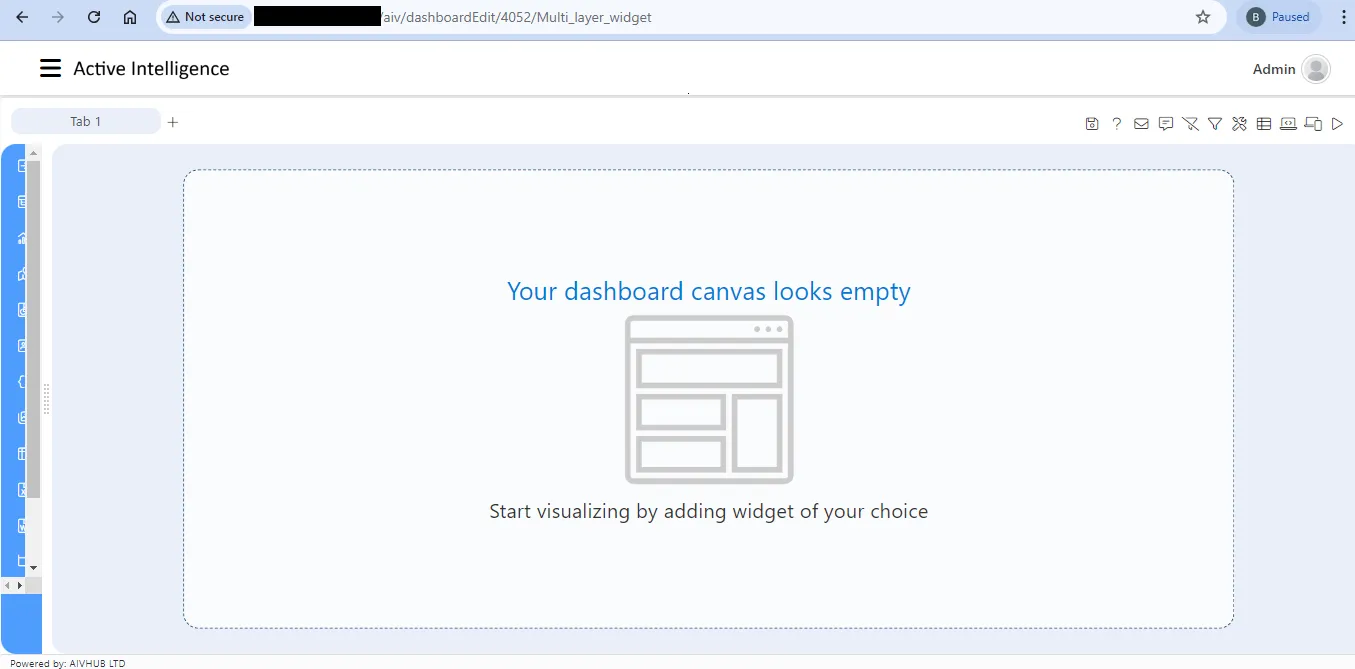
You will see an Empty Dashboard as Shown in Figure.
-
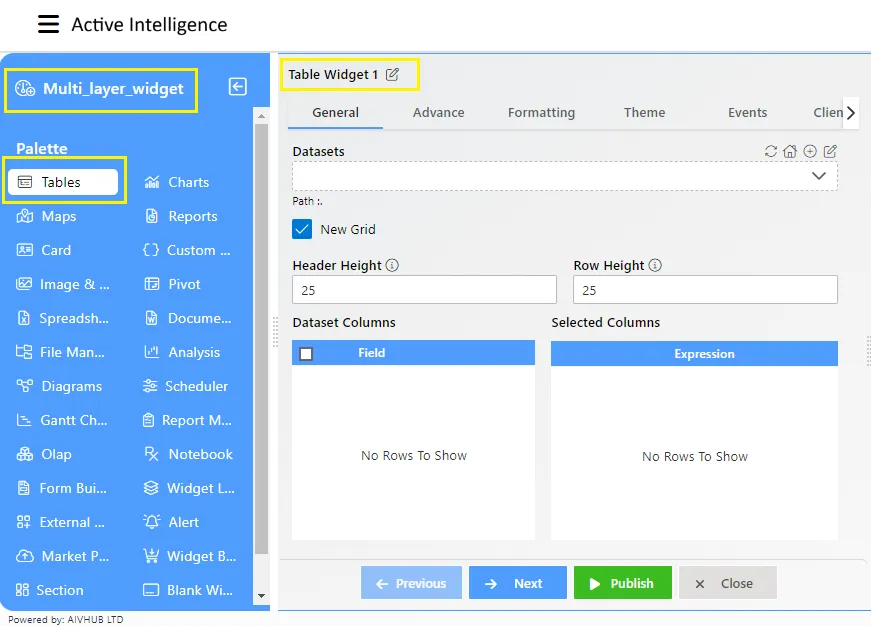
From the left Vertical Menu Select the Table Widget Icon.
-
The edit menu box appears as you click on Table Widget Icon And a widget gets added in content place automatically in dashboard, As shown in figure below:
-
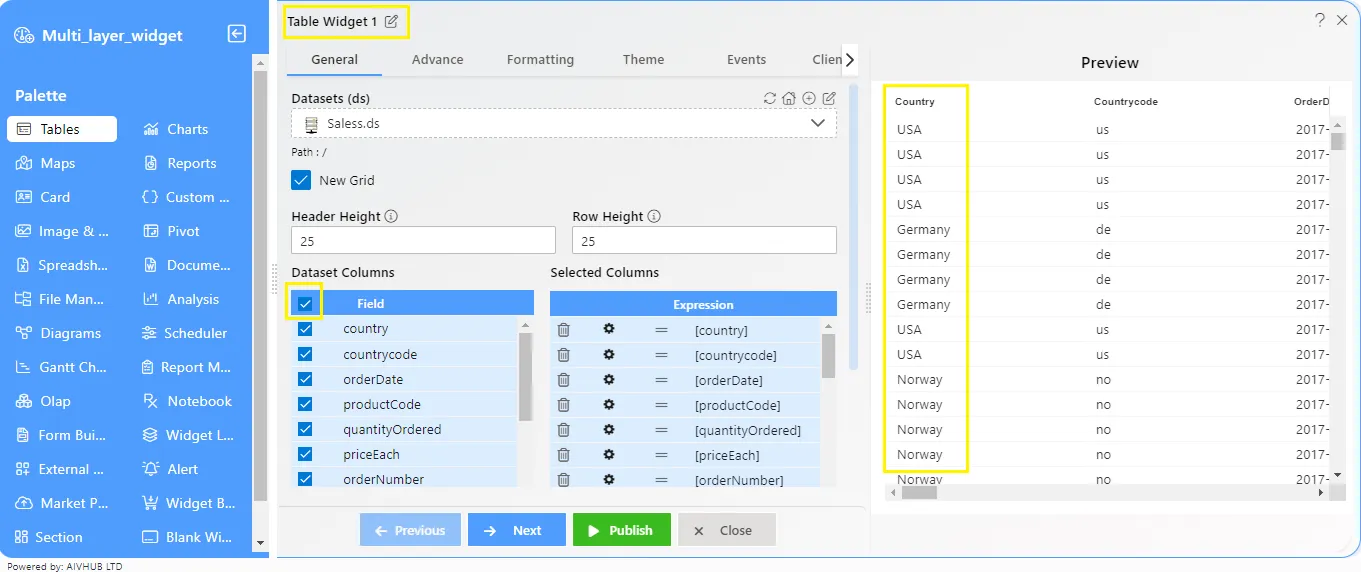
Enter Following details in General:
- Dataset: Saless.ds
- Header Height: 25
- Row Height: 25
-
In the Dataset Column Select All checkbox.
-
Fill above details in edit box as shown in figure below:
-
From the left Vertical Menu Select the Chart Widget icon.
-
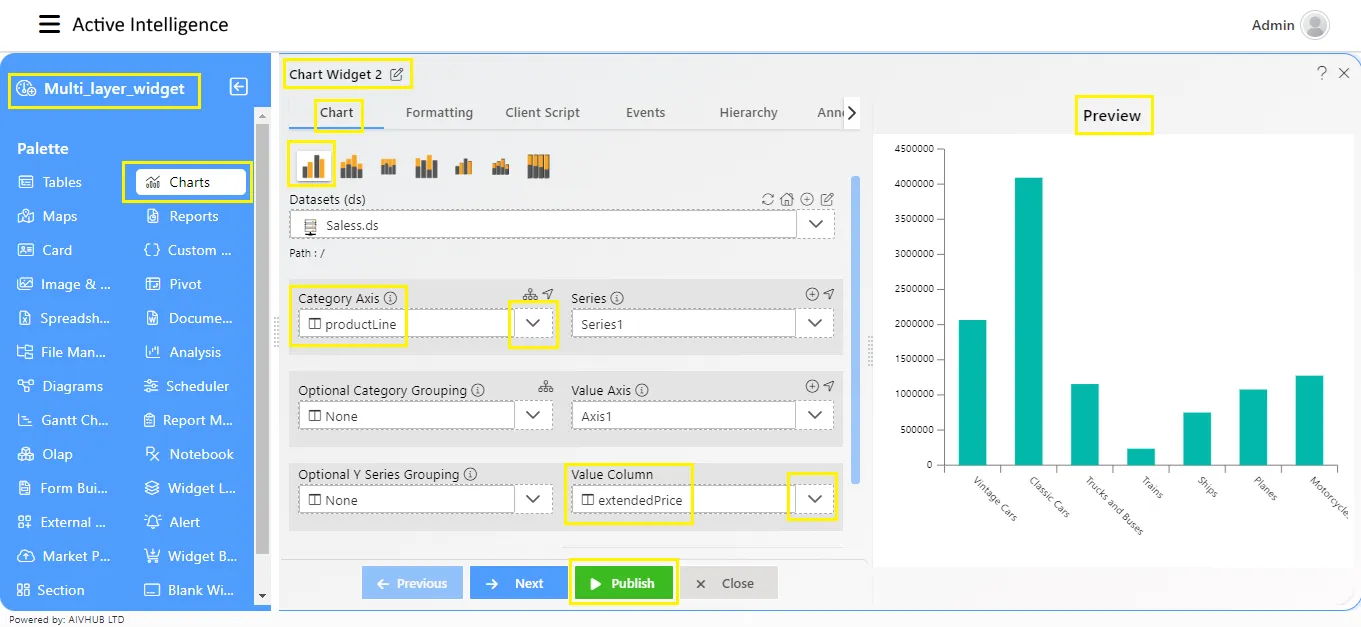
The edit menu box appears as you click on the Chart Widget icon and a widget gets added in the content place automatically in the dashboard.
-
Enter Following details in Chart Property:
- Dataset: saless.ds
- Category Axis: Product Line
- Value Column: extended price
- aggregation: Sum
-
Fill above details in edit box as shown in figure below:
-
Click on Publish and Save and Exit.
-
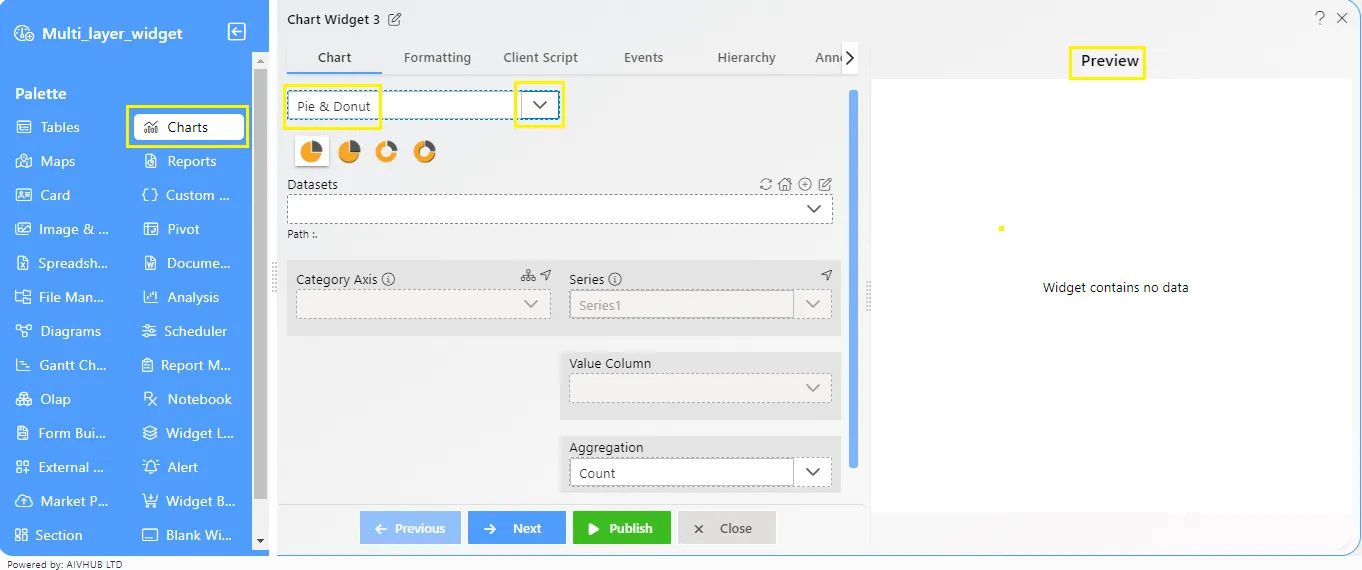
From the left Vertical Menu Select the Chart Widget Icon In that select the Pie and Donut Chart, As shown in figure below:
-
The edit menu box appears as you click on Chart Widget Icon And a widget gets added in the content place automatically in the dashboard.
-
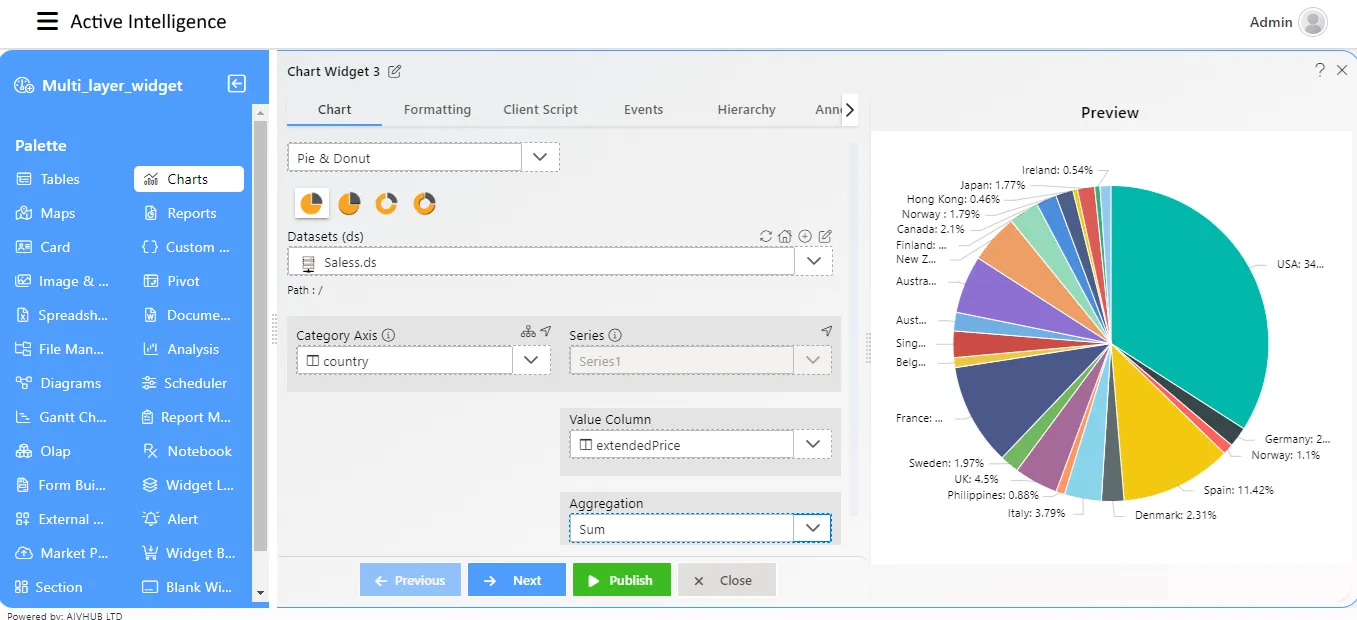
Enter Following details in Chart Property:
- Dataset: saless.ds
- Category Axis: Country
- Value Column: extendedprice
- aggregation: Sum
-
Fill above details in edit box as shown in figure below:
-
Click on Publish and Save and Exit.
-
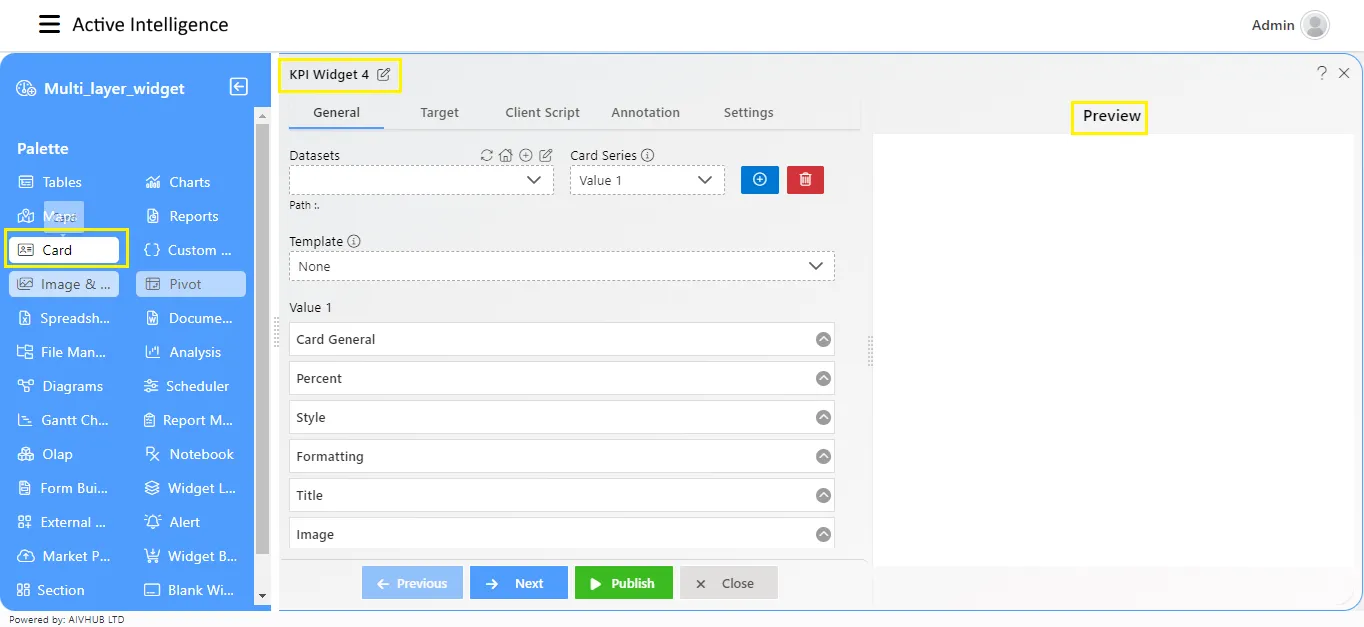
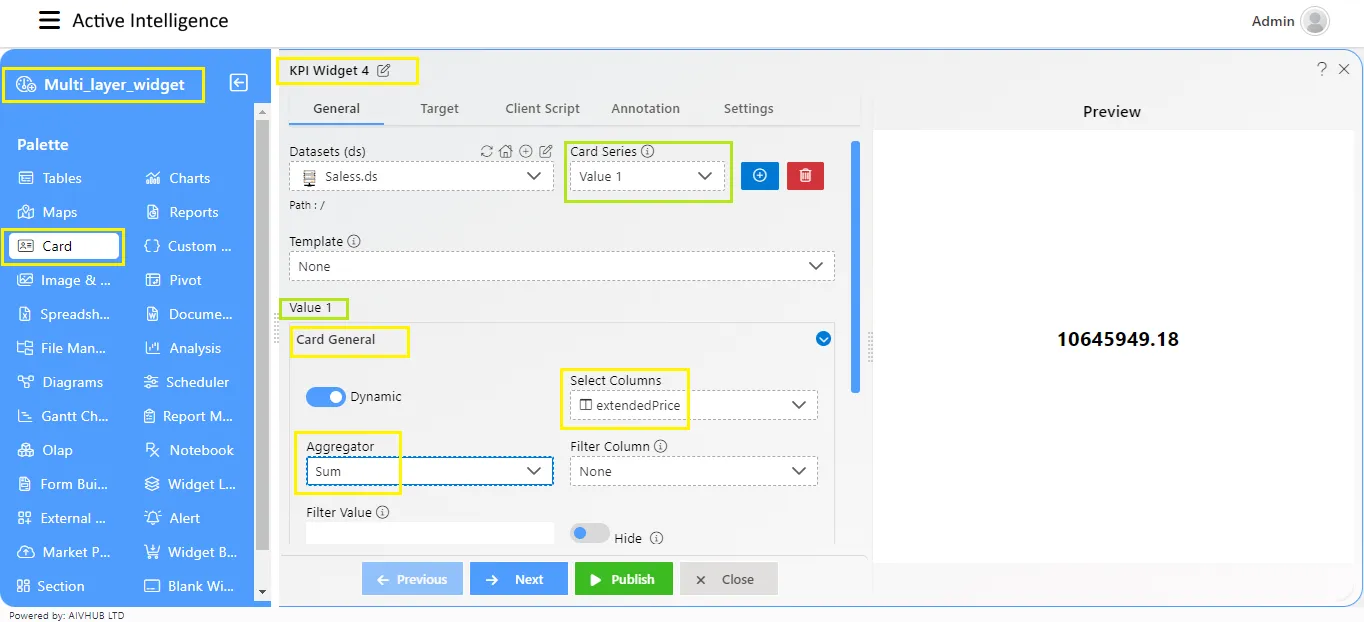
From the left Vertical Menu Select the Card Widget Icon, As shown in figure below:
-
The edit menu box appears as you click on Card Widget Icon And a widget gets added in the content place automatically in the dashboard.
-
Enter Following details in Chart Property:
- Dataset: saless.ds
- Category Axis: Country
- Selected Column: extendedprice
- aggregation: Sum
-
Fill above details in edit box as shown in figure below:
-
Click on Publish and Save and Exit.
-
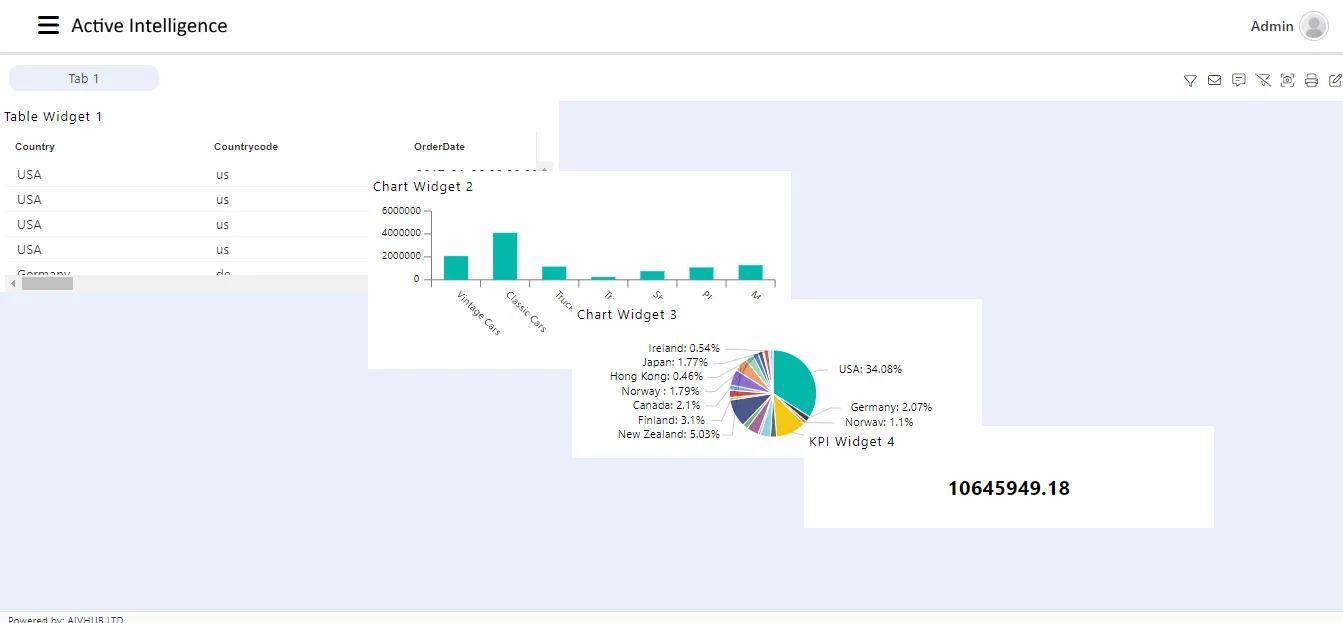
In Vertical ellipses select the Bring Forward and move the widgets.
-
Now match your chart with below example as shown in figure below: