Getting Started with Dashboards in AIV Application
This guide will help you get started with creating your first dashboard in the AIV application. You’ll learn how to create a dashboard, understand the different modes, and explore key features such as Edit Mode and Preview Mode.
Creating Your First Dashboard
-
Log in to the AIV Application: Open the AIV application in your browser and log in with your credentials. Go to Hamburger menu and click on the dashboard grid view as shown in the figure below:

-
Create a New Dashboard:
-
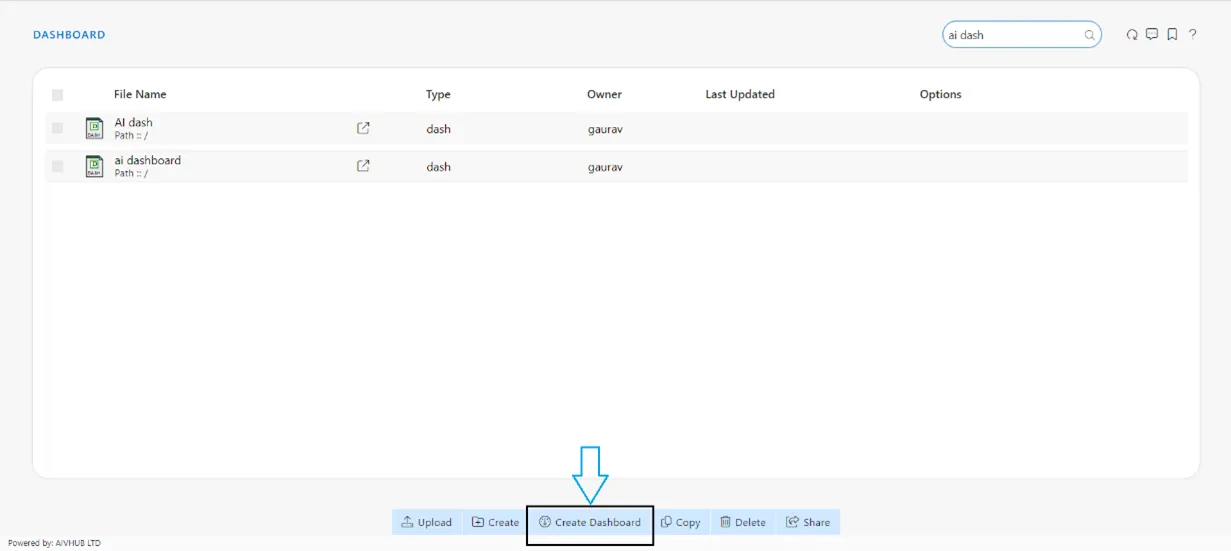
From the main dashboard page, click on the Create Dashboard button.
-
Enter name then click on the create button.

-
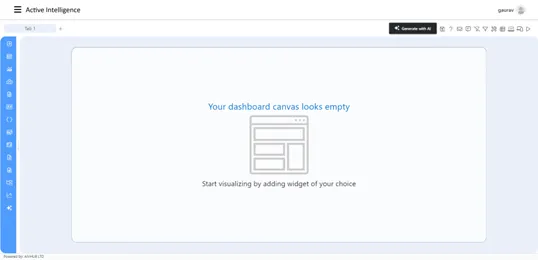
A new, blank dashboard will be created, where you can start adding widgets and data.
-
Adding Widgets in dashboard
-
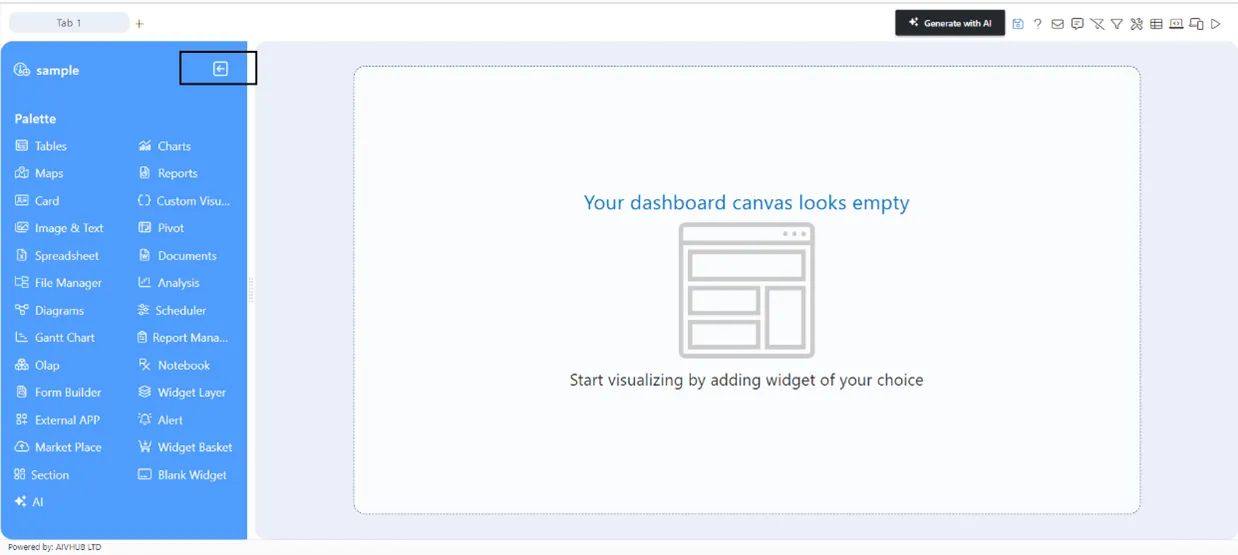
Click on the see more button to extract the widget vertical menu, Select the widgets form the left vertical menu bar. As user click on any of the widget the widget will appear in the content area automatically.
-
After adding the widget simply select the dataset. the widget required the dataset to show the output.
-
A Dataset in the AIV application is a structured collection of data that is used for creating reports, dashboards, and widgets. It can be sourced from various data inputs such as databases, APIs, or static files. Users can define datasets by selecting the required data fields, applying filters, and writing queries to structure the data for analysis. Datasets provide a way to organize and manage data, ensuring that the data displayed in dashboards and reports is accurate and relevant.
Fetching Data for Widgets
Data can be linked to widgets using two primary methods:
Using Datasources
-
Navigate to the Master Data section and click Add Datasource.
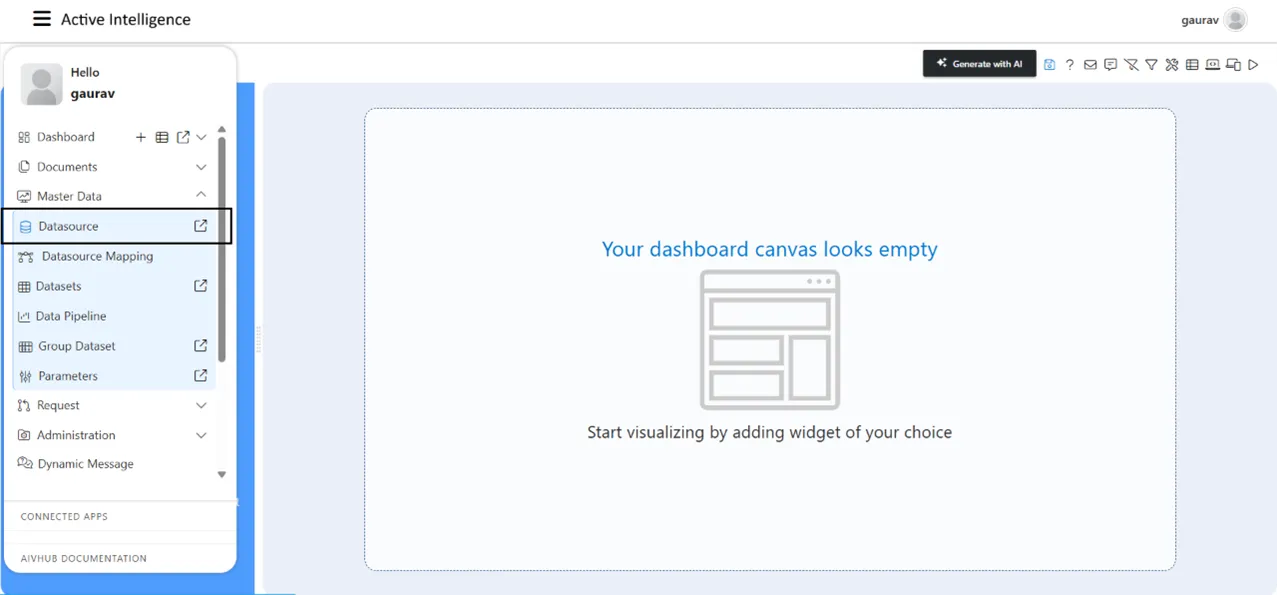
Steps to Create a Datasource in the AIV Application
There are two ways to start creating a datasource:
-
Using the Create Icon: Click the Create button on the bottom toolbar.
-
Right-Click Method: Right-click an existing datasource and select the relevant option.
-
Select the datasource type (e.g., SQL, JDBC, or API).
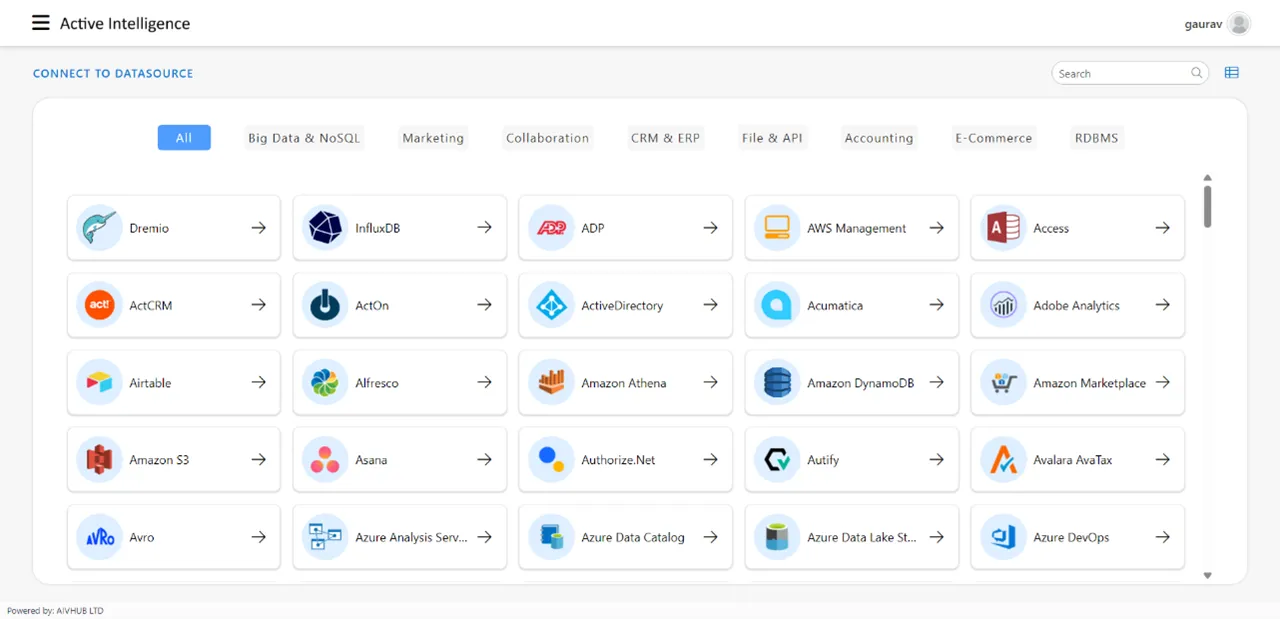
Properties to Configure
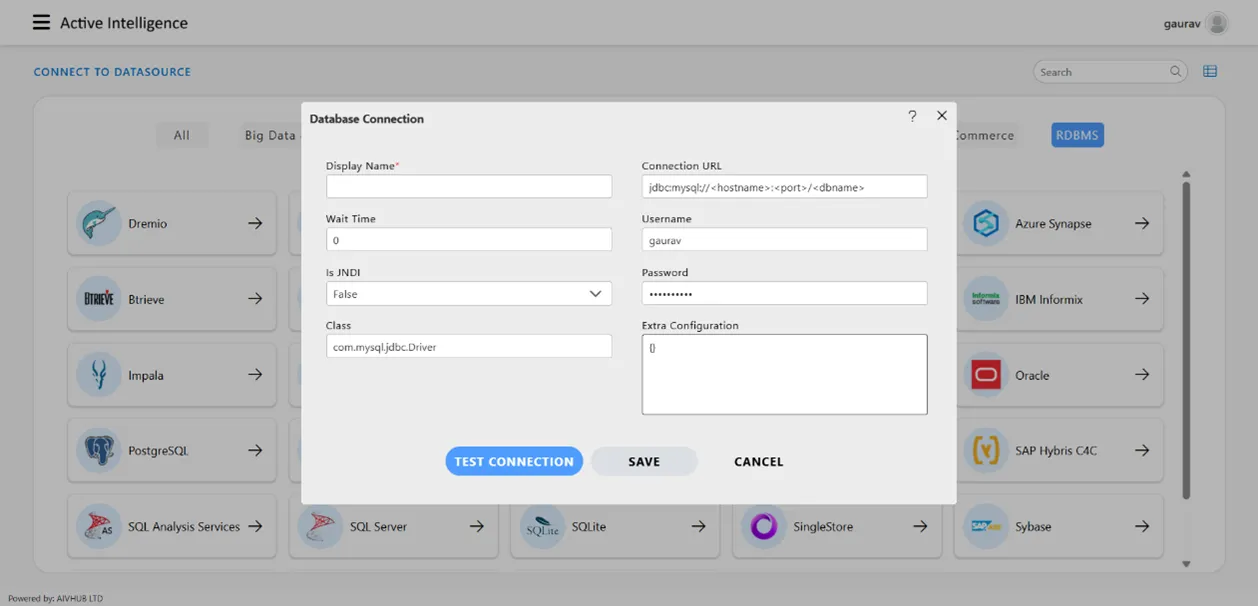
Fill in the following details to create the datasource:
-
Display Name: Provide a name for your datasource.
-
Wait Time: Set to 0 for better performance, allowing connections to wait indefinitely until available.
-
Is JNDI: Keep this set to False unless JNDI is required for your setup.
-
Class: Specify the driver class. For example:
-
MySQL: com.mysql.jdbc.Driver
-
PostgreSQL: org.postgresql.Driver
-
-
Connection URL: Add the database URL in the following format:
-
MySQL: jdbc:mysql://
: / -
PostgreSQL: jdbc:postgresql://
: /
-
-
Username: Provide your database username.
-
Password: Enter your database password.
-
Extra Configuration: Add any additional configurations if required for your setup.
Final Steps
-
Test the Connection: Click Test to ensure the connection works.
-
Save: If successful, click Save.
- Optionally, you can immediately create a dataset or skip it for later.
Additional Actions
-
Help: Access help documents by clicking the help icon.
-
Cancel: Use the cancel button next to save or the help icon to discard the process.
Data adding Using Datasets
-
In the Master Data section, go to Datasets and click Add Dataset.

Dataset Terminology Guide
When creating a dataset, you will encounter various terms across different tabs, such as the General Tab (basic details), Output Columns Tab (defining output attributes), Hierarchies (organizing data for dashboards), and Preview Tab (viewing data before saving). Each tab serves a unique purpose, and you can refer to detailed explanations and images for more clarity. Click here
for additional information.
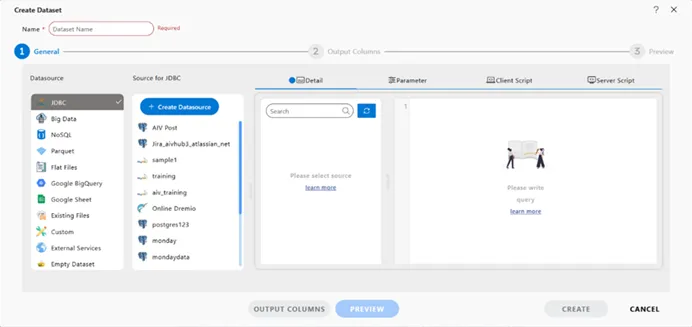
- Save the dataset and simply click the name of the dataset while adding the widget in dashboard.
Adding Widgets Using the Marketplace
The Marketplace feature allows users to integrate pre-built widgets into their dashboards effortlessly.
-
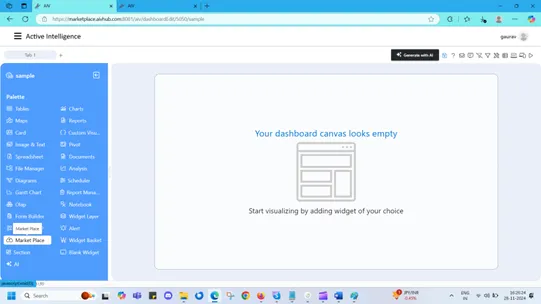
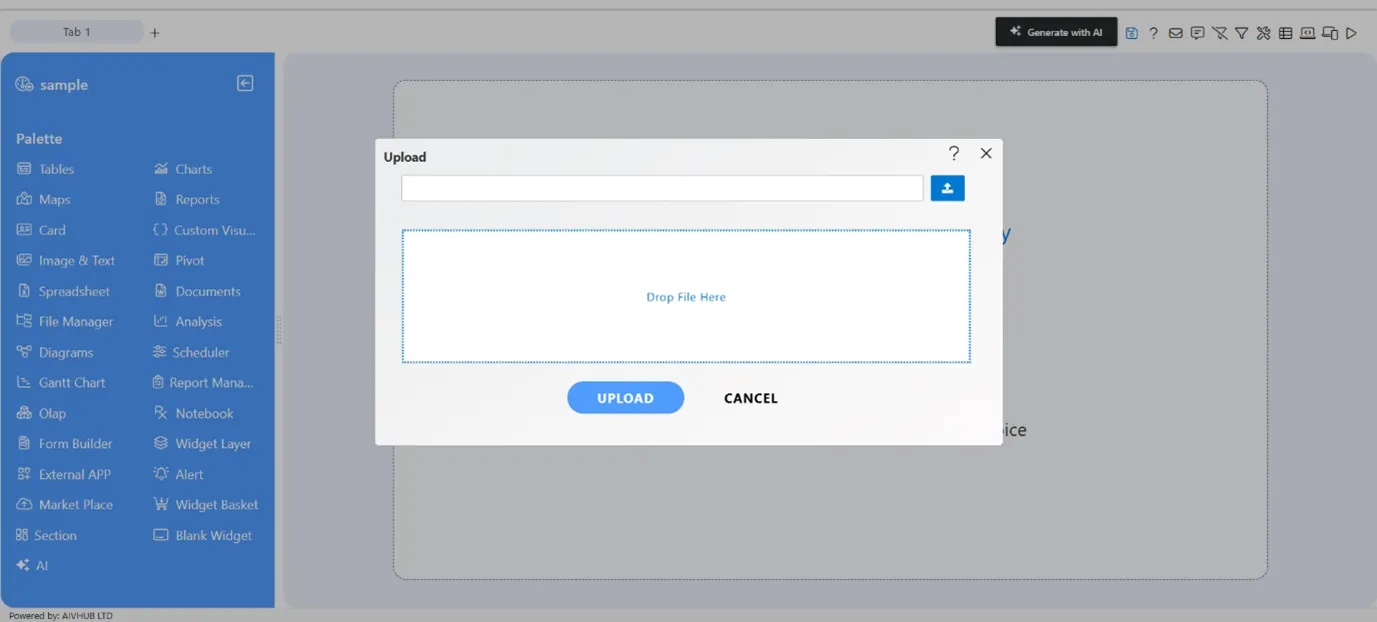
In Edit Mode, click the Marketplace from vertical menu.
-
You can drag and drop the widget or simply browse the widgets using this marketplace.
-
After adding the widget, click on the UPLOAD button. Then click on preview icon to see how it looks.
-
Save the dashboard to finalize changes.
-
Save Your Dashboard:
-
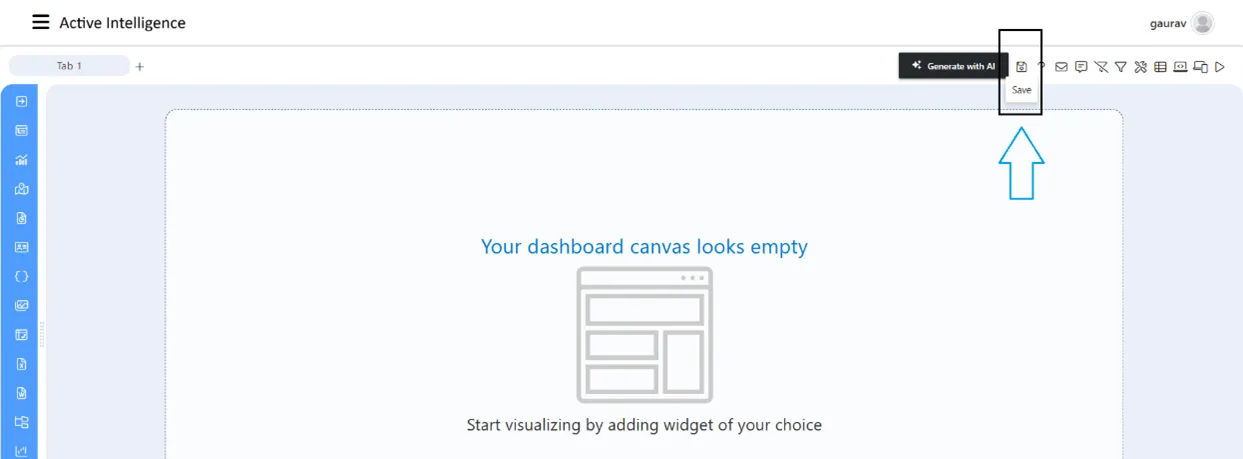
Once you have added some basic widgets or data, click on the Save button in the top-right corner.
-
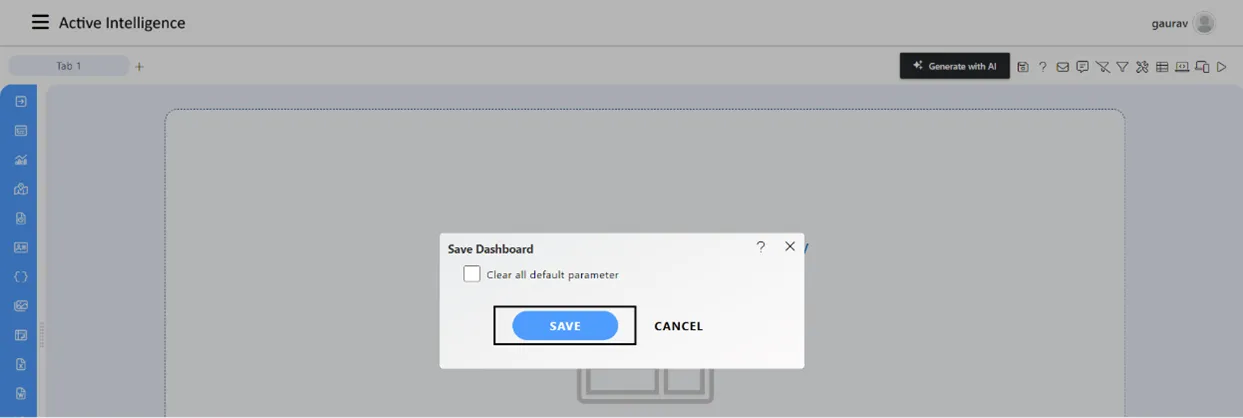
Click on the Save button from the Save dashboard dialog box.
-
Dashboard Modes: Edit Mode vs. Preview Mode
Once your dashboard is created, you can switch between Edit Mode and Preview Mode. These two modes offer different functionalities to help you design, view, and share your dashboard.
- Edit Mode
-
What is Edit Mode?
- Edit Mode is where you will do most of the work. This is the mode where you create, edit, and design your dashboard.
-
What Can You Do in Edit Mode?
-
Add Widgets: Add charts, tables, filters, and other widgets to your dashboard by dragging and dropping them.
-
Update Data: You can update or change the data displayed on your widgets at any time.
-
Change Layout: Rearrange widgets and modify the layout of your dashboard to your preference.
-
Modify Filters: Adjust filters to control which data is displayed on your dashboard.
-
Generate Embed Links: You can generate an embed code to integrate your dashboard into other websites or applications.
-
Access Mobile/Tablet Views: You can preview how the dashboard looks on mobile or tablet and make adjustments as needed.
-
-
Limitations in Edit Mode:
- Cannot Print or Take Screenshots: In Edit Mode, you cannot print the dashboard or take screenshots.
Where to Find Edit Mode:
The Edit Mode options are located in the top-right corner of the dashboard.

- Preview Mode
-
What is Preview Mode?
- Preview Mode is used for viewing the dashboard as it will appear to others. This is the mode used when you want to share or present the dashboard.
-
What Can You Do in Preview Mode?
-
Export Dashboard: You can export the dashboard as a PDF, Excel file, or Image for sharing or saving.
-
Take Screenshots: You can capture screenshots of the dashboard.
-
Print Dashboard: You can print the dashboard if needed.
-
Clear or Apply Filters: You can change filters to see different views of the data.
-
Navigate Between Tabs: If your dashboard has multiple tabs, you can easily switch between them to explore all the data.
-
-
Limitations in Preview Mode:
-
Cannot Edit Data: You cannot add or update any data in this mode.
-
Cannot Modify Layout: You cannot change the layout or make edits to widgets in Preview Mode.
-
Cannot Generate Embed Links: You cannot generate an embed code for sharing or embedding the dashboard in this mode.
-
Where and how to Find Preview Mode:
-
To switch to Preview Mode, simply click the Preview button in the top-right corner of the dashboard.

-
Here on the top-right corner you’ll find the Preview dashboard menu.

Key Features and Actions
-
Exporting the Dashboard:
-
In Preview Mode, click on the Print icon at the top-right corner of the dashboard. From here, you can export your dashboard as a PDF, Excel, or Image.

-
-
Embedding the Dashboard:
-
In Edit Mode, click on the Embed icon. You can generate a code that allows you to embed your dashboard into a website or another application.

-
-
Sharing the Dashboard:
-
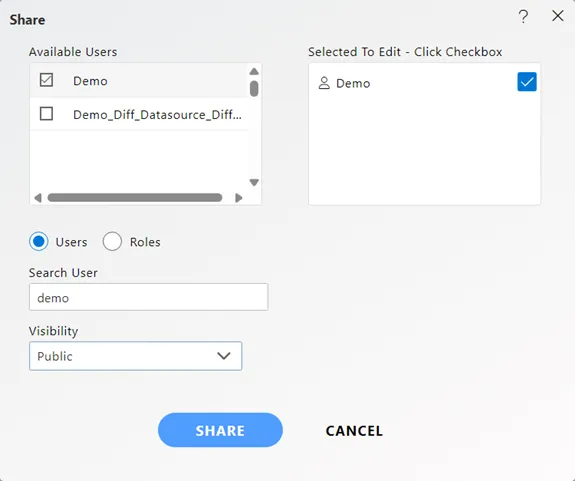
In Edit Mode, right-click on the dashboard in the Grid View, select the Share option, and choose who can access the dashboard. You can set the visibility to Internal, Private, or Public.
-
Visibility is used to mention who all can view the alert and is of following three types:
-
Private: It means only the current user / actual owner can view the file.
-
Internal: It means all the users within the organization can view the file.
-
Public: It means anyone can view the file.
Symbol Indicators for Sharing:
-
Blue Icon: Indicates the file is shared with public/internal users.

-
No Icon: Indicates the file is shared privately using user/role.

-
Red Icon: Indicates the file is shared by another user to you.

- Edit Dashboard Name/Description
-
Available in Edit Mode.
-
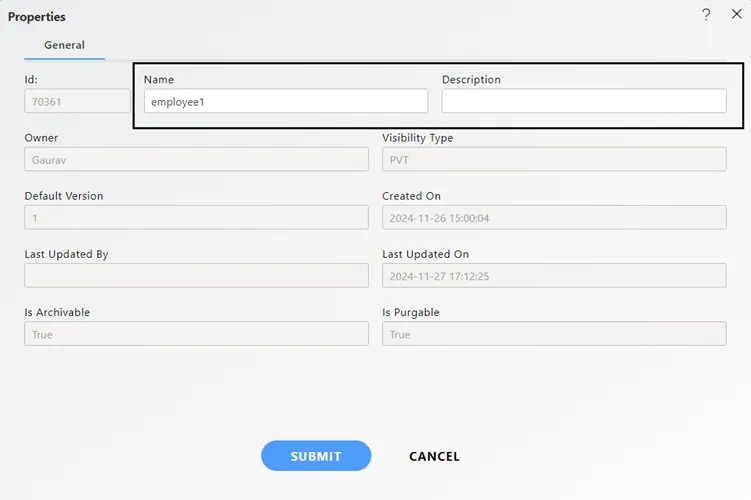
To edit a dashboard’s name or description:
-
Navigate to the Grid View.
-
Right-click on the desired dashboard.
-
Click the Properties button to open the settings.
-
From here, users can add or modify the name and description as required.
-
Configuration Settings for API Keys and OpenAI Integration
The configuration settings allow users to integrate OpenAI services and manage API keys for secure and customized functionality. This section provides steps to set up and use these features effectively.
Steps to get the API key form AIV app.
-
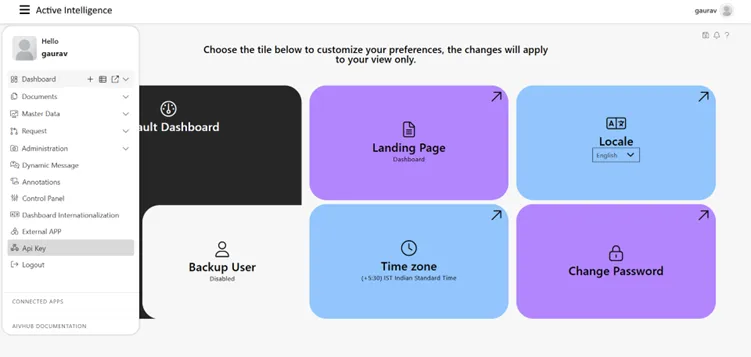
Go to hamburger menu then click on the API key button as shown in the figure below:
-
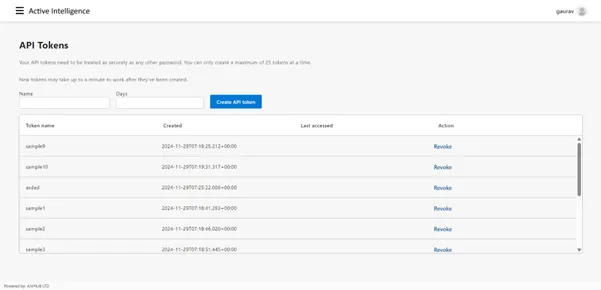
As you reach on the API Tokens station, the screen will look like as shown in figure below:
Creating API Keys
In addition to configuring OpenAI, you can create API keys for your application to securely integrate with other systems or tools.
-
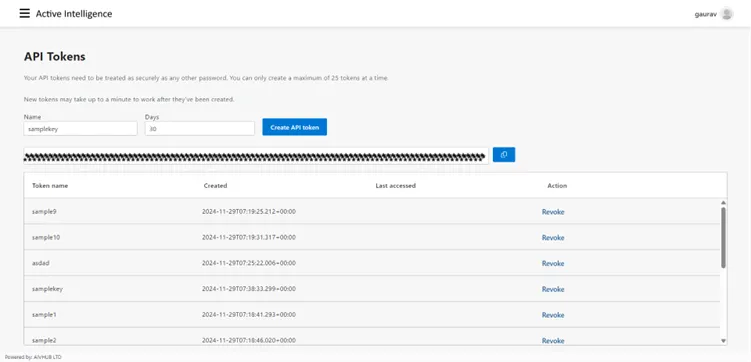
Enter Key Details:
a. Provide a name for the key to identify its purpose.
b. Set the duration in days for how long the key will remain valid.
-
Generate the API Key:
a. Click the Create API Token button.
b. A unique API key will be generated.
-
Copy the Key:
a. The key will be displayed. Copy it securely, as it won’t be shown again.
Adding OpenAI Configuration Details
-
Access the Configuration Settings:
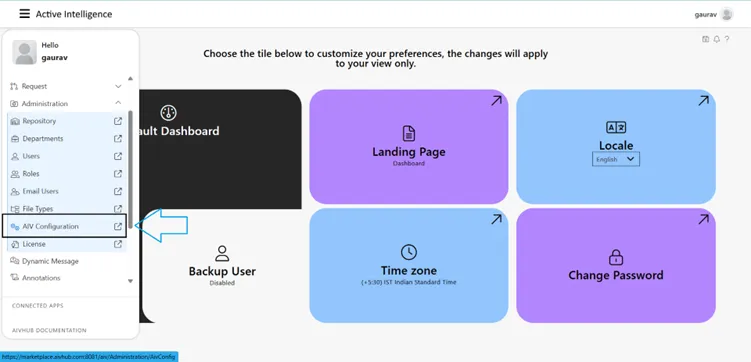
a. Navigate to the Configuration Settings section in your application. Go to Administration section then click on the AIV Configuration.
-
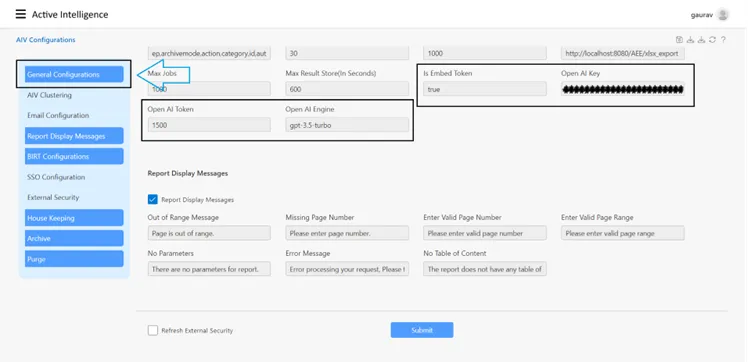
Set Embed Token:
a. Before creating an API token, users need to enable the Embed Token setting.
b. In the Embed Token field, type true to enable this feature.
c. This setting allows the system to generate tokens for embedding, ensuring secure and authorized access when embedding the application in other tools or systems.
-
Enter the OpenAI Key:
a. In the OpenAI Key field, paste the API key provided by OpenAI.
b. This key enables secure communication with OpenAI’s services.
-
Add the OpenAI Token:
a. Enter the OpenAI Token in the designated field.
b. This token is used for authentication to ensure access is authorized.
-
Specify the OpenAI Engine:
a. Enter the details of the OpenAI Engine you want to use (e.g., text-davinci-003 or other models).
b. The engine defines the capabilities and behaviour of the AI service you’re using.
-
Save the Settings:
a. Once all details are entered, click the Save button to apply your configuration.
By combining these settings, you can securely integrate OpenAI and manage API access efficiently. These features provide a simple yet powerful way to customize and enhance your application workflows.