Pivot
The Pivot component in an Adhoc Report allows you to summarize data from a dataset, enabling users to group rows and columns in various ways. Once created, pivot tables also support drilling down into specific data for detailed analysis.
Objective
Create Adhoc Report using Pivot.
Prerequisite
The Sales.cds dataset is used for this example.
Download adhoc_analysis.zip file.
After downloading the zip file, add the Sales.ds into the Dataset Section of AIV for this example. To add it into AIV follow this link .
Adhoc Report - Pivot: This video contains information regarding How to Create Adhoc Report using Pivot in AIV.
Steps to Create Adhoc Report using Pivot
-
Login to AIV using your credentials.
-
There are three ways to add an Ad-hoc Report in the application:
-
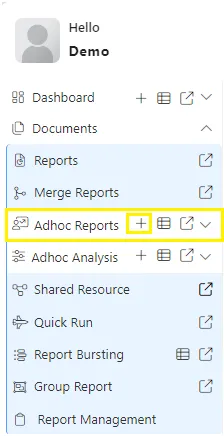
From the Hamburger menu
 , navigate to Documents > Adhoc Reports. Then, click the (+) icon next to “Adhoc Reports”, as illustrated in the figure below:
-
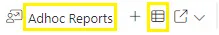
Click on the Adhoc Reports grid, as shown in the figure below:
- Right-click on any empty area in the list view and choose Create Adhoc from the context menu.
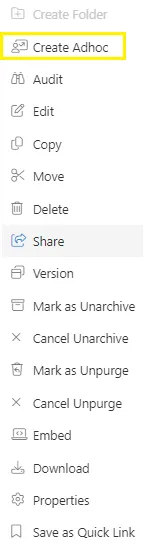
- Right-click on any empty area in the list view and choose Create Adhoc from the context menu.
-
Click the Create Adhoc button located in the bottom horizontal menu bar, as shown in the figure below:

-
-
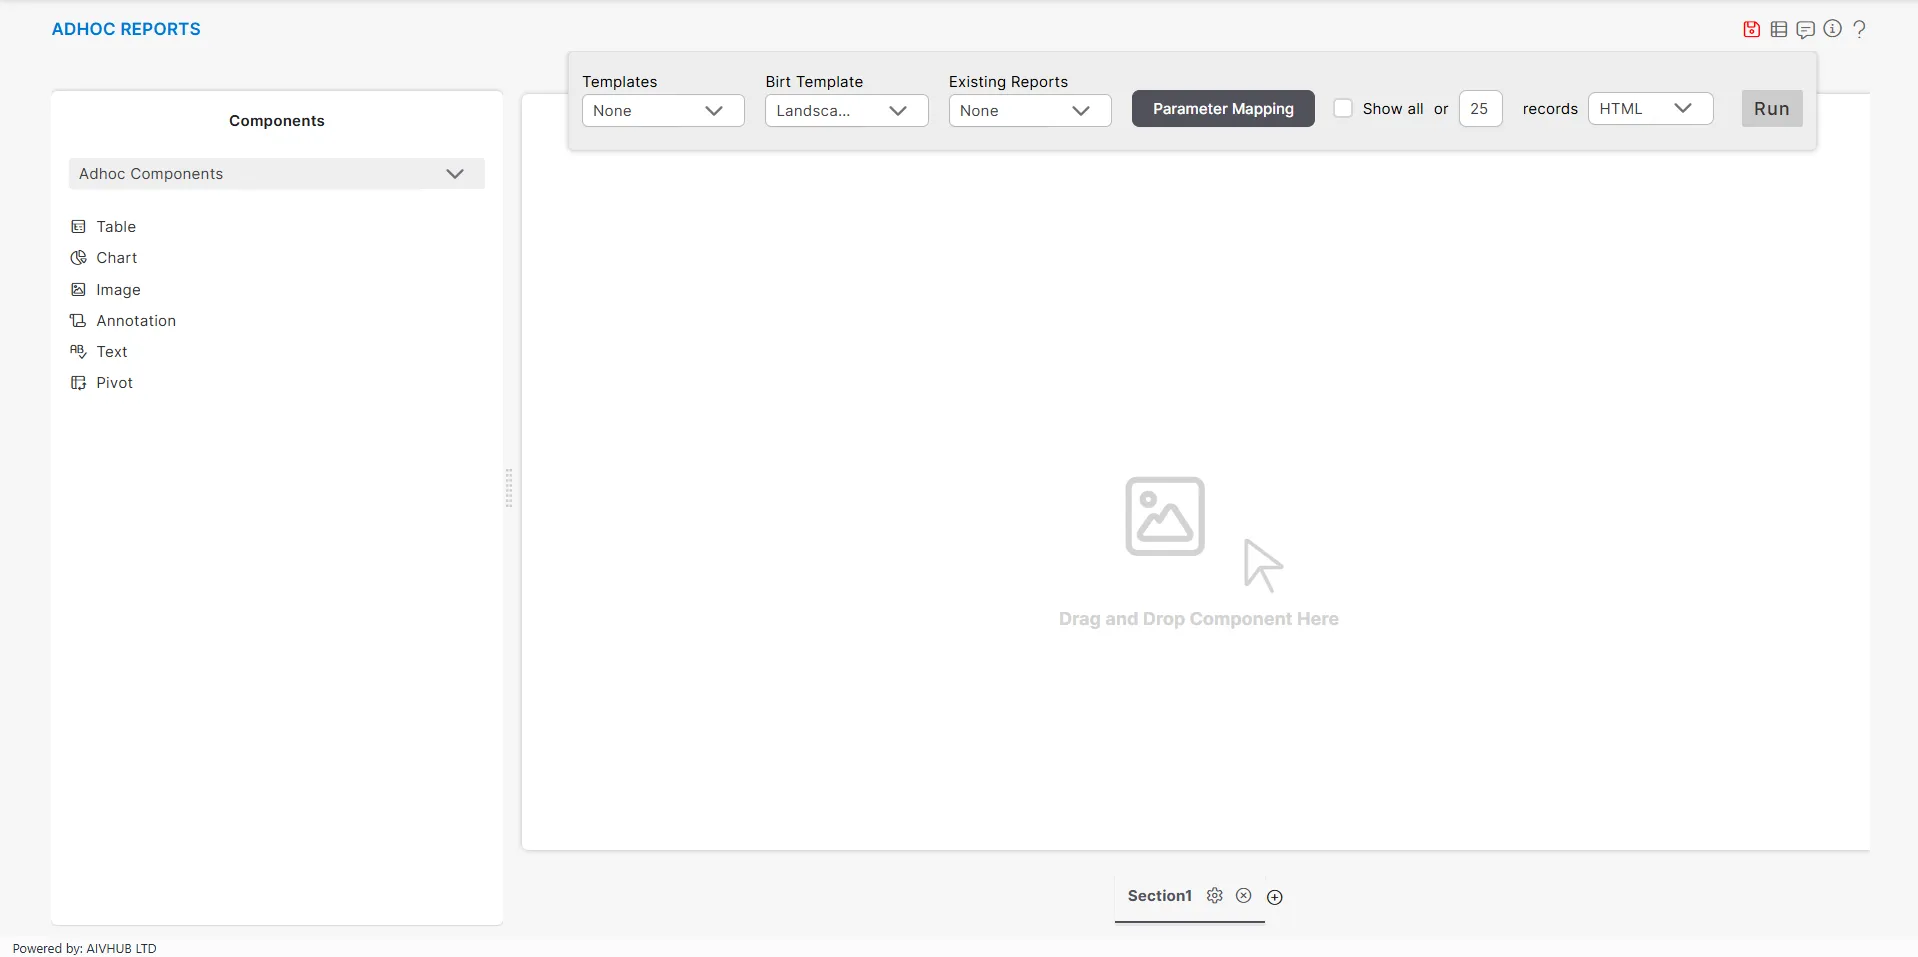
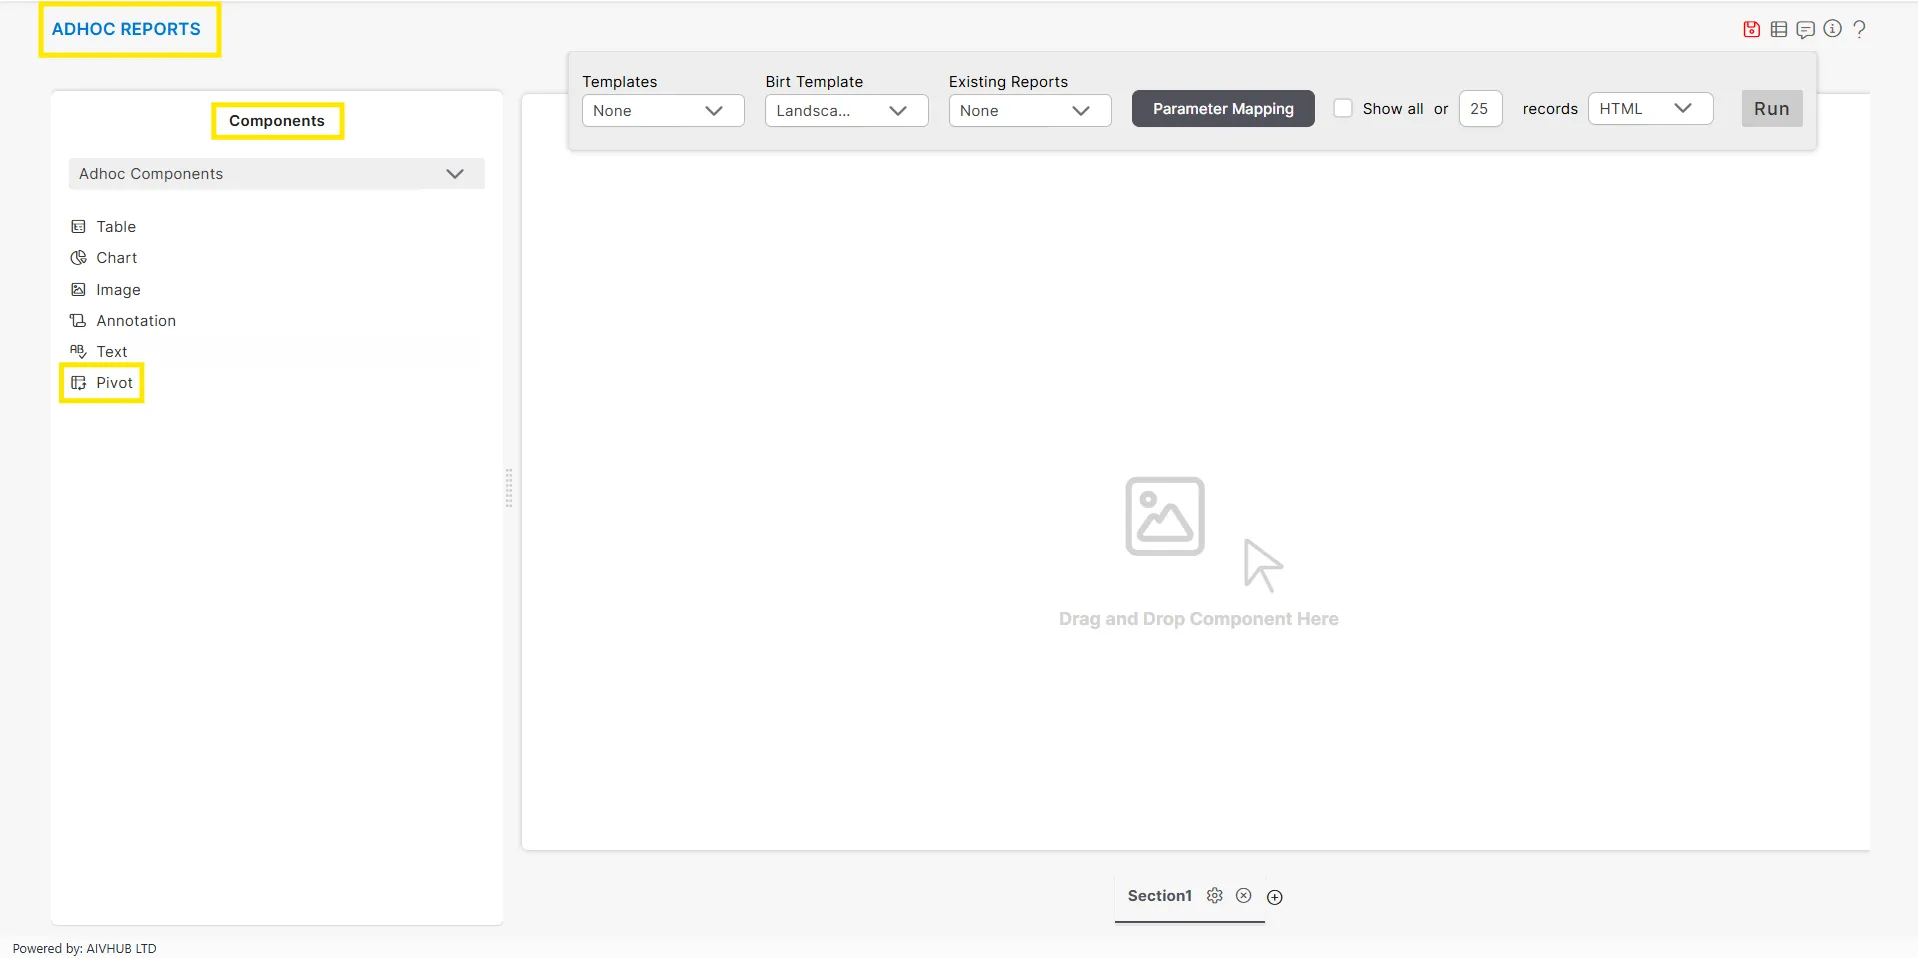
When the user clicks the Create Adhoc option using one of the methods mentioned above, the following window will appear:
-
Drag and drop the Pivot component into the empty area as shown below:
-
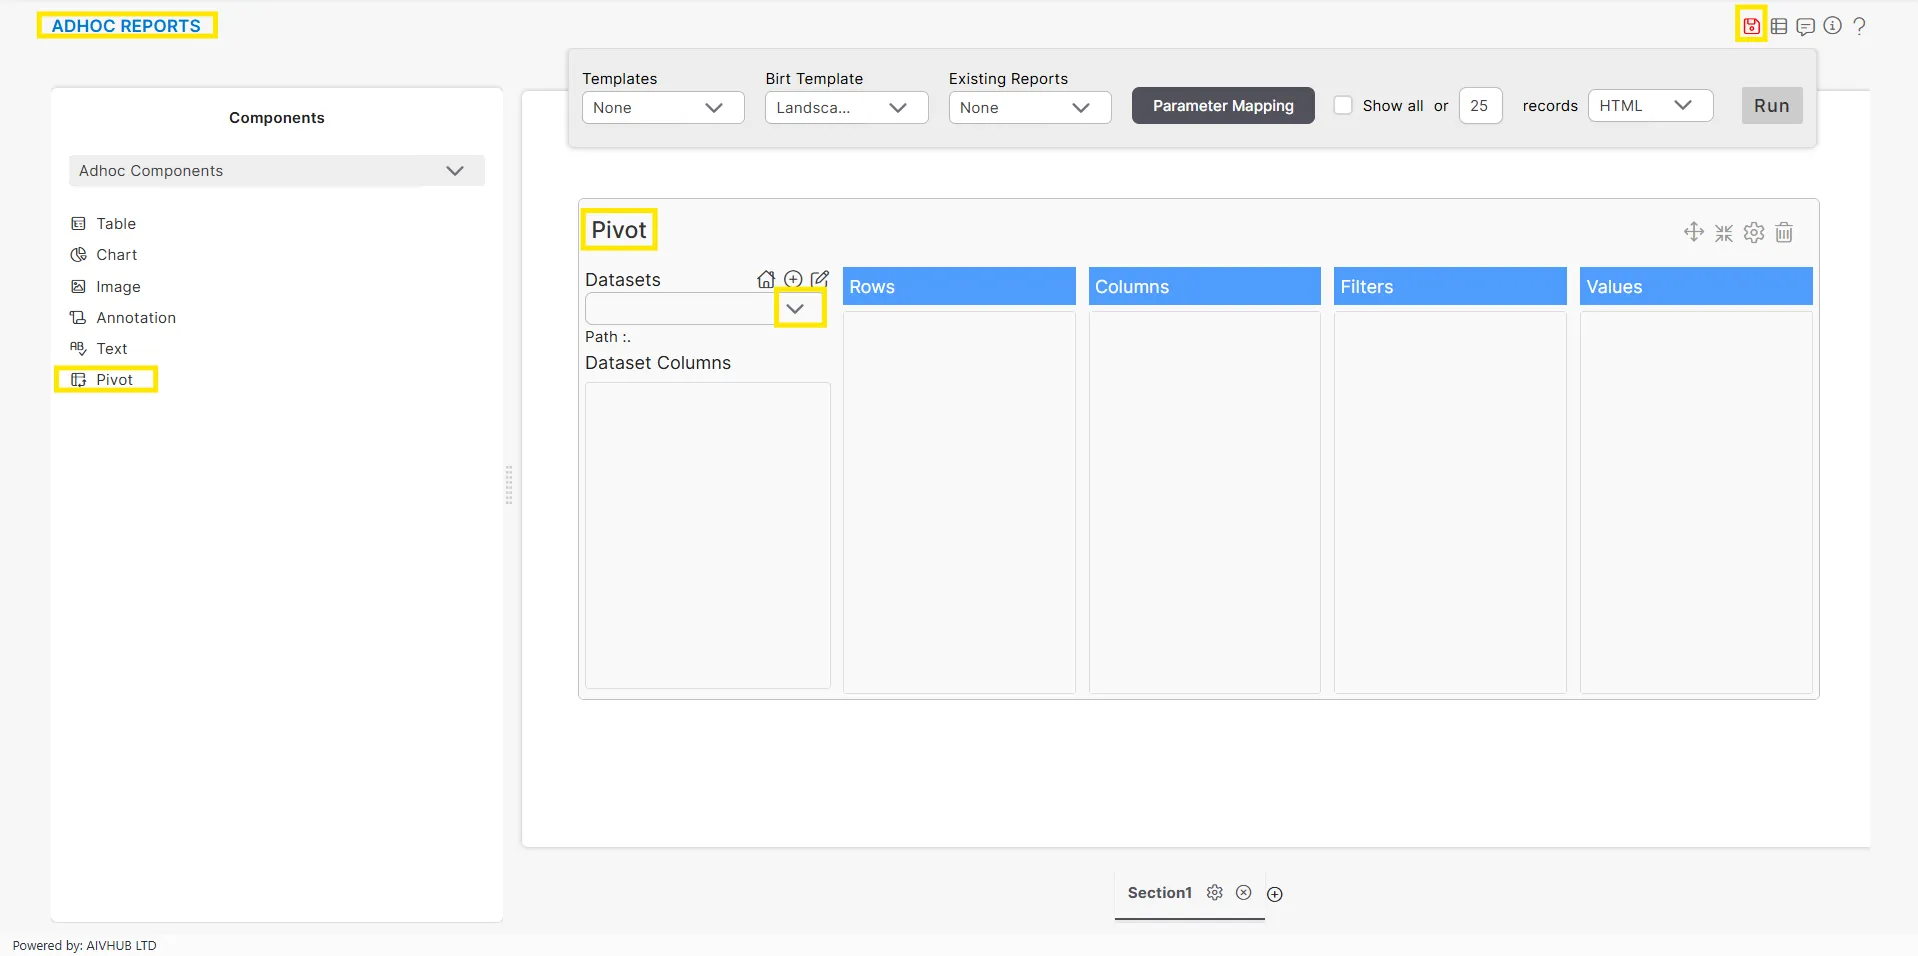
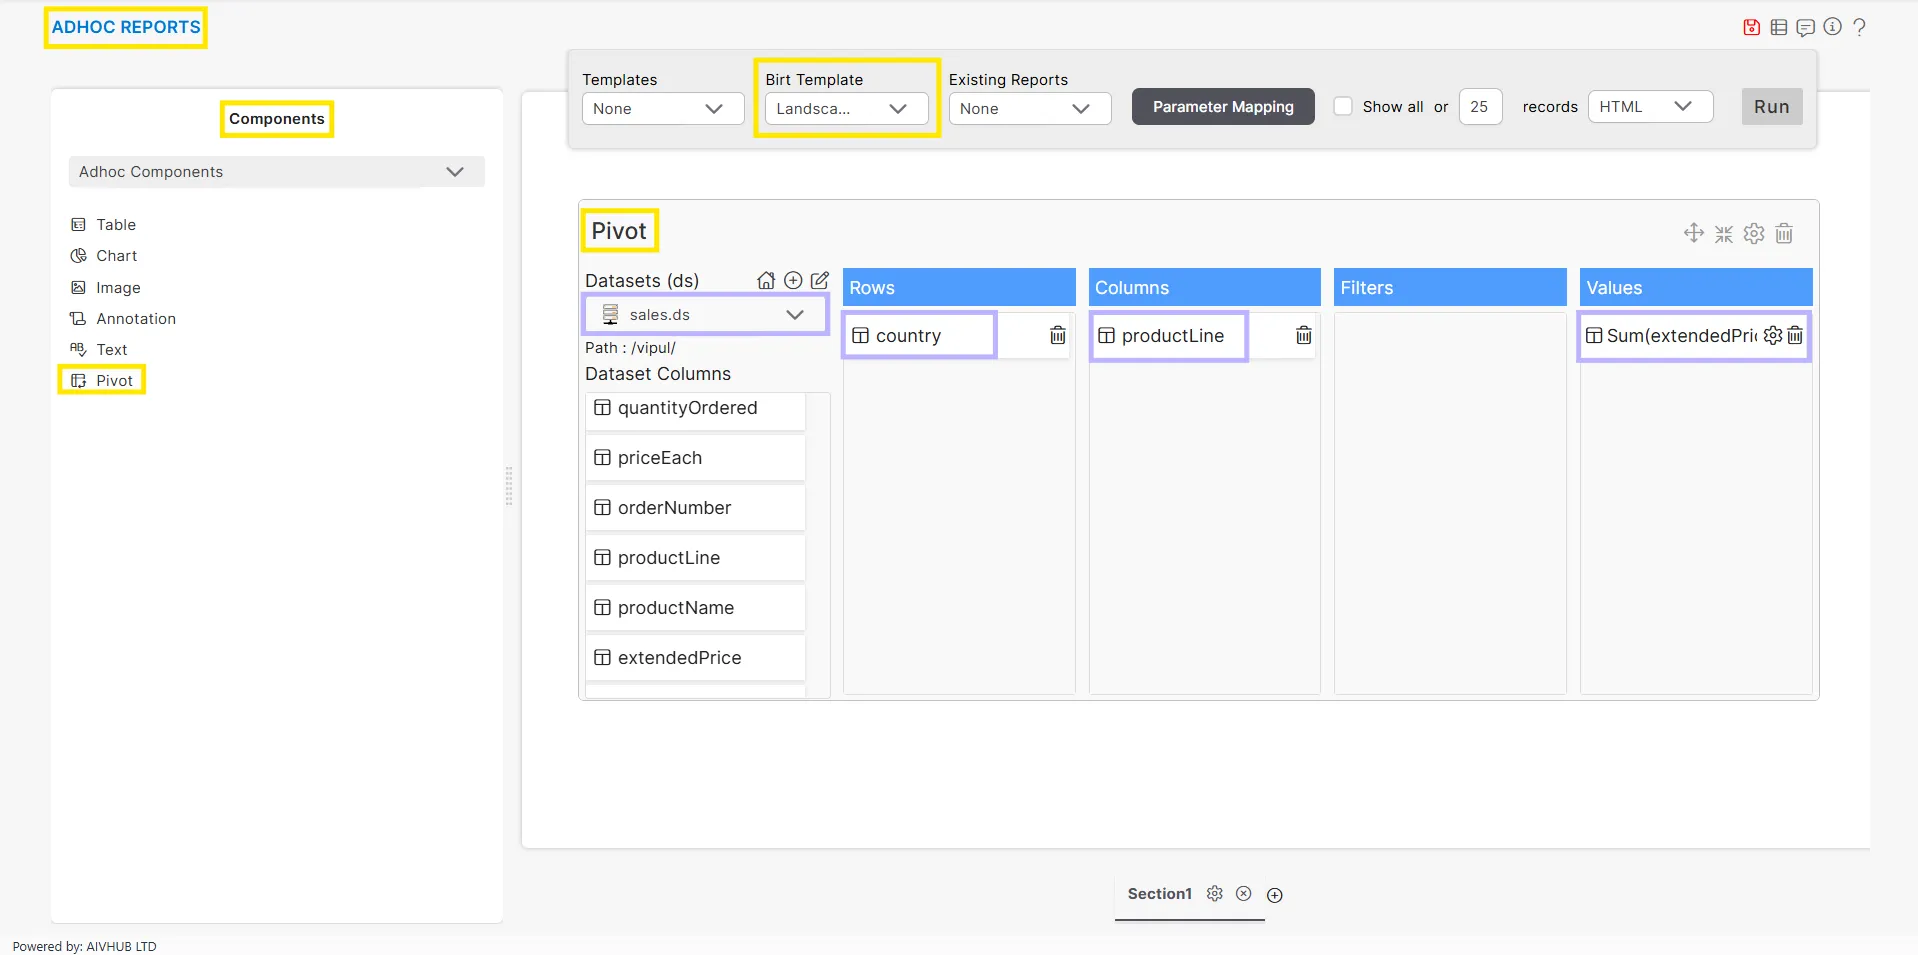
As user perform the above step, window will look as per the image below:
-
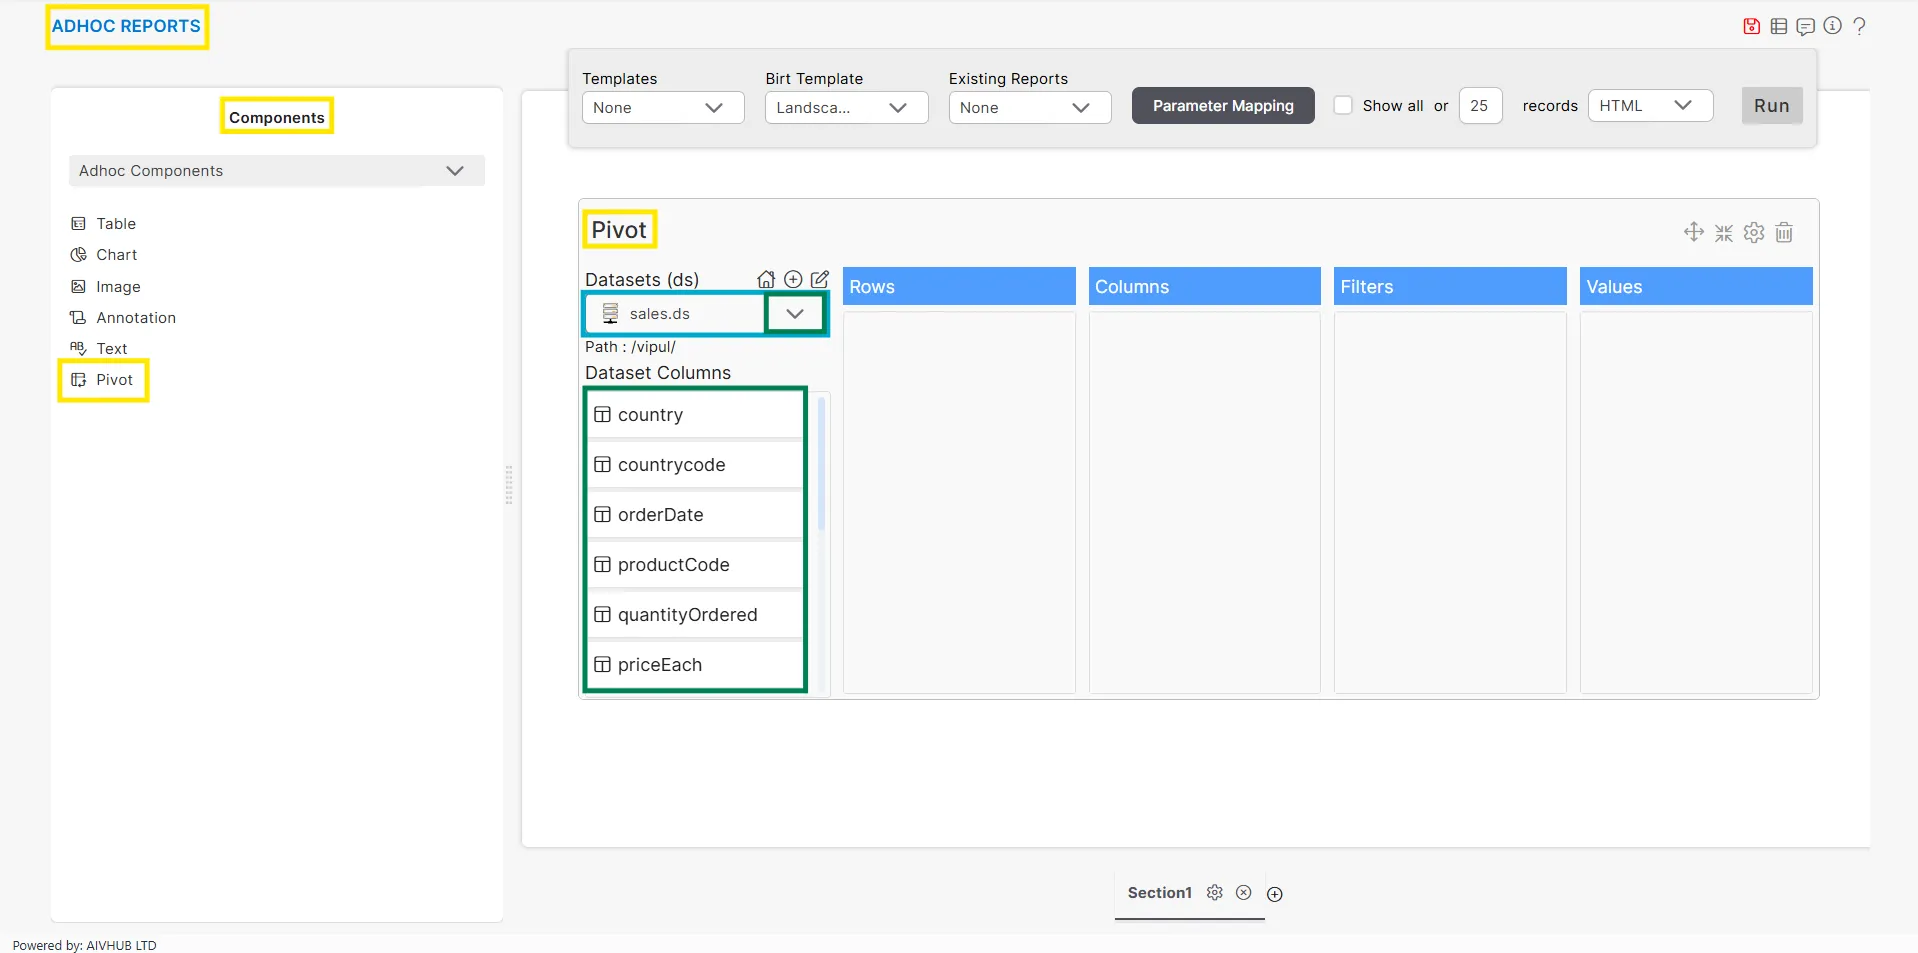
Now, from the Datasets drop-down list, select Sales.ds as shown below:
-
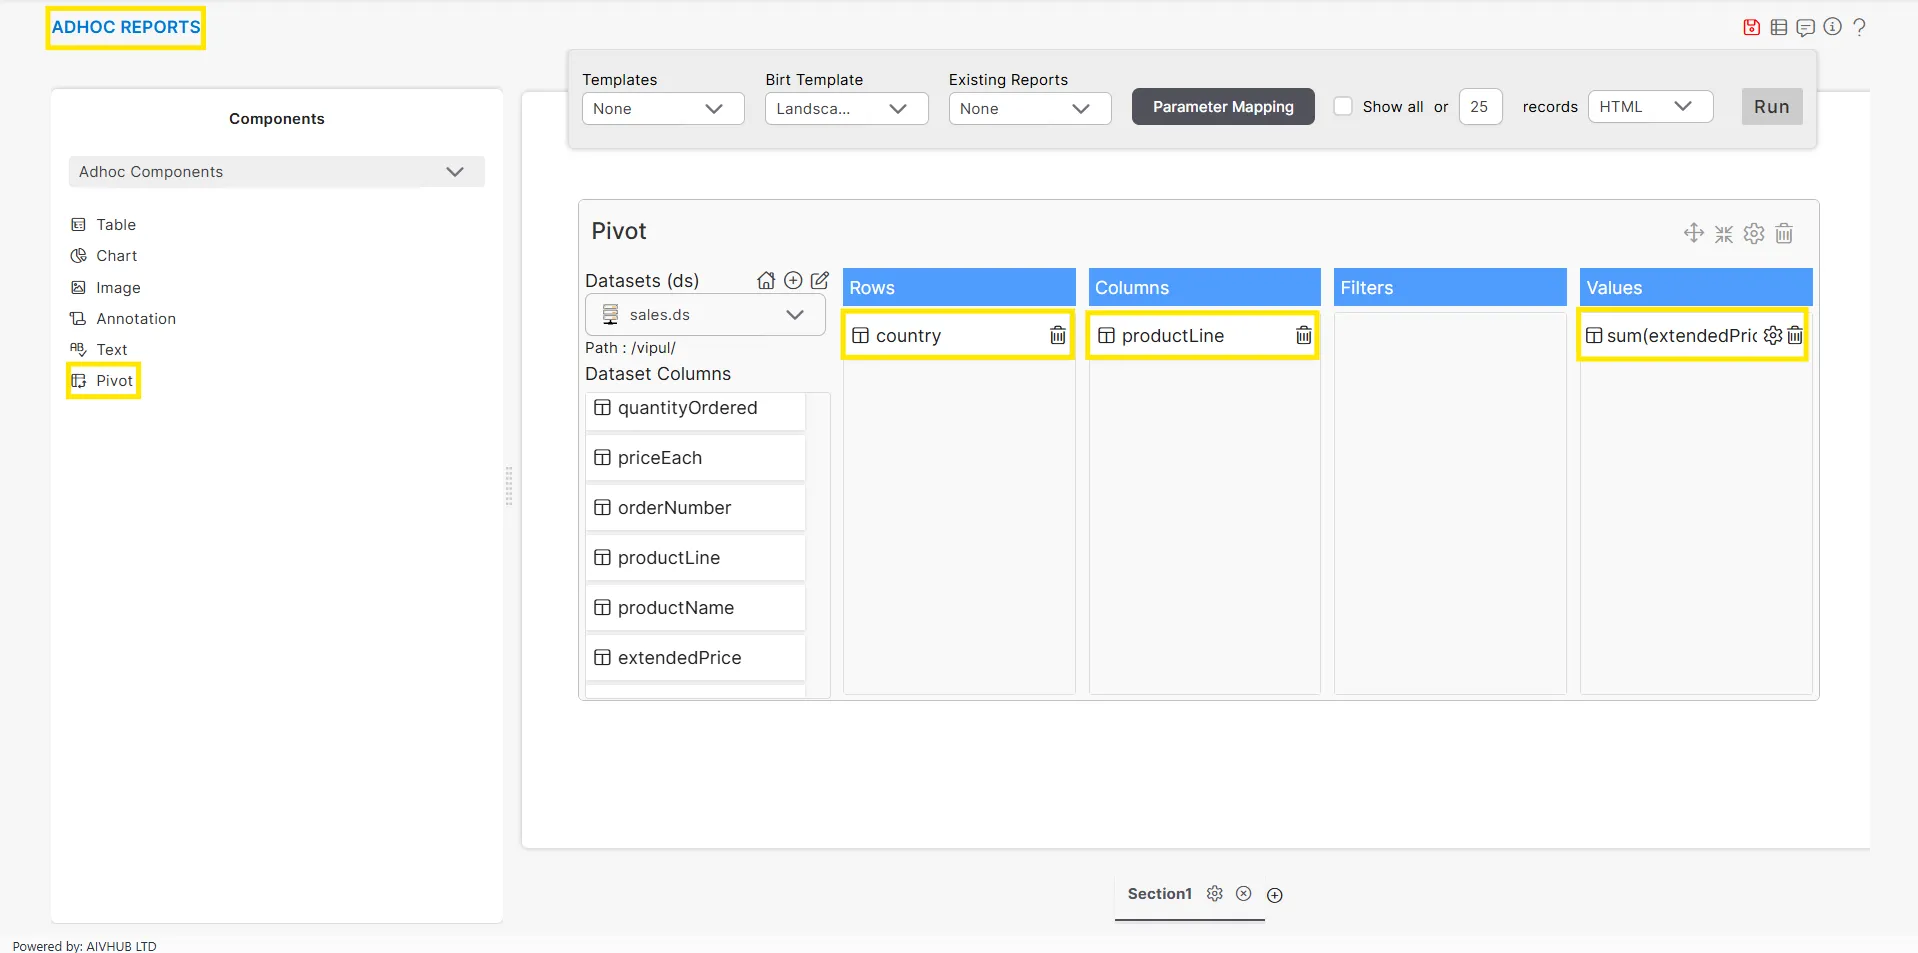
Add country to Rows, productLine to Columns, and extendedPrice to Values by dragging them from the Dataset Columns.
-
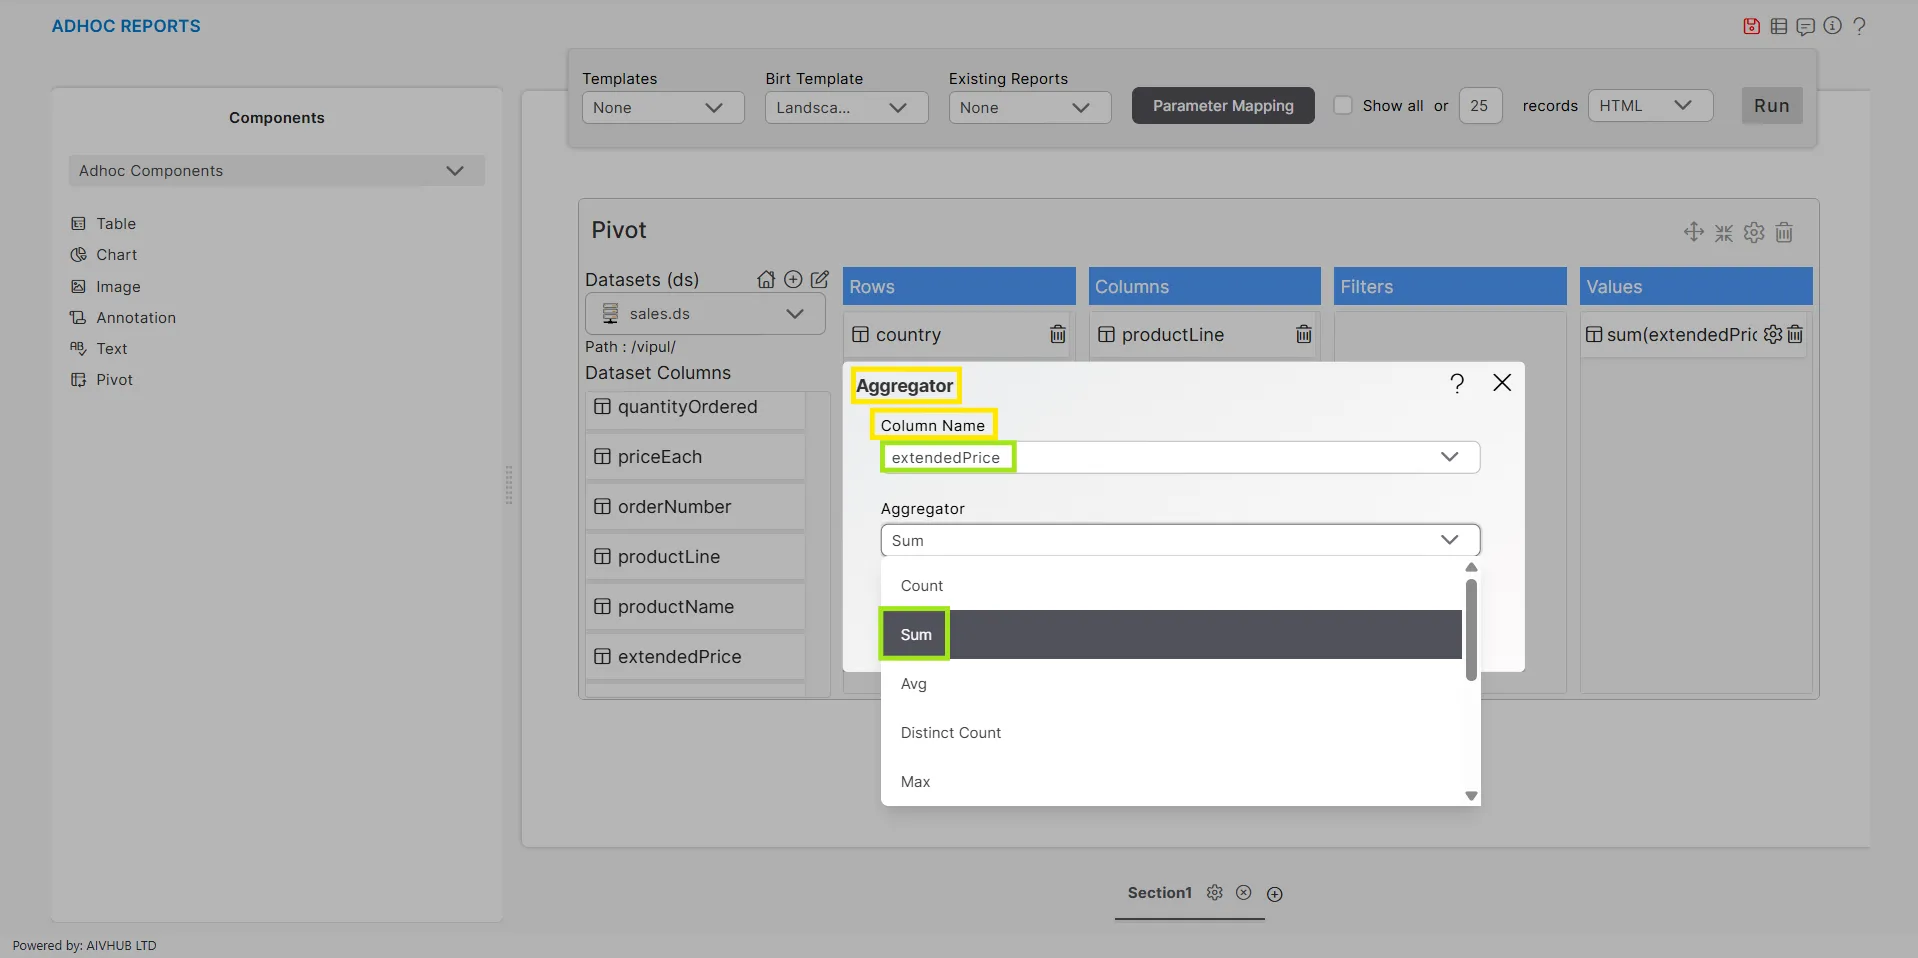
Click the Settings
 Click the Settings icon next to sum(extendedPrice) under Values.
 -
A dialog box will open as shown below:
-
The user can make the changes if required and Click the Submit
 button to Save.
 -
Select Landscape View from the Birt Template drop-down as shown.
-
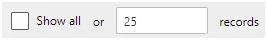
You can also specify the number of records you want to show on a page from the following widget near the template selector widget:
-
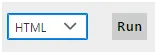
The Pivot in an Adhoc Report can only be run with the HTML format type.
-
To run the Adhoc Report using the Pivot component, click on Run in the top most right corner as follows:
-
Click on Run option, which will open the following dialog box:
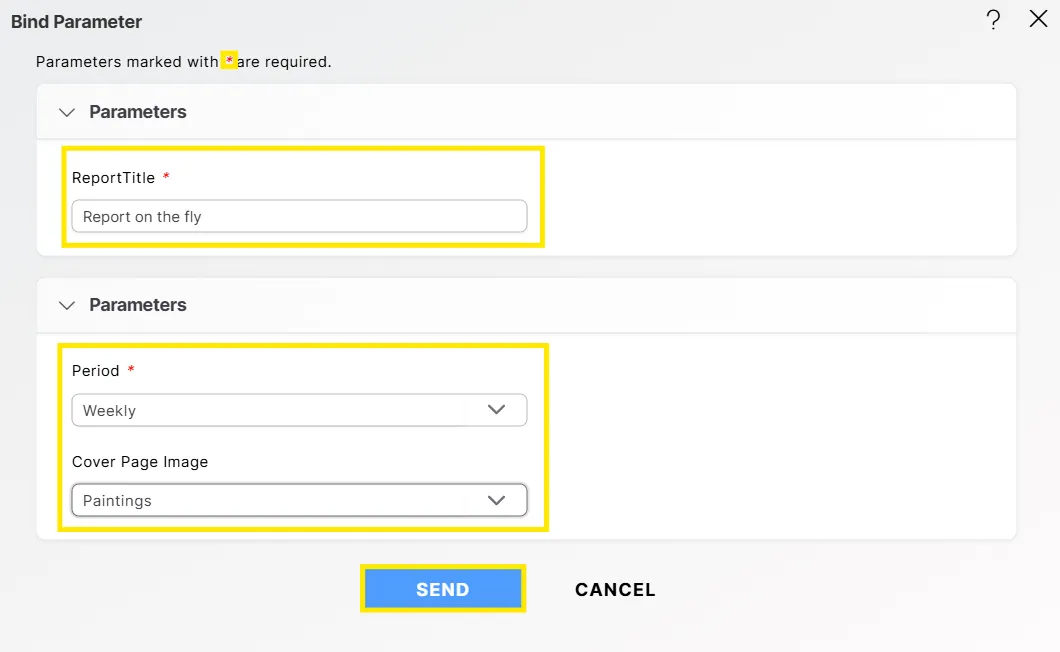
-
Since the datset has no parameters, the user clicks the Submit
button, and it redirects them to a new tab in the browser. -
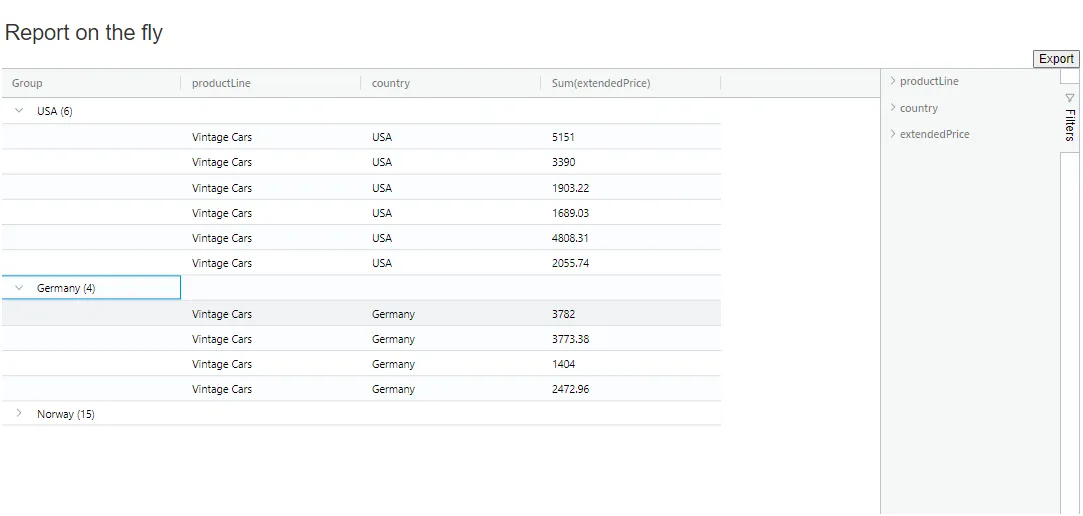
The Adhoc Report using pivot component will be generated in HTML.
-
If you want to save the pivot, click the save
 icon located at the top-right corner. This will open the following dialog box:
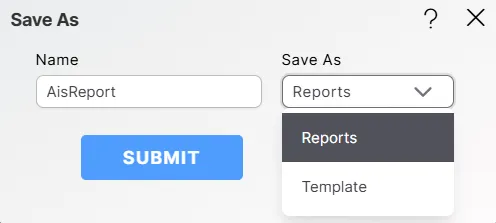
-
You can enter a custom name and choose either save as Reports/Template.
-
For this example; give Name: AisReport & Select Save As: Reports and click on
to perform the save operation. -
If you want to change the settings of a componenet click on Setting
icon below Run which will open the following dialog box: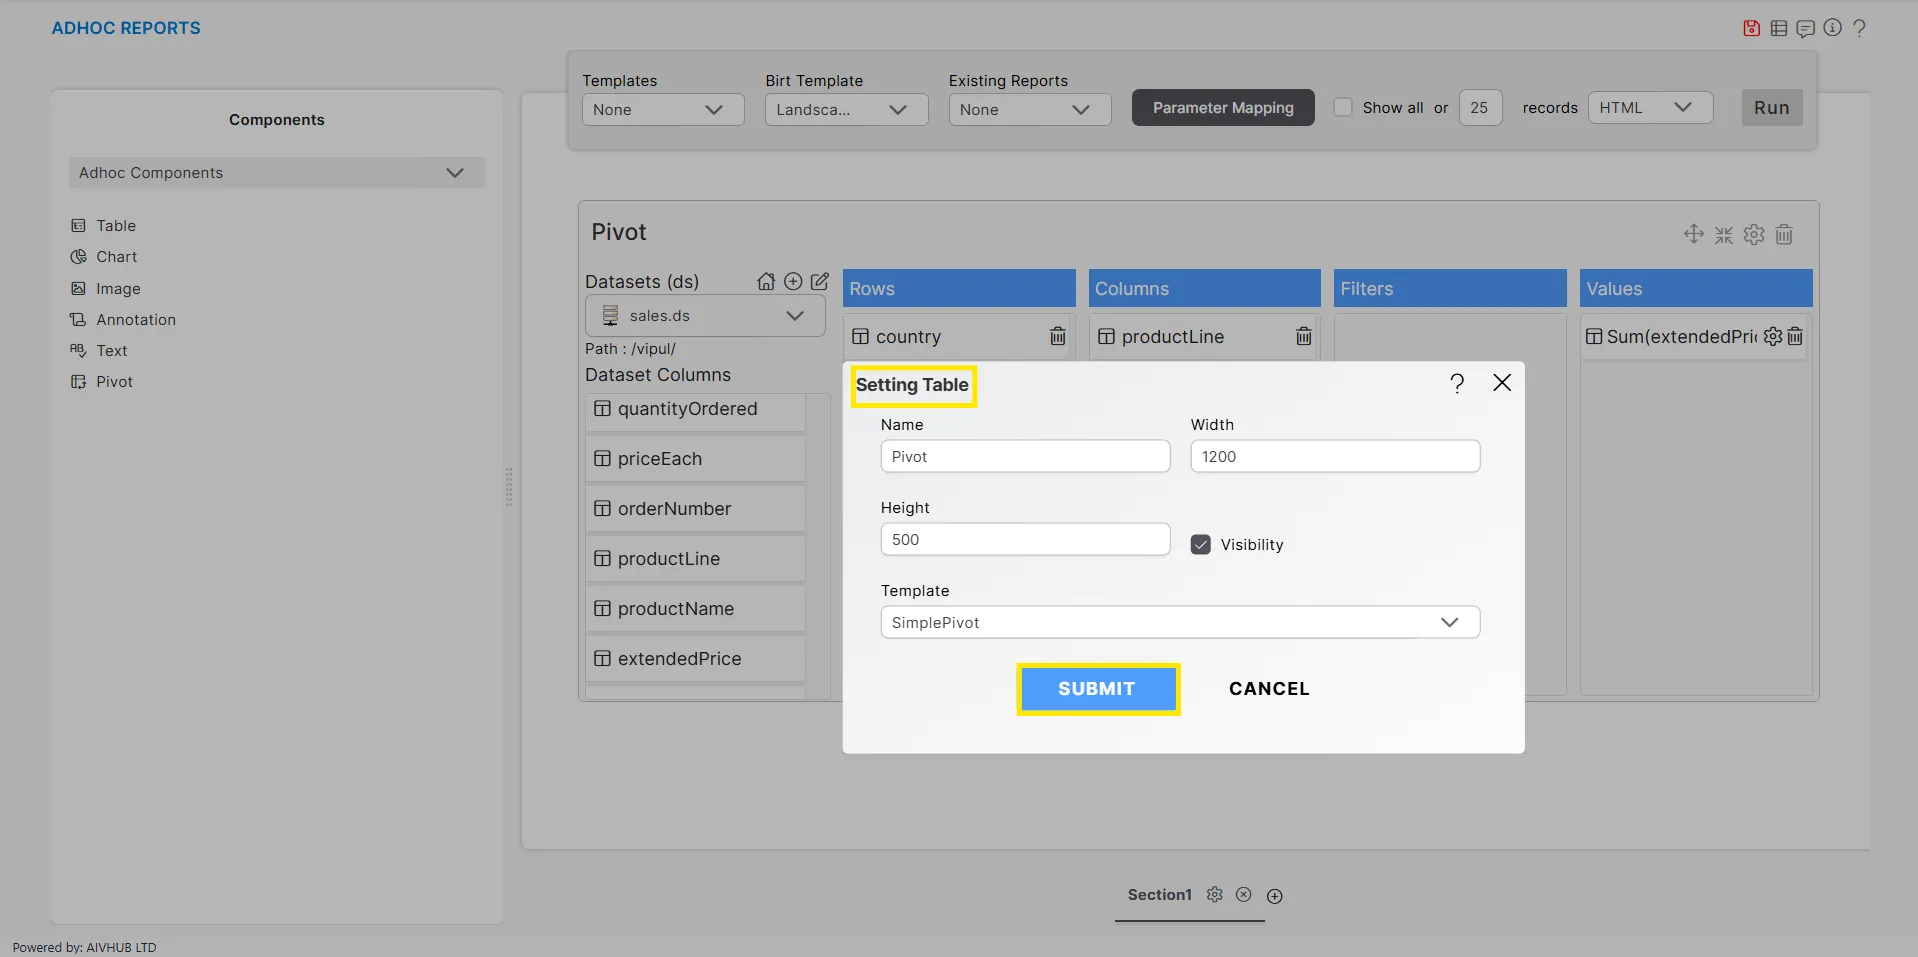
-
Similarly, click the Delete
 icon to remove the Pivot component.
The following graphical elements are available in Adhoc reports:
Adhoc Table
Adhoc Chart
Adhoc Image
Adhoc Annotation
Adhoc Text
Adhoc Pre-defined Components
Bind Parameters
Adhoc Embed Link