Table
Adhoc Reports are reports created on the spot, rather than being pre-built, based on specific client requirements, typically using data from a live environment.
Objective
Create Adhoc Report using Table.
Prerequisite
-
The Sales.ds dataset is used for this example.
-
Download adhoc_analysis.zip file.
-
After downloading the ZIP file, upload the Sales.ds file to the Datasets section in AIV for this example. To upload it, follow this link
This video provides a step-by-step guide on creating an Ad-hoc report using the table component in AIV:
Table component feature
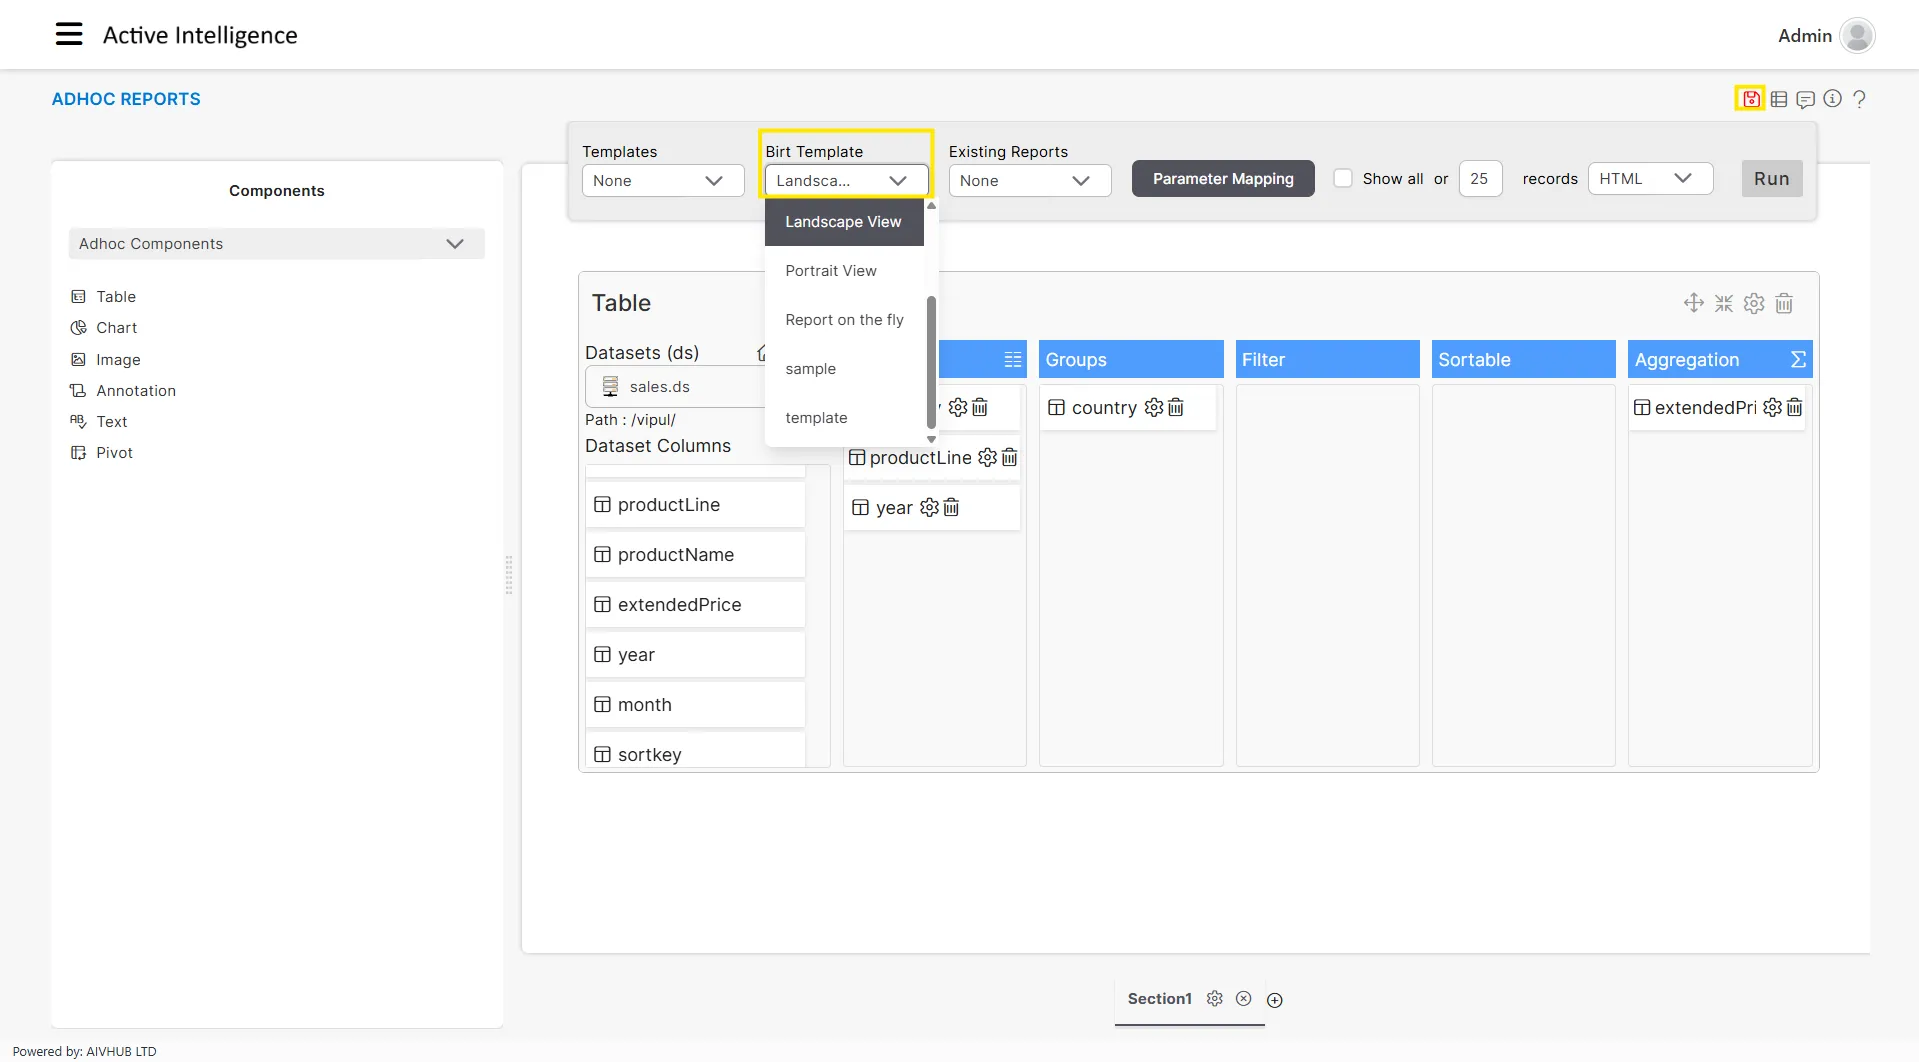
Add the Table component: To add the table component to the content page, drag and drop the table component from the component panel to the center content area.
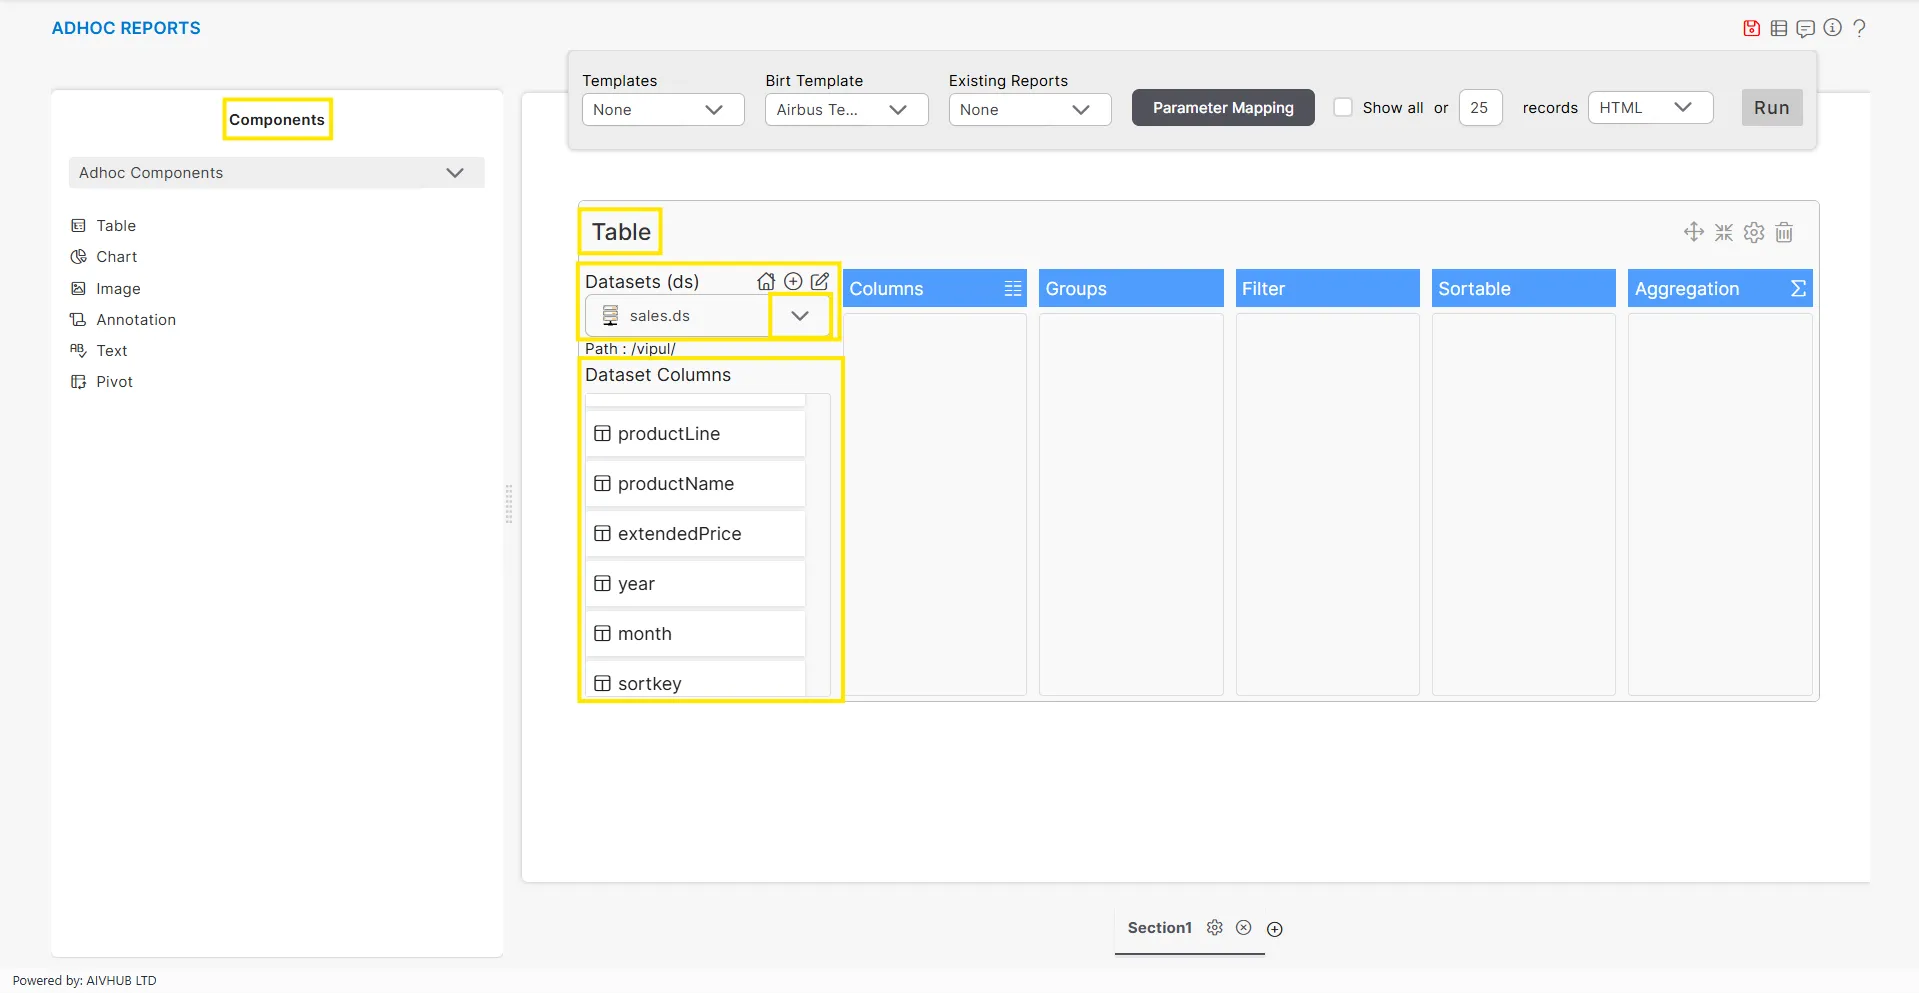
Dataset: From the Datasets dropdown, the user can select the required dataset and proceed to create and view the report. Once a dataset is selected, its corresponding column names will appear in the Dataset Columns list below the dropdown.
Columns: The user can add multiple columns to the Ad-hoc report by simply dragging and dropping the desired columns from the list into the column area.
Group: It allows the user to create data groups from the Groups area. By adding a column to this section, the system automatically groups the data based on that column in the Ad-hoc report.
Filter: The Filter section allows the user to apply filter conditions to the selected columns. The user can add a column to the filter area and configure filter values by editing the added column. Available filter conditions include Equal to, Between, Not Between, Bottom N, Bottom Percent, Greater then, Greater then or equal, Less then, Less then or equal, Like, Match, Not Match.
Sortable: When a column is added to this section, it sorts the values of that column in ascending or descending order, with ascending set as the default.
Aggregation: The Aggregation section allows users to perform mathematical or statistical calculations on data columns to summarize and analyze information in the Ad-hoc report. By adding a column to the Aggregation section, users can apply various aggregate functions to compute summary values across rows of data, either for the entire dataset or within defined groups. The Key Componenets we will found in Ad-hoc report are:
- Display Name- Custom name to identify the aggregated result in the report (e.g., “Total Sales”, “Average Price”).
- Data Type- Specifies the output type of the aggregated calculation: Integer, Date, Date Time, Decimal, Float, Time, String, or Boolean.
- Aggregator- The calculation function to apply (AVE, CONCATENATE, COUNT, COUNTDISTINCT, FIRST, IRR, IS-BOTTOM-N, IS-BOTTOM-N-PERCENT, IS-TOP-N, IS-TOP-N-PERCENT, LAST, MAX, MEDIAN, MIN, MIRR, MODE, MOVINGAVE, NPV, PERCENTILE, PERCENTRANK, PERCENTSUM, QUARTILE, RANK, RUNNINGCOUNT, RUNNINGNPV, RUNNINGSUM, STDDEV, SUM, VARIANCE, WEIGHTEDAVE).
- Expression- Defines the calculation formula using dataset columns with syntax: dataSetRow[“columnName”]. Sample expression : dataSetRow[“quantityOrdered”] * dataSetRow[“priceEach”]
- Format- Applies display formatting to the result (Number, DateTime, or String formatting options).
- Aggregate On- Determines aggregation scope: Tables (entire dataset) or Groups (within each group for subtotals).
- Group (appears when “Groups” is selected)- Specifies which grouping column to aggregate by for group-level calculations.
Steps to Create Adhoc Report using Table
-
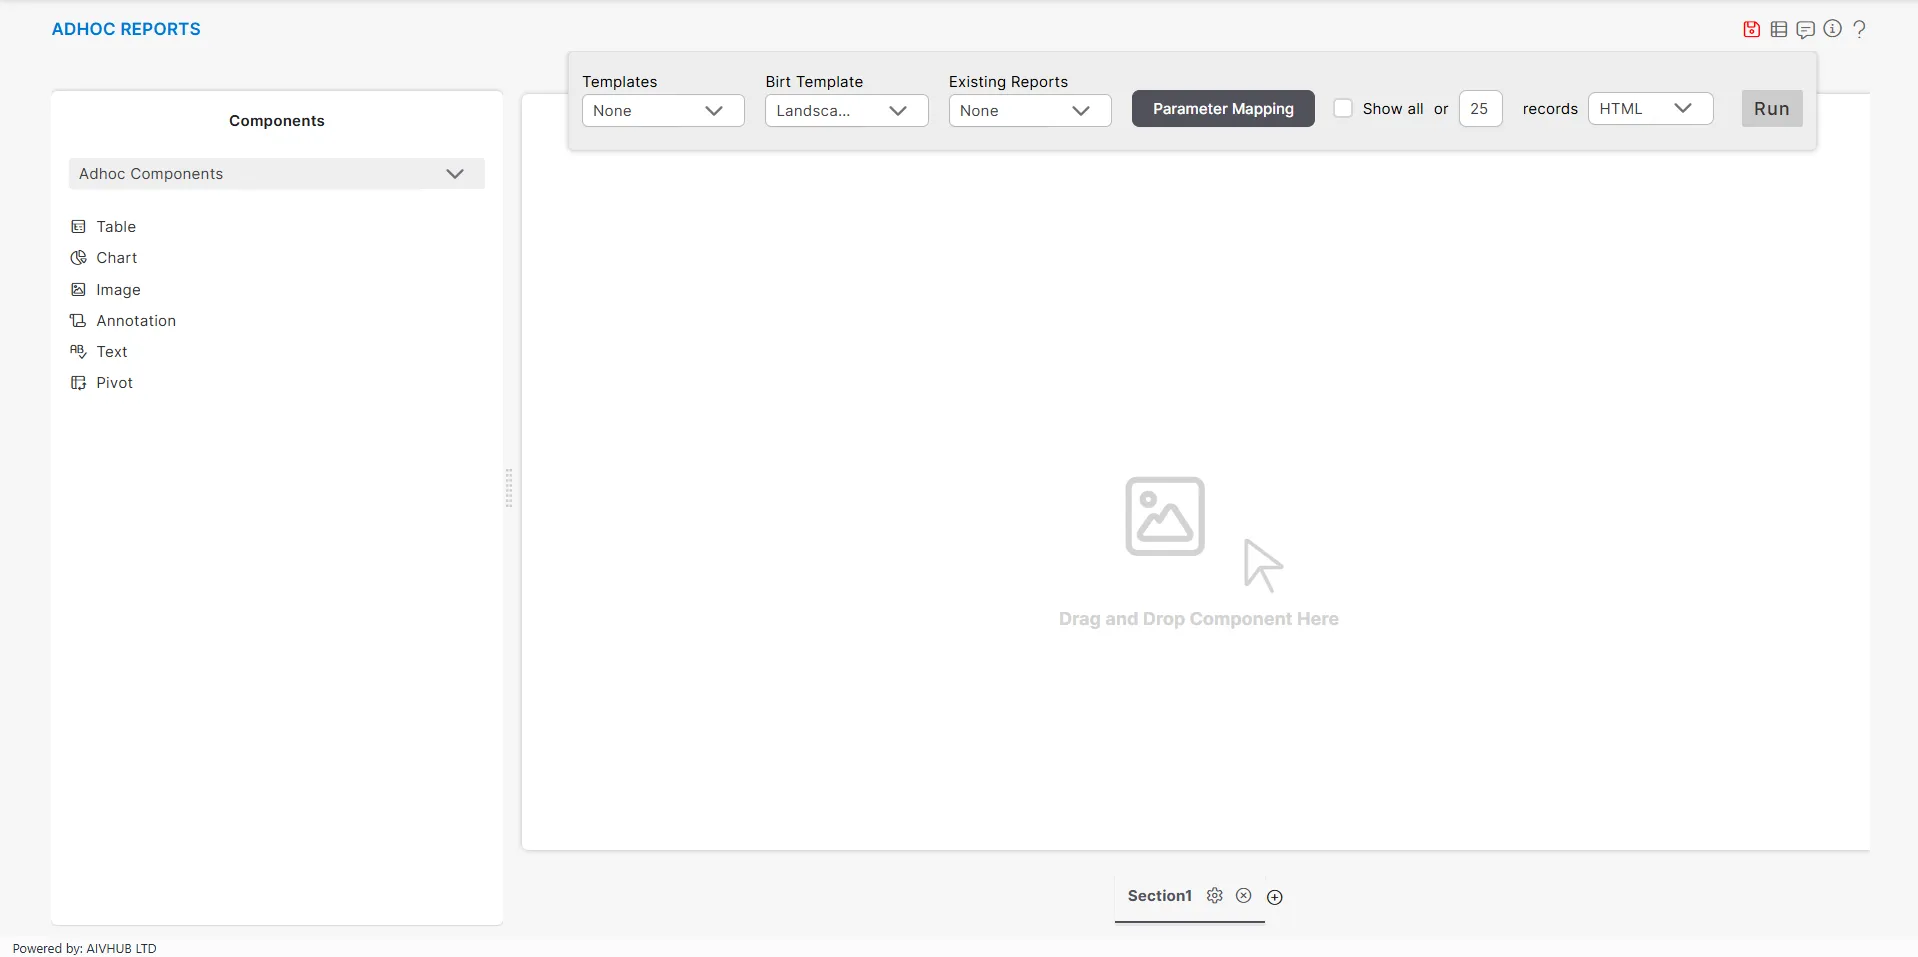
Drag & Drop Table component to the empty area as shown below:
-
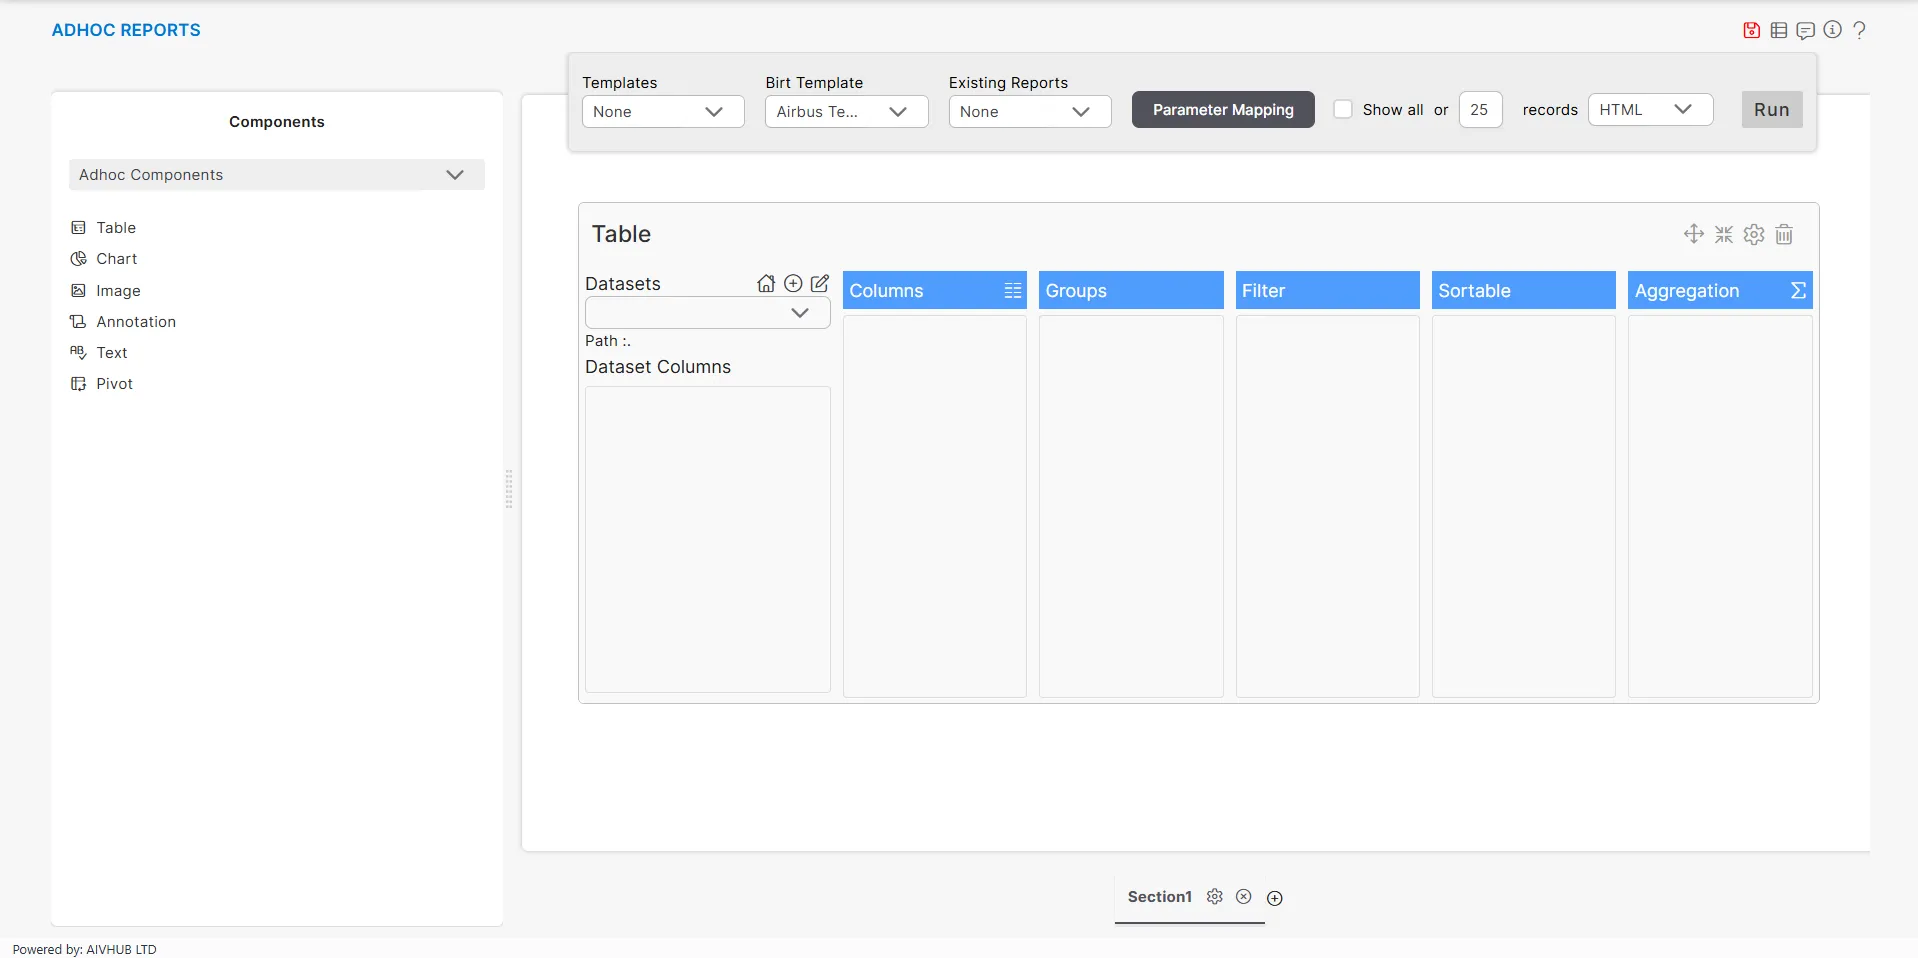
As user performs the above step, a window will appear as per the image below:

-
Now from the drop down list of Datasets select the Sales.ds as follows:
-
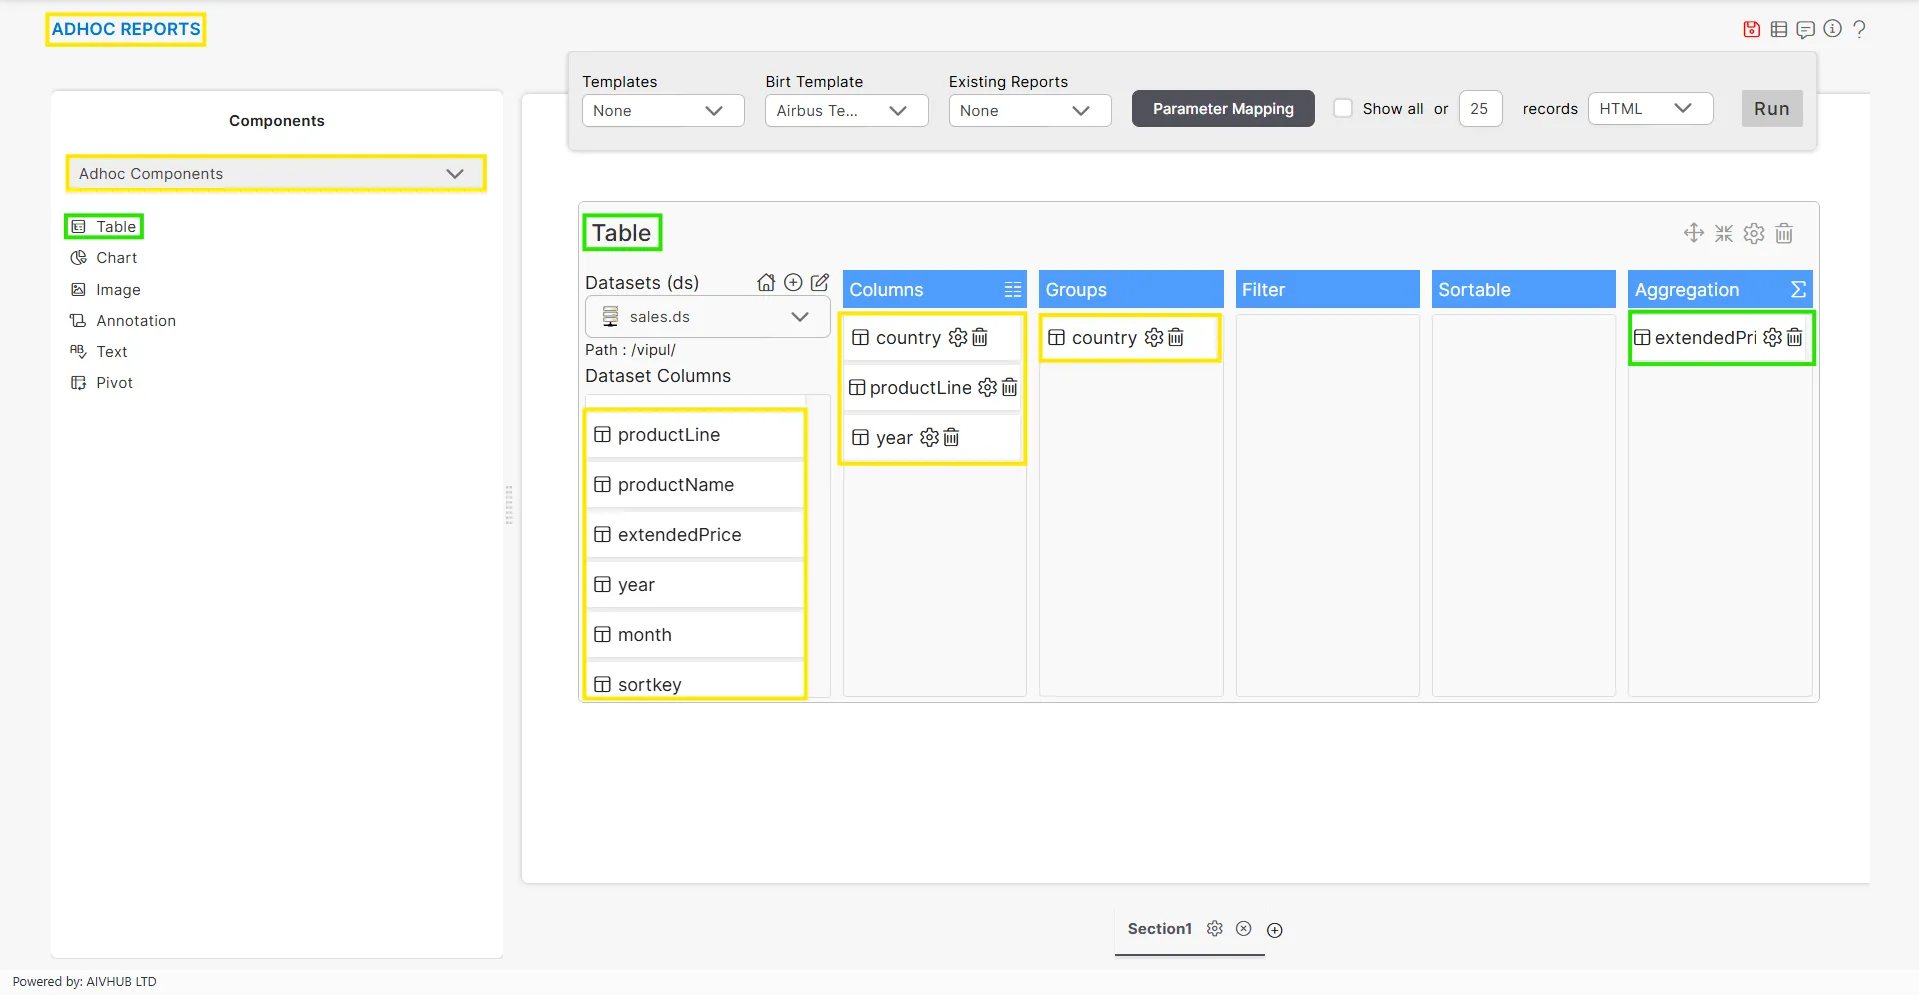
Drag country , productLine ,and year into the Columns field from Dataset Columns. Similarly, drag country into the Groups field and extendedPrice into the Aggregation field.
Group Sorting
-
The user can apply sorting on a column added to the Groups section. To do this, click the
 icon located to the right of the grouped column, as shown in the image below:
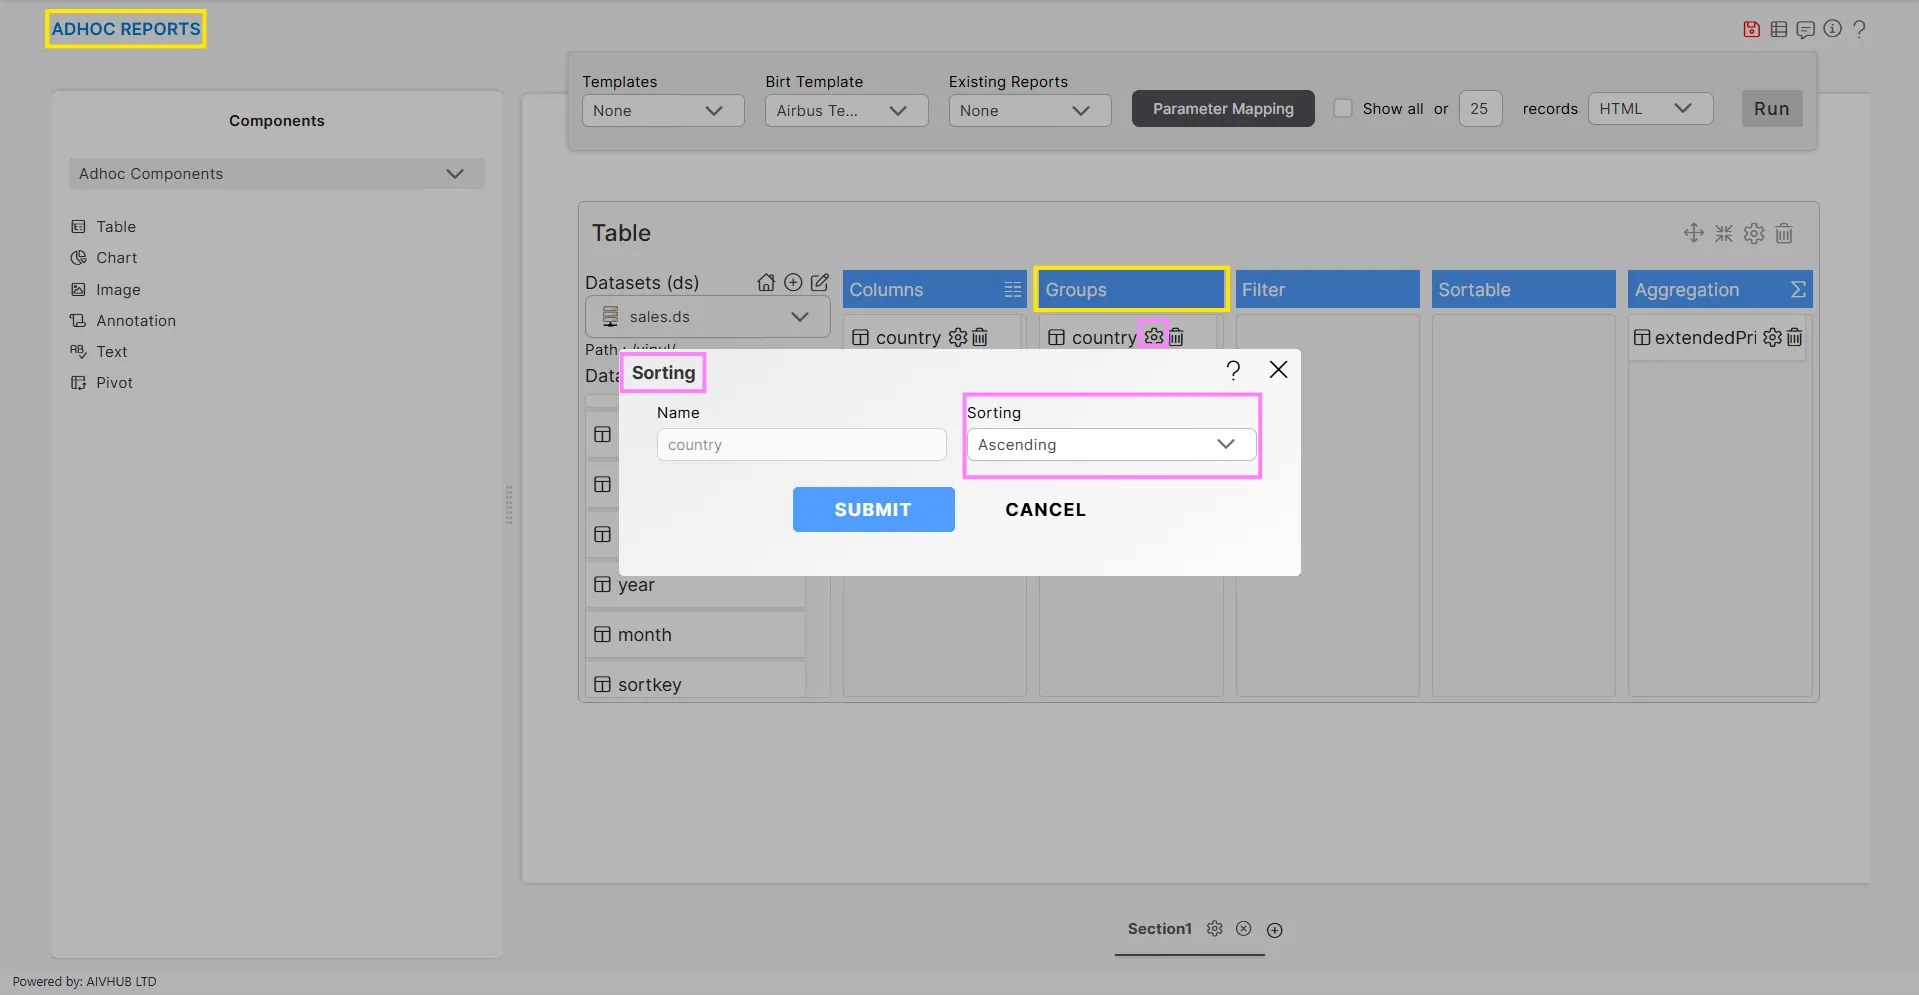
-
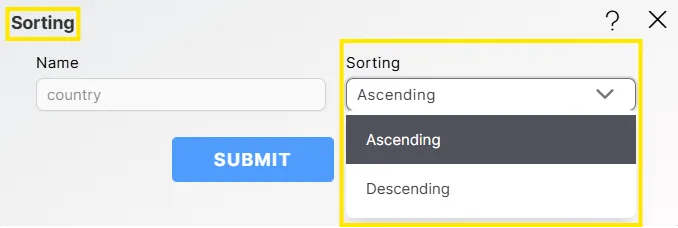
Click on drop-down of Sorting as shown below:
-
Select the type of sorting you want to apply on the column and click on
 . For this example: select Ascending Type.
 -
Now, when you run the report, the results will be grouped by the selected Group column, and the groups will appear in the sorting order you configured.
-
Click the
located next to extendedPrice in the Aggregation section. Your screen will then look as shown below: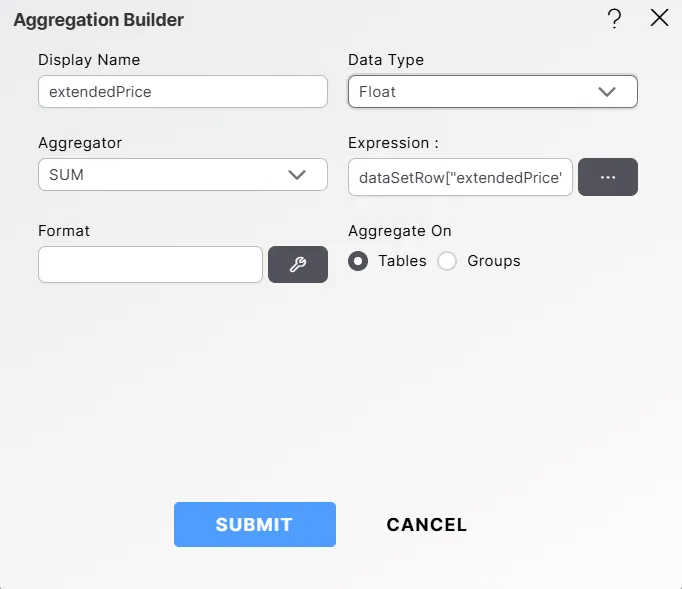
-
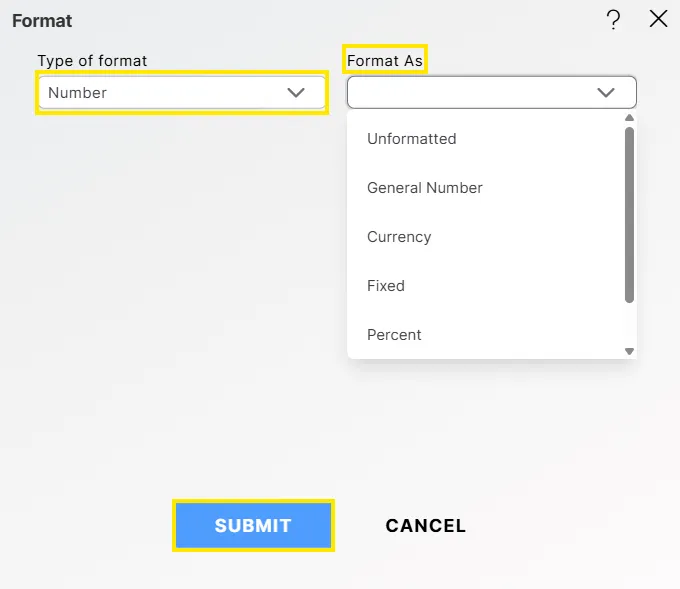
You can specify the format by clicking the
 icon next to the Format field. This opens the following dialog box:
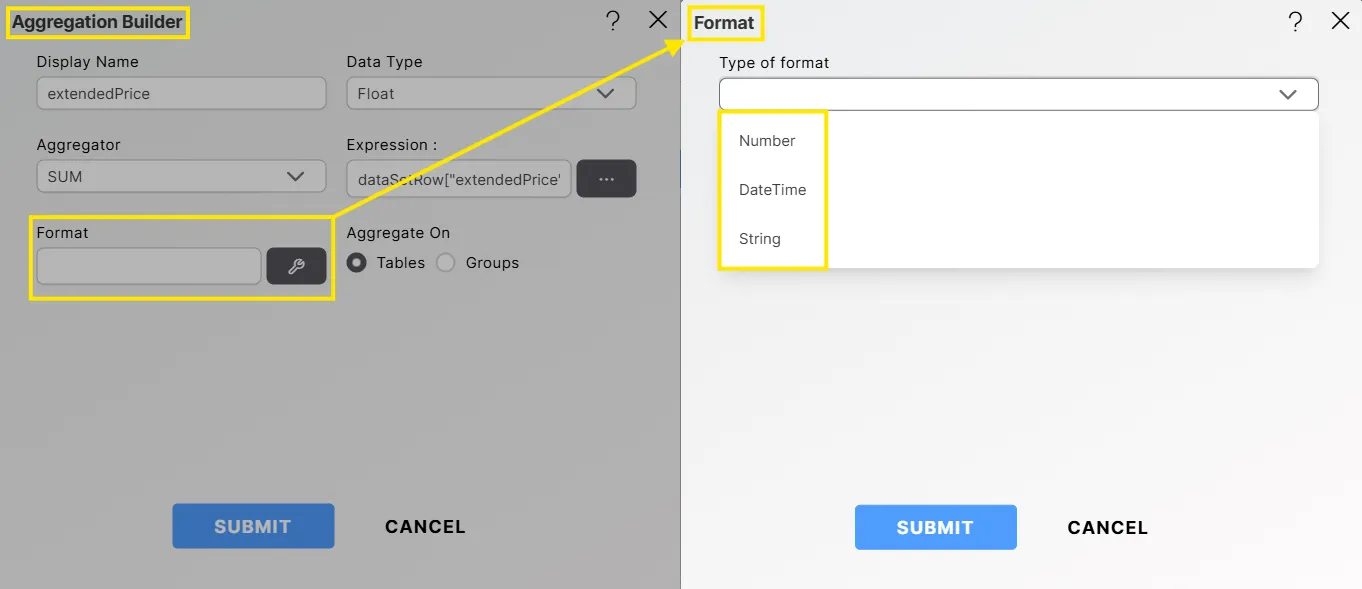
-
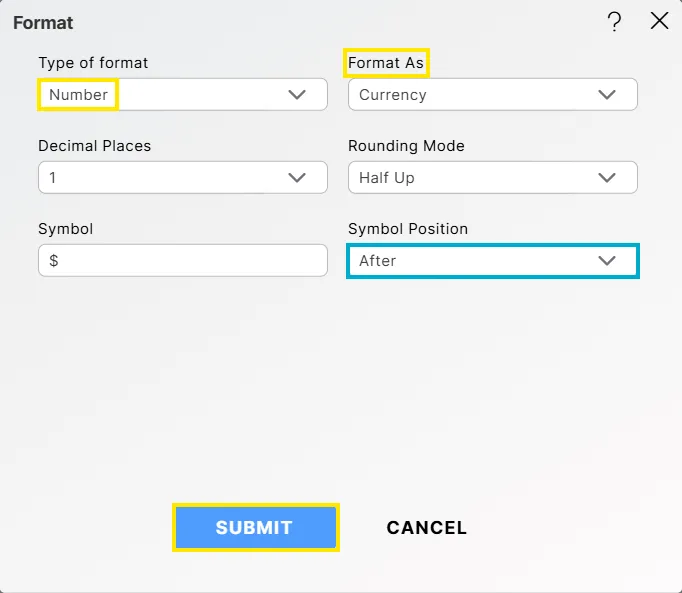
Select the required Format and Format As values from the dropdown. Once you click the Submit
button, the window will update as shown below:
-
Fill the below detail:
Symbol: $
-
Click the Submit
button, and the window will appear as shown below: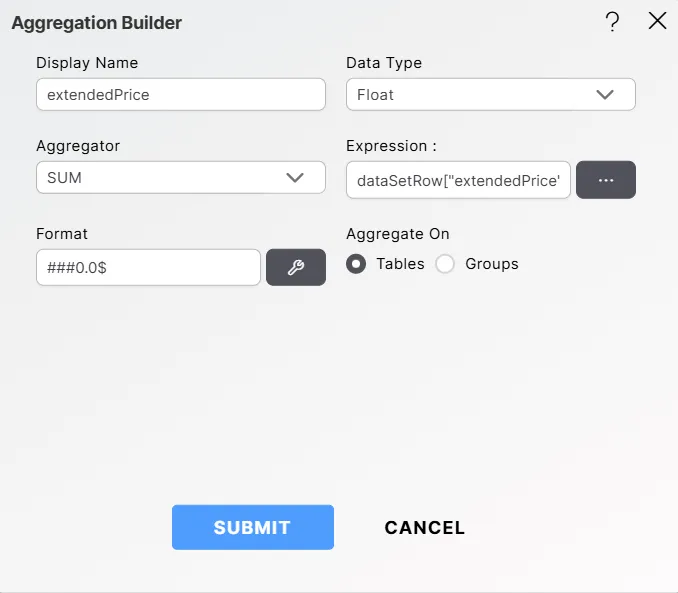
-
In Aggregate On radio button select Groups & Select Country in Group drop-down:
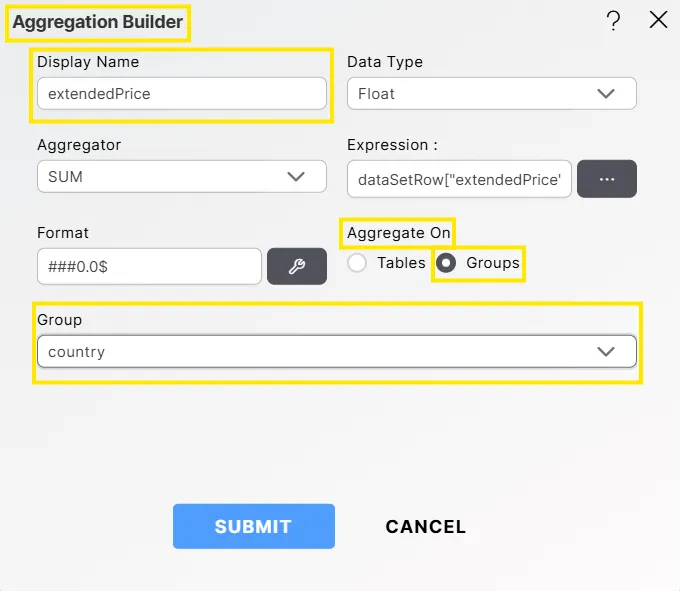
-
Click on
button to Save the changes. -
Select Landscape View from the Birt Template drop-down as shown:
-
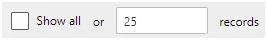
You can also specify the number of records to display per page using the widget located near the format selector:
-
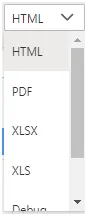
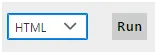
The user can select the format in which they want to run the report from the dropdown next to the Run option.
-
For this example, we select run as HTML.
-
Clicking on Run option, will open the following dialog box:
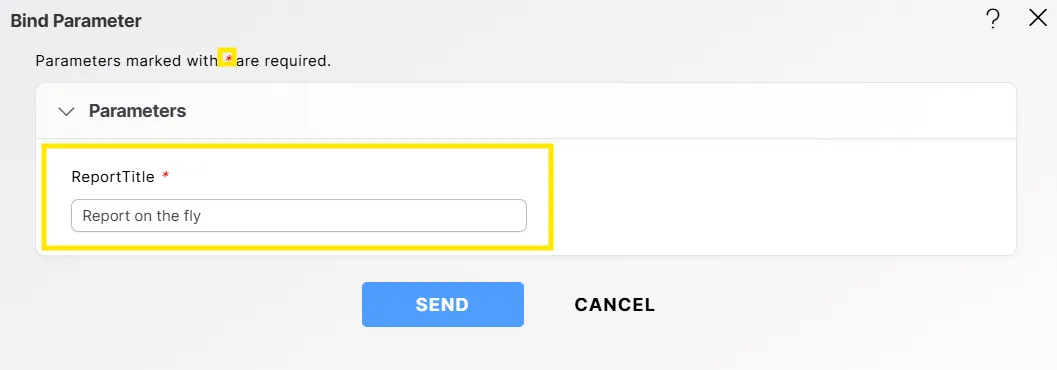
-
Since the datset has no parameters, the user clicks the SEND button, and it redirects them to a new tab in the browser.
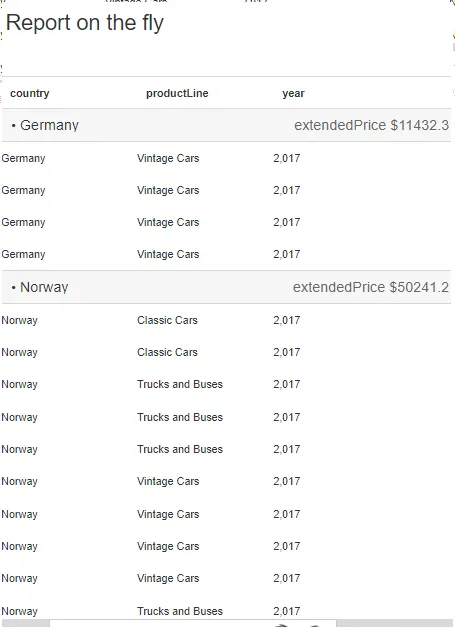
-
The Adhoc Report using Table component will be generated in HTML.
-
If you want to save your table, click the Save
 icon located at the top-right corner. This will open the following dialog box:
-
You can provide a custom name in the text field and choose whether to save it as a Reports or a Template.
-
For this example: give Name: AisReport and Select Save As: Reports and click on submit
button to perform the save operation. -
If you want to change the settings of a widget click on
below Run which will open the following dialog box: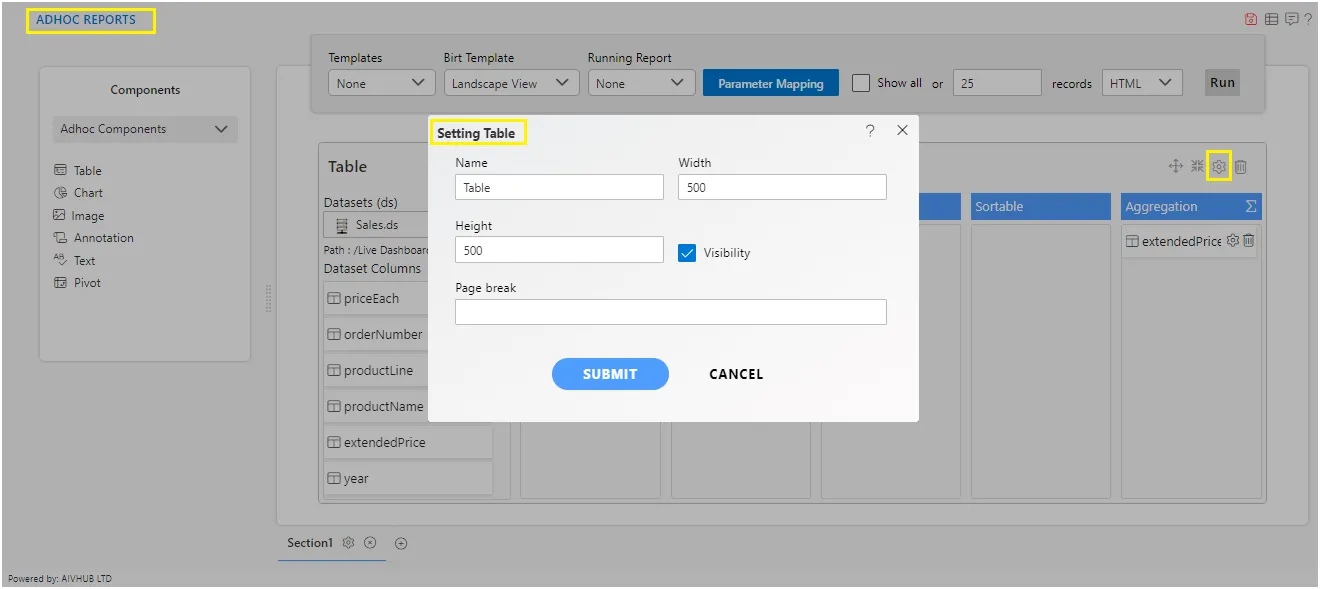
-
Similarly, click the Delete
 icon to remove the table component.
The following graphical elements are available in Adhoc reports:
Adhoc Chart
Adhoc Image
Adhoc Annotation
Adhoc Text
Adhoc Pivot
Adhoc Pre-defined Components
Bind Parameters
Adhoc Embed Link