Introduction
Adhoc reporting allows new users to create reports effortlessly using a drag-and-drop mechanism to insert graphical elements like charts onto the content page. It is a business intelligence process designed for quickly generating reports on an as-needed basis, typically presenting information visually to facilitate instant insights. These reports display data in tables or charts, answering questions that are not pre-defined in standard production reports.
To learn more about the importance of adhoc reporting, please click here.
An adhoc report is generated on the fly, presenting information in tables or charts to address questions that have not been pre-defined in production reports.
Ad-hoc Report: This video explains how to create adhoc report within the application.
Creating an Ad-hoc Report
-
There are three ways to add an Ad-hoc Report in the application:
-
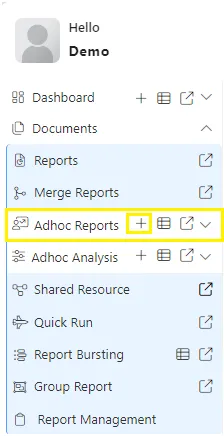
From the Hamburger menu
 , navigate to Documents > Adhoc Reports. Then, click the (+) icon next to “Adhoc Reports”, as illustrated in the figure below:
-
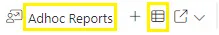
Click on the Adhoc Reports grid, as shown in the figure below:
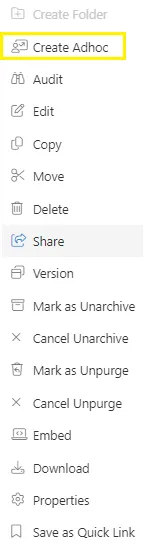
- Right-click on any empty area in the list view and choose Create Adhoc from the context menu.
- Right-click on any empty area in the list view and choose Create Adhoc from the context menu.
-
Click the Create Adhoc button located in the bottom horizontal menu bar, as shown in the figure below:

-
-
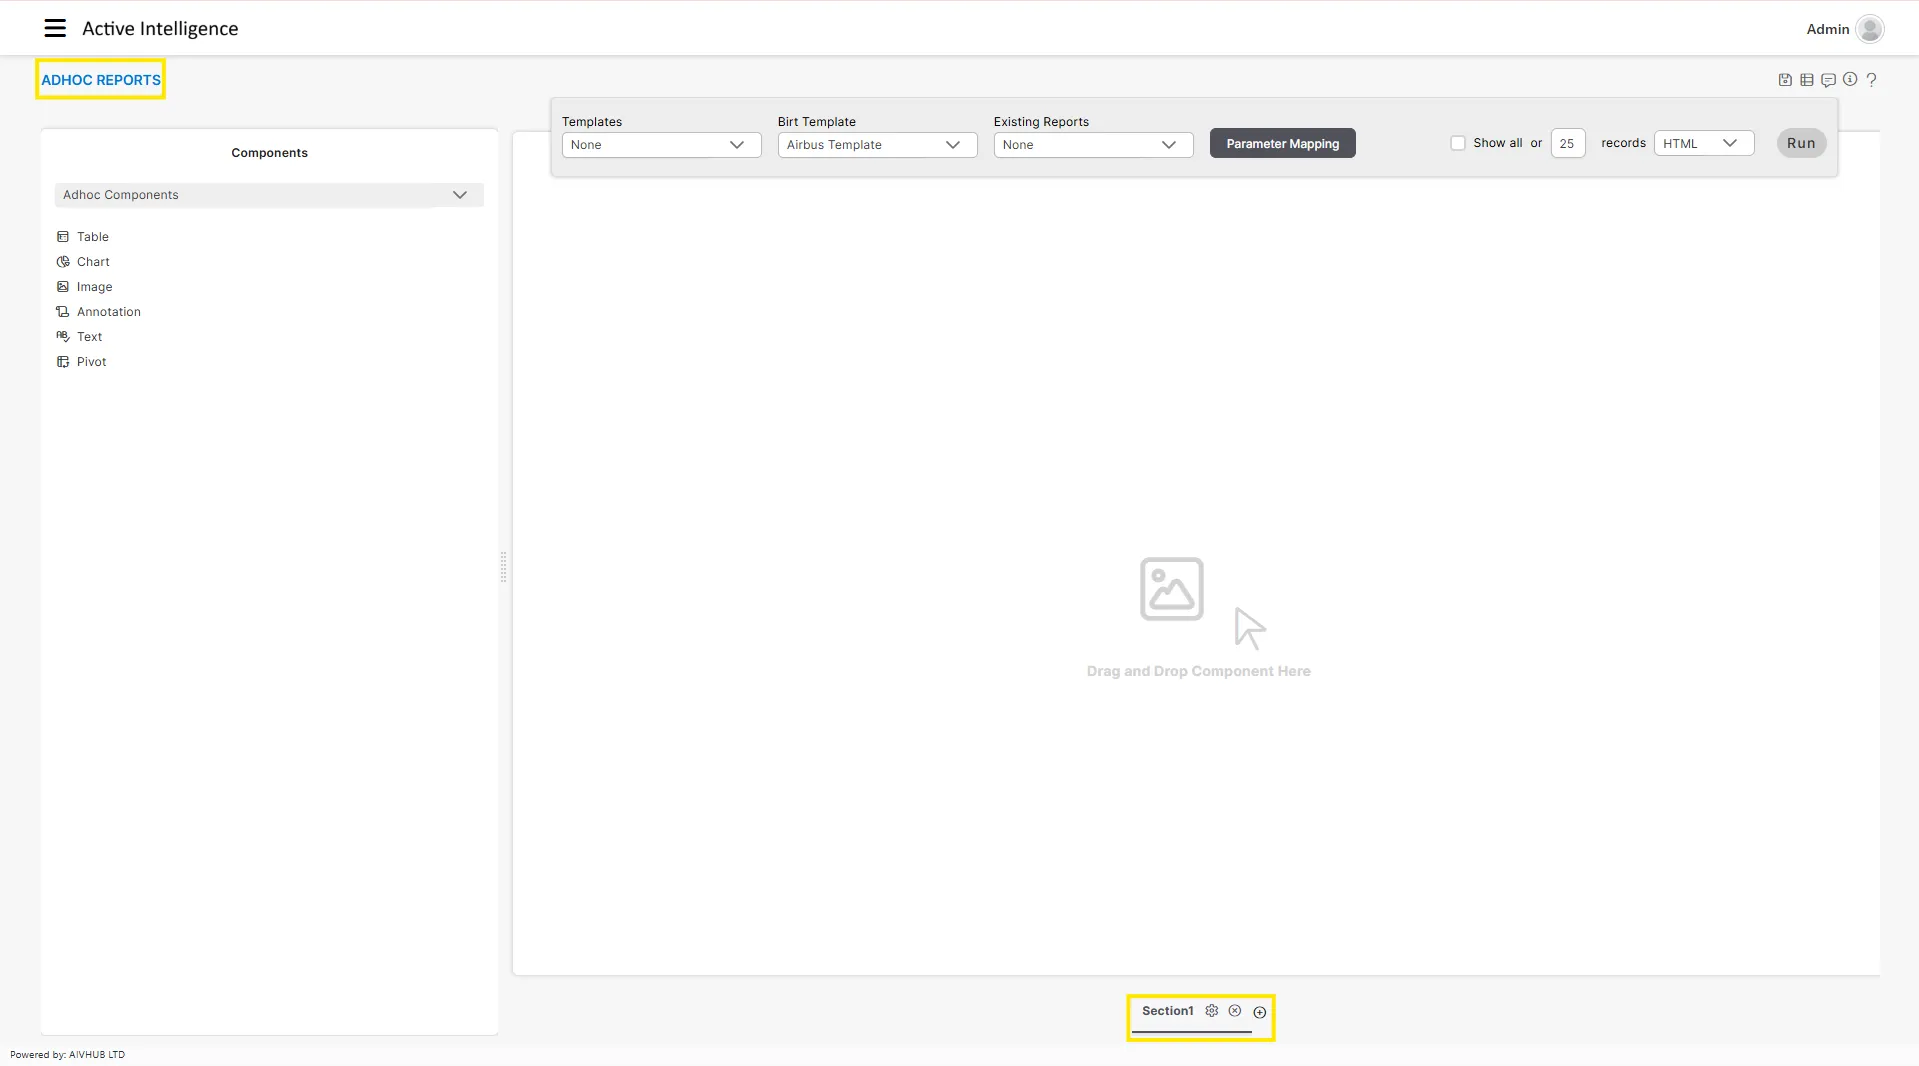
The adhoc report creation screen will appear as shown in the image below:
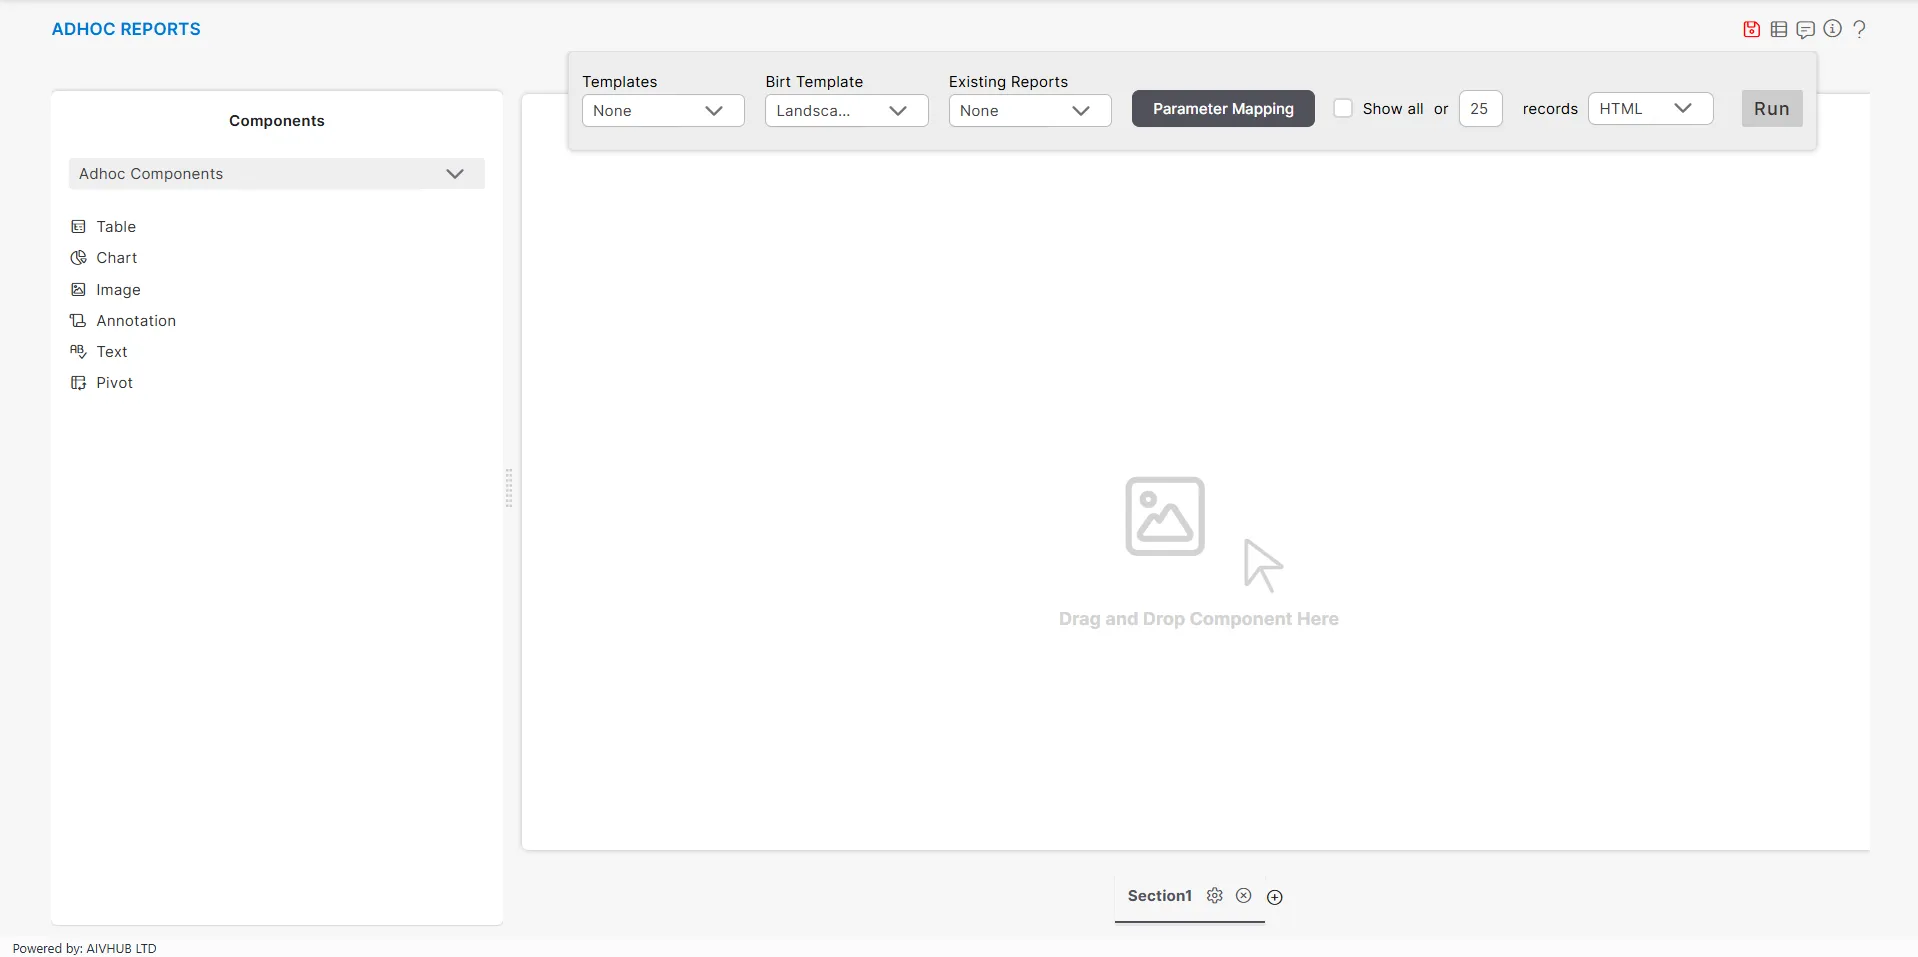
Components Menu
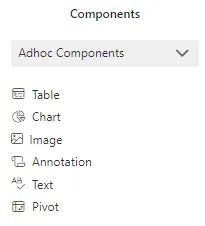
In the Components panel on the left, you will find two types of components:
-
Ad-hoc Components: These include Table, Chart, Image, Annotation, Text, and Pivot. Users can drag and drop these components from the left panel into the center canvas area to display them in the adhoc report.
-
Predefined Library: A pre-defined component created in BIRT can be uploaded in the Shared Resources section (e.g., .rptlibrary), after which it becomes available in the Predefined Library for use in Adhoc Reports.
Adhoc Top-Menu Bar

-
Templates : If you have saved any templates within AIV and want to reuse them in another report, you can select them from here. This section shows the templates already created in AIV.
-
BIRT Template: This displays the list of BIRT templates that have been uploaded in the Shared Resource section. These templates can be used while creating an ad-hoc report.
-
Existing Reports: This section shows the list of previously saved adhoc reports.
-
Show All: When this option is enabled, the report displays all available records. When it is turned off, the report shows only the number of records entered in the textbox beside it. Only one of these options can be used at a time.
-
Parameter Mapping: Clicking the Parameter Mapping button allows users to view and verify the parameters mapped to the report.
-
Output Type Dropdown: This dropdown allows users to select the desired output format for the report, such as HTML, PDF, XLSX, XLS, Debug, or PPTX.
-
Run: The Run button executes the report. Upon clicking it, a parameters dialog box appears, allowing the user to specify the report title and configure bind parameters.
Section
The Sections area in the adhoc report interface allows users to add and organize different components of the report into distinct, manageable sections. Using these sections helps users focus on specific elements of the report, resulting in a more structured and navigable layout. This functionality ensures that various data visualizations and insights are clearly separated, improving the overall readability and usability of the report.
-
Adding Section: Users can add additional sections by clicking the plus (+) icon next to Section1. When selected, a dialog box opens where users can enter a title in the Tab Name field and choose a Master Page. The available Master Page options depend on the template type being used:
- CoverPage: Typically used for introductory or title pages.Cover Page is selected by default.
- BIRT Template: When a BIRT template is selected, the Master Page options shown are based entirely on the Master Pages defined inside that specific BIRT template. These may include pages such as CoverPage, Default, Landscape View, or any custom Master Pages designed by the template creator. The names and options will vary depending on how the BIRT template was configured.
-
Templates (AIV Templates): When using an AIV-saved template, only the Default Master Page is available.
-
Editing Section: Users can edit a section by clicking on the settings (
 ) icon beside the section name. This edit option allows users to edit the section name and set the master page from options like CoverPage, Default, or LandscapeView.
Save Reports
The Save icon is located at the top-right corner of the adhoc report creation section. It allows users to save the particular report or to save any changes made.
![]()
When the user clicks on the Save icon, the Save As dialog box appears on the screen. From here, the user can add a name and choose to save it as a Report or Template.
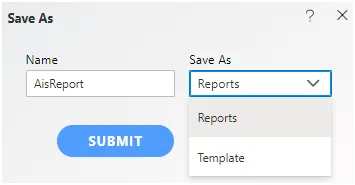
If the user selects the Template option while saving an adhoc report, the saved template becomes available in both the Ad-hoc Reports List View and the Templates dropdown for future use.
The following graphical elements are available in Ad-hoc Reports:
Adhoc Table
Adhoc Chart
Adhoc Image
Adhoc Annotation
Adhoc Text
Adhoc Pivot
Adhoc Pre-defined Components
Bind Parameters
Adhoc Embed Link