Create Reverse Join Pipeline
Create Reverse Joinin Pipeline.
Introduction
The introduction of the pipeline represents a novel addition to the AIV Application, enabling users to establish relationships between various datasets and tables through an intuitive user interface. With the pipeline feature, users can effortlessly perform joins between tables and datasets within AIV without requiring any SQL expertise.
Earlier, to join Tables to get combined data from various tables user has to write SQL Queries and it requires a good understanding of SQL Queries to do so. One who knows how to write SQL Queries can only able to get data from the source so Business users are dependent on a person who knows SQL. It is no longer the case when you use Pipeline to fetch data and apply joins between tables with the drag and drop facility provided in Pipeline.
Prerequisites
Before creating a Reverse Join Pipeline, ensure you have functioning Datasets (JDBC) and a comprehensive list of tables and views.
Objective
How to create reverse Join in Pipeline.
Download Pipeline.zip file from the link given Pipeline.zip
Follow steps to create Reverse Join Pipeline in AIV:-
To complete the task, follow these steps:
- Open the AIV (Artificial Intelligence Visualization) application.
- Log in using valid user credentials (username and password).
- Once logged in, navigate to the “Master Data” section. This can typically be accessed from the Hamburger menu, which is usually represented by three horizontal lines stacked on top of each other, often located in the top-left corner of the application interface.
- In the “Master Data” section, select the “Dataset” option from the available menu items. If you encounter any issues or need further assistance, feel free to ask!
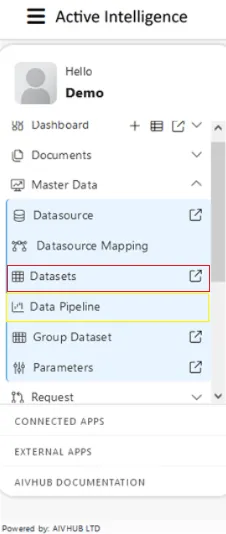
To create a pipeline using the second method in AIV (Artificial Intelligence Visualization), Look for the option labeled “Create Pipeline” located in the bottom menu bar. Click on the “Create Pipeline” option to initiate the pipeline creation process. This method provides an alternative approach to creating a pipeline directly from the Dataset section, streamlining the process for users. If you encounter any difficulties or have further questions, feel free to ask!
![]()
Once you click, you’ll be directed to a blank create pipeline window, resembling the image below:
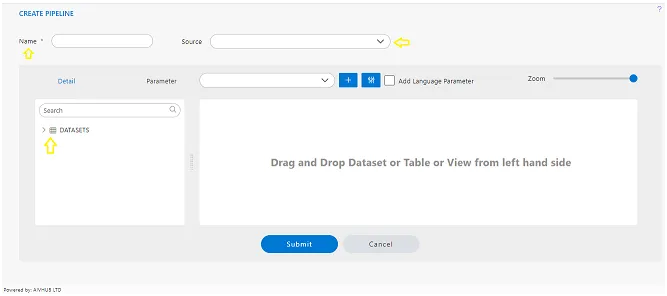
Enter the Following detail in the Pipeline dialog box:
Name: Reverse Join.
Source: aiv-mapping.
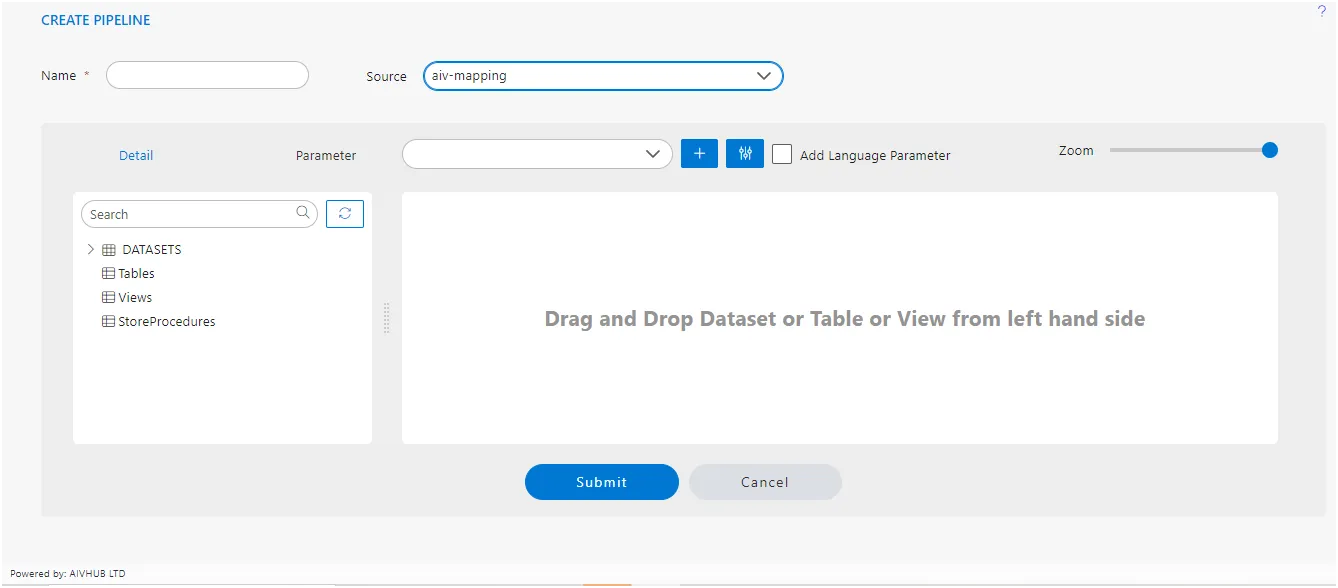
Expand tables from the left side datasets view, As shown in the figure below:
To complete this task, follow these steps:
-
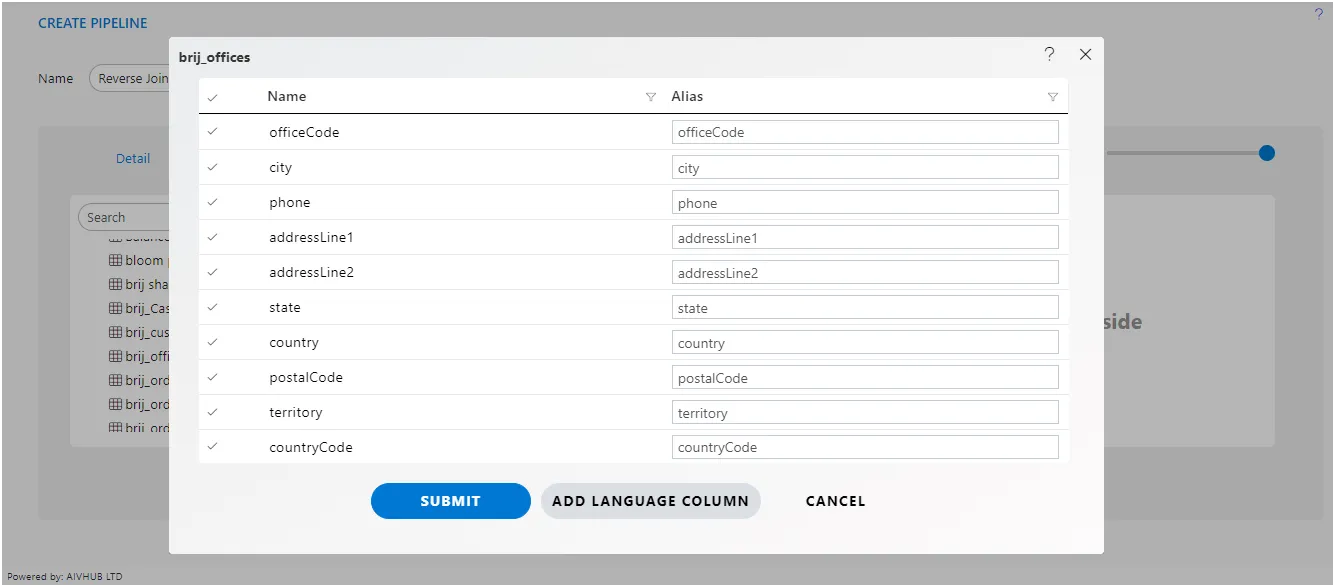
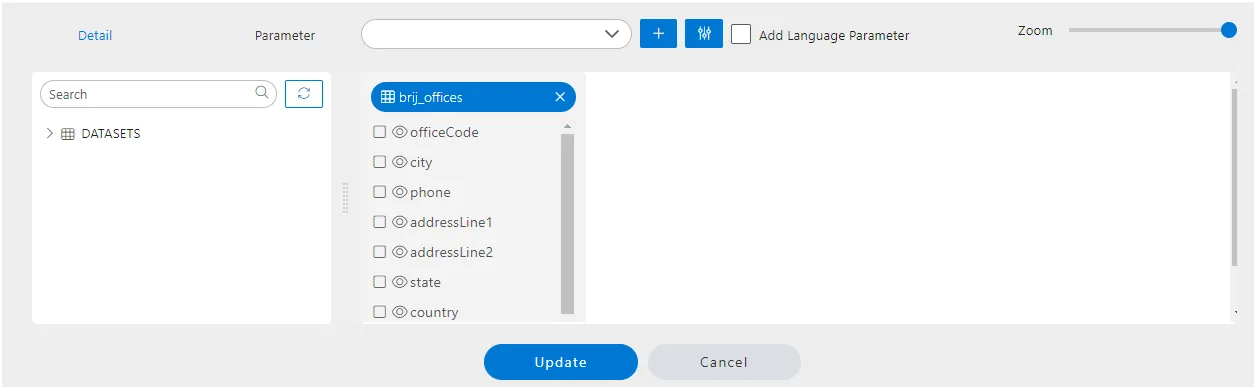
Locate the brij_offices datasets: In the datasets box, find the brij_offices datasets.
-
Drag brij_offices datasets to the Diagram Box: Click and hold on the brij_offices datasets in the datasets box, then drag it over to the diagram box on the right side.
-
Select All Columns: Once the brij_offices datasets is in the diagram box, you may need to double-click on it or right-click to bring up the “Select Column” dialog box. From there, look for an option to select all columns, typically labeled as “Select All” or something similar. Click on it to ensure all columns from the brij_offices datasets are selected.
-
Confirm Selection: After selecting all columns, confirm your selection or close the dialog box to apply the changes.
By following these steps, you should have successfully dragged the brij_offices datasets to the diagram box and selected all its columns. If you encounter any specific issues or need further assistance, feel free to ask!
Click on Submit button, after dragging & drop the brij_offices datasets in the diagram box, look like the figure below:
To complete this task:
-
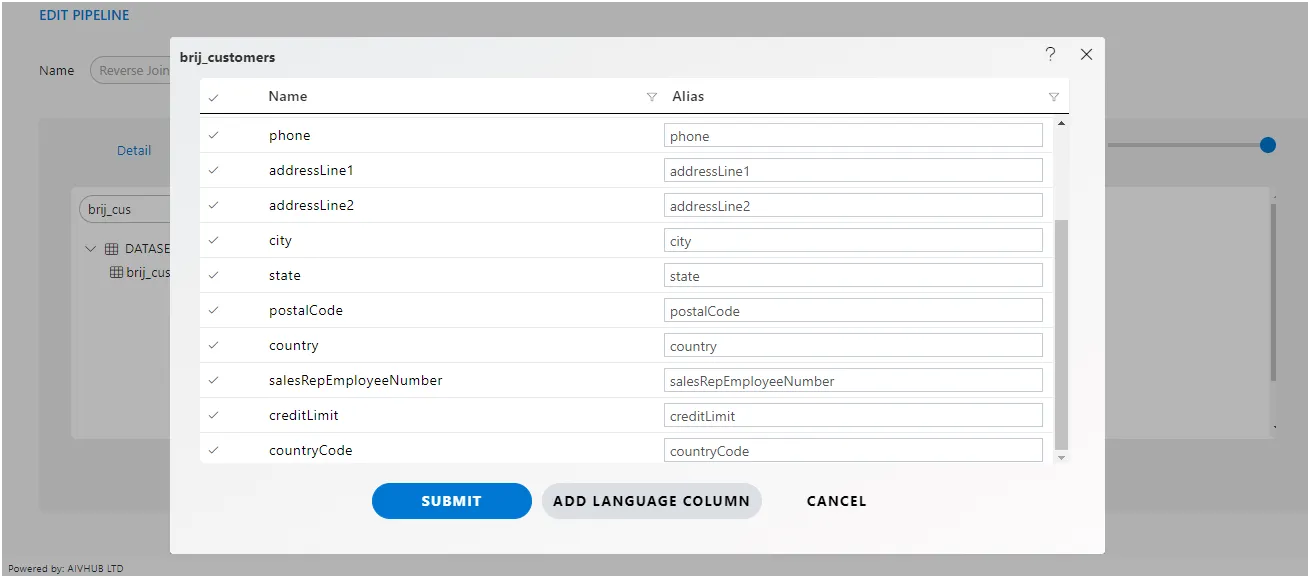
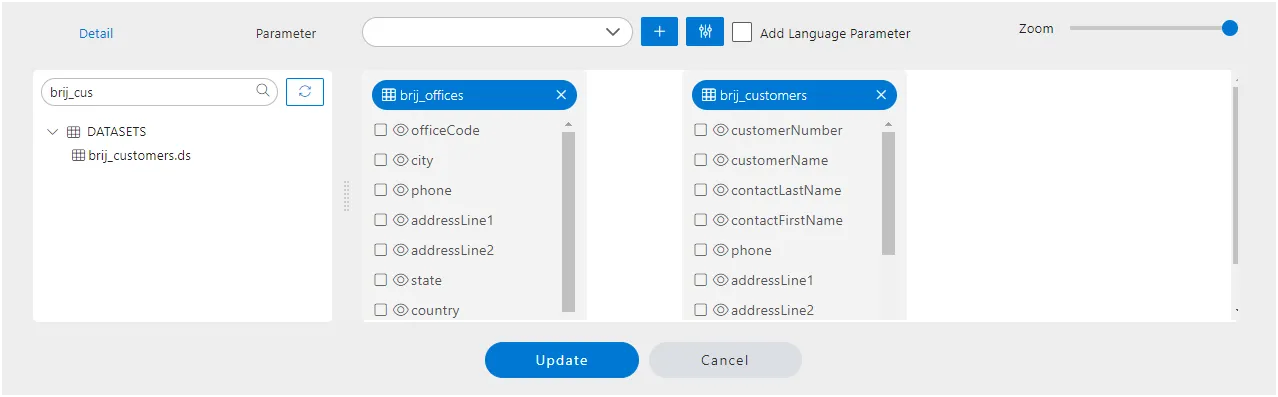
Locate the brij_customers datasets: Find the brij_customers datasets in the datasets box or wherever the tables are listed.
-
Drag brij_customers datasets to Diagram Box: Click and hold on the brij_customers datasets, then drag it over to the diagram box.
-
Select All Columns: Once the brij_customers datasets is in the diagram box, double-click on it or right-click to bring up the “Select Columns” dialog box. Look for an option to select all columns, usually labeled “Select All” or something similar. Click on it to ensure all columns from the brij_customers datasets are selected.
-
Confirm Selection: After selecting all columns, confirm your selection or close the dialog box to apply the changes.
After completing these steps, you should have successfully dragged and dropped the brij_customers datasets into the diagram box and selected all its columns. If you need further assistance, feel free to ask!
Click on submit button, brij_offices and brij_customers datasets from the diagram box will look like the figure below:
To accomplish this task:
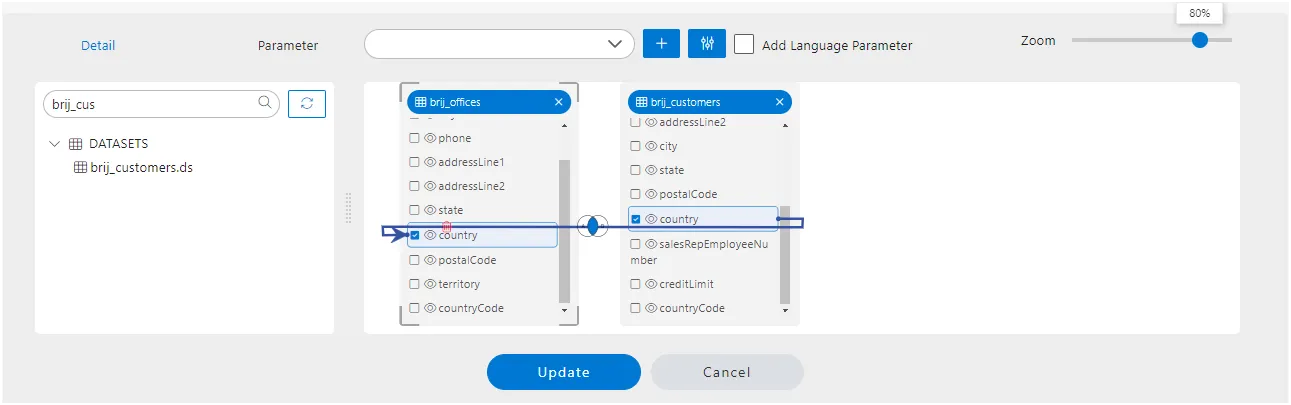
Locate the COUNTRY Column: In the diagram box where both the brij_offices and brij_customers datasets are present, find the COUNTRY column within the brij_customers datasets.
Drag COUNTRY Column: Click and hold on the COUNTRY column within the brij_customers datasets, then drag it over to the brij_offices datasets in the diagram box.
Drop COUNTRY Column: Once you’ve dragged the COUNTRY column over the brij_offices datasets, release the mouse button to drop the column onto the brij_offices datasets.
After completing these steps, the COUNTRY column from the brij_customers datasets should be successfully added to the brij_offices datasets. If you encounter any issues or need further assistance.
Click on the Update button to save the pipeline and apply your changes. After clicking "Submit," you may receive a confirmation message indicating that the pipeline has been successfully saved.
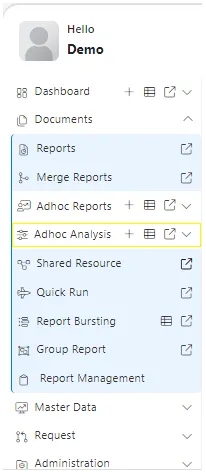
To execute the pipeline in the Adhoc Analysis:
- Navigate to the
"Documents"section within the Hamburger menu. - Select the
"Adhoc Analysis"option.` - Within the Adhoc Analysis interface, locate and click on the
"+"icon to initiate the creation of a new analysis. This process enables the execution of the pipeline within the Adhoc Analysis environment, allowing for further analysis and exploration of the pipeline results.
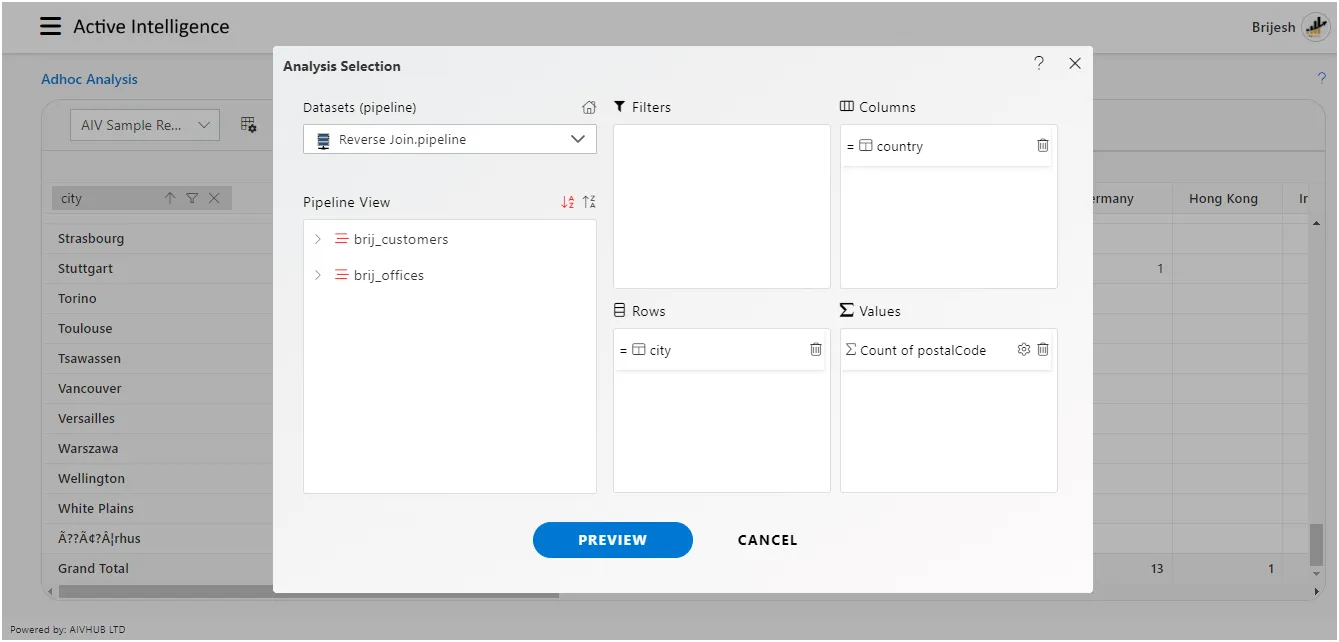
When you click on create Analysis then the Analysis Selection dialog box will open, as shown in the figure below:
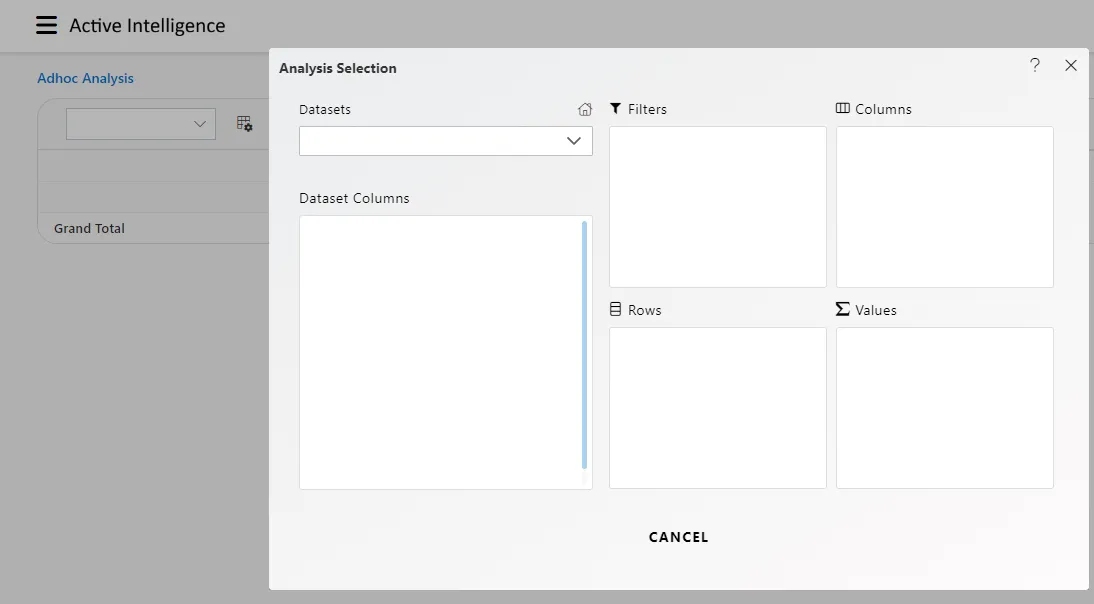
Enter the following details in Analysis Section:
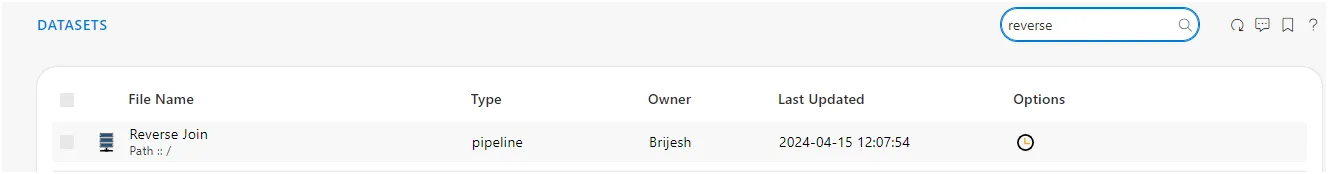
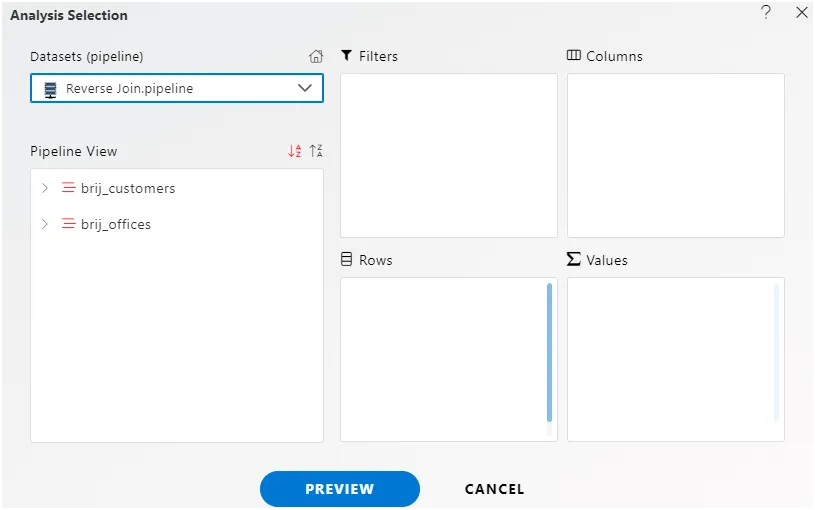
Dataset: Reverse Join (select the Pipeline, which you are created)
The two tables will get load the left side box of Pipeline view, Now expends the brij_offices datasets, as shown in the figure below:
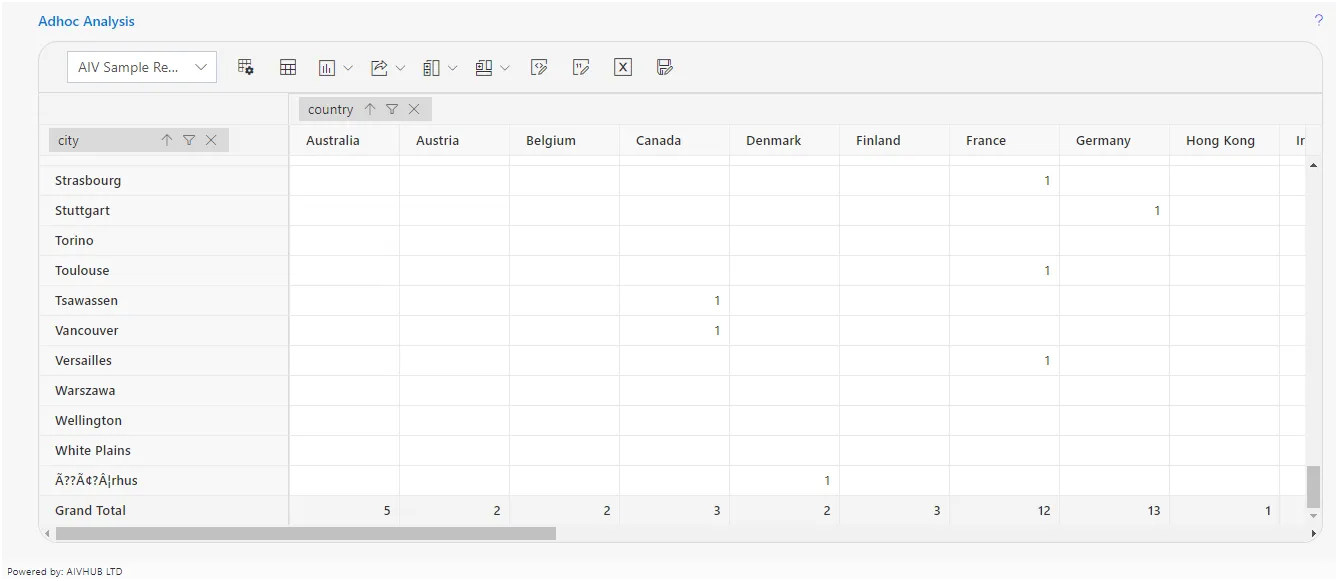
To complete this task:
-
Drag CITY Column to Rows: Locate the CITY column within the brij_customers datasets in the diagram box. Click and hold on the CITY column, then drag it over to the Rows area.
-
Drag Country Column to Columns: Find the COUNTRY column within the brij_customers datasets. Click and hold on the COUNTRY column, then drag it over to the Columns area.
-
Drag Postal Code Column to Values: Locate the POSTAL CODE column within the brij_customers datasets. Click and hold on the POSTAL CODE column, then drag it over to the Values area. While dragging, ensure to specify “count” as the type.
After completing these steps, the CITY column should be in the Rows area, the COUNTRY column in the Columns area, and the POSTAL CODE column with “count” selected as the type should be in the Values area.
If you have any further questions or need assistance with any step, feel free to ask!:
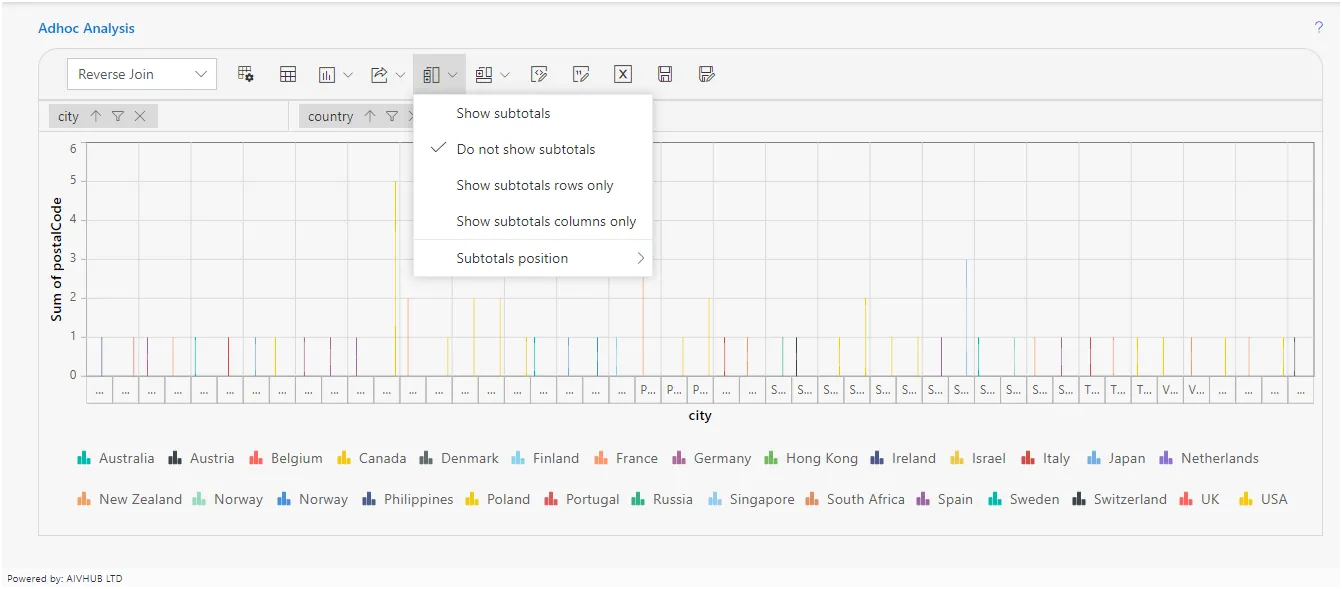
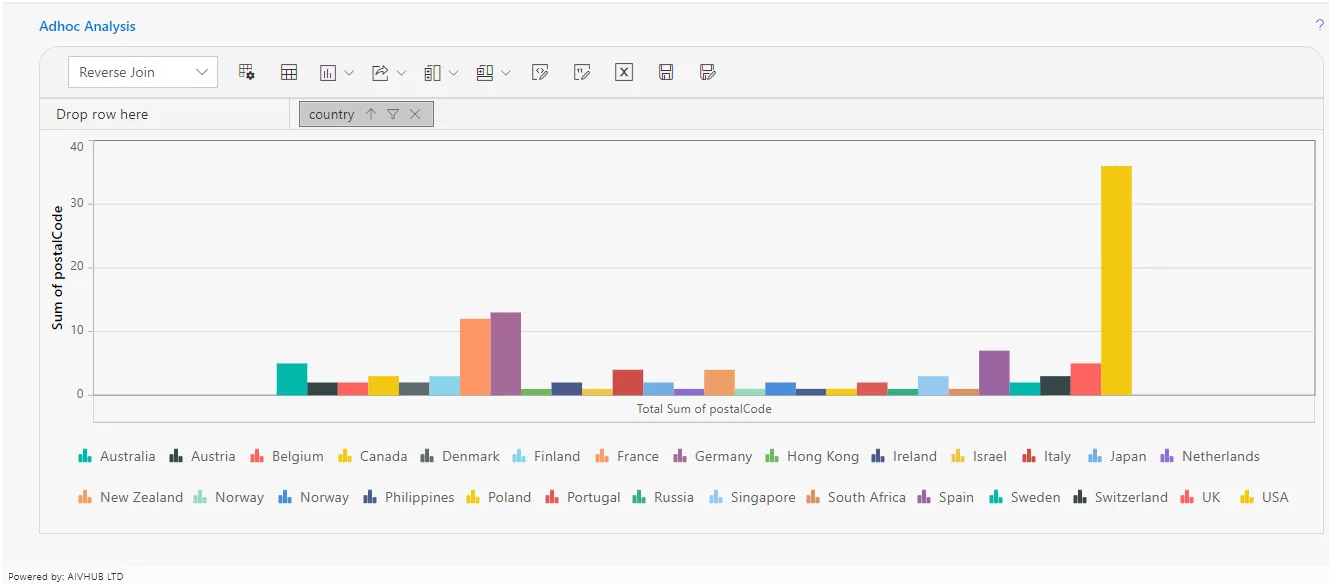
Click on Preview Button it will show the output and after the preview click on Cancel Button it will show the screen as follows:
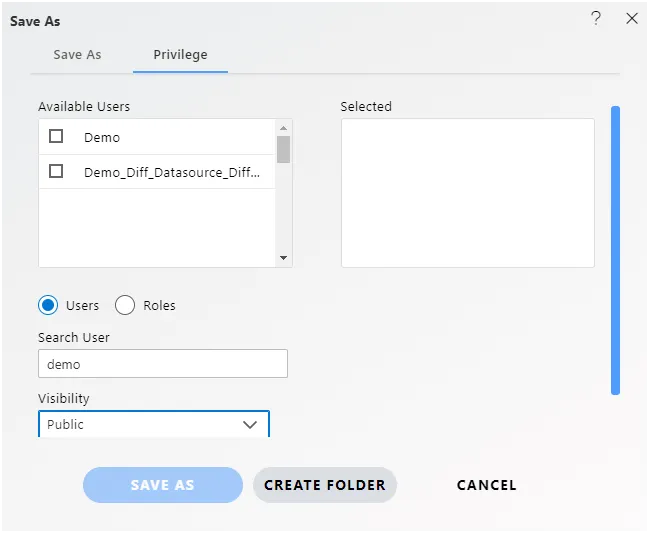
Click on Save as icon for saving the Analysis, it will show the screen as below:
Give the name of Analysis.
Name: Reverse Join Pipeline. Select the folder where you want to save Analysis, as shown in the figure below:
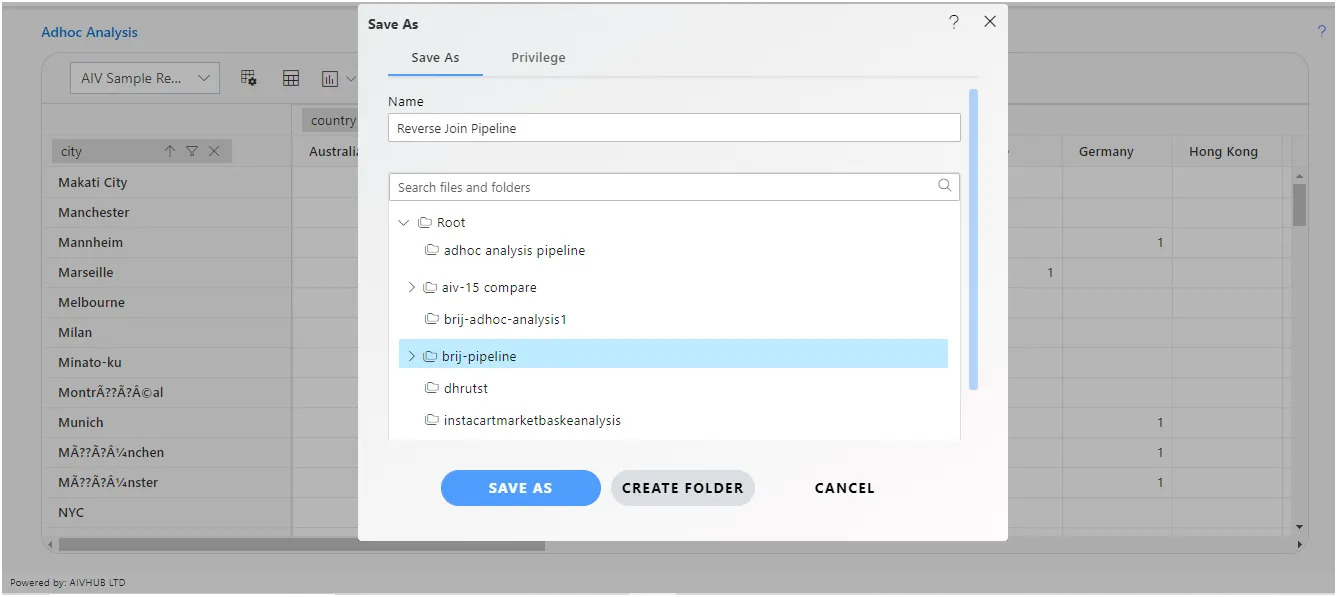
Click on Save As button to save Analysis.
Ad hoc analysis in AIV (Analytics and Insight Visualization) offers several benefits:
Quick Insights: AIV allows users to perform ad hoc analysis on their data, enabling them to quickly gain insights without the need for pre-defined reports or queries. This agility can be crucial in rapidly evolving business environments.
Flexibility: With AIV’s ad hoc analysis capabilities, users can explore data from various angles, apply filters, and drill down into specific details to answer specific questions or investigate trends, all in real-time. This flexibility empowers users to tailor their analysis to suit their needs.
Data Exploration: Ad hoc analysis in AIV facilitates data exploration by providing interactive visualization tools. Users can visualize data in different formats such as charts, graphs, and dashboards, making it easier to identify patterns, correlations, and outliers.
Self-Service Analytics: AIV’s ad hoc analysis feature promotes self-service analytics, allowing business users to independently analyze data without relying on IT or data experts. This reduces dependency and accelerates decision-making processes.
Iterative Analysis: Users can iteratively refine their analysis in AIV by adjusting parameters, adding or removing filters, and exploring alternative visualizations. This iterative approach fosters a deeper understanding of the data and enables users to uncover hidden insights.
Real-Time Decision Making: Ad hoc analysis in AIV enables real-time decision-making by providing instant access to up-to-date data. Users can quickly analyze the latest information and make informed decisions without delay.
Collaboration: AIV supports collaboration by allowing users to share their ad hoc analysis results with colleagues or stakeholders. This facilitates knowledge sharing, enhances transparency, and fosters collaboration across teams.
Overall, ad hoc analysis in AIV empowers users to explore data, gain insights, and make data-driven decisions more efficiently and effectivel.