Embed Pipeline
Embed Link Pipeline in AIV.
Introduction
This document serves as a comprehensive guide on leveraging embedded links to accomplish diverse functionalities. It delves into various methods of utilizing embedded links, covering topics such as generating or utilizing external embeds without bypass. When the bypass checkbox remains unchecked, users are required to incorporate their login password within the link to ensure its functionality within the browser.
Utilize the embed link to execute the report: This straightforward approach enables the integration of reports into your application. Through the embed link, you can seamlessly incorporate the output of your ad-hoc reports in a variety of formats directly within your application interface.
Objective
How to use Embed Link with Pipeline.
Download Pipeline.zip file from the link given Pipeline.zip
To complete the task, follow these steps:
- Open the AIV (Artificial Intelligence Visualization) application.
- Log in using valid user credentials (username and password).
- Once logged in, navigate to the “Master Data” section. This can typically be accessed from the Hamburger menu, which is usually represented by three horizontal lines stacked on top of each other, often located in the top-left corner of the application interface.
- In the “Master Data” section, select the “Dataset” option from the available menu items. If you encounter any issues or need further assistance, feel free to ask!
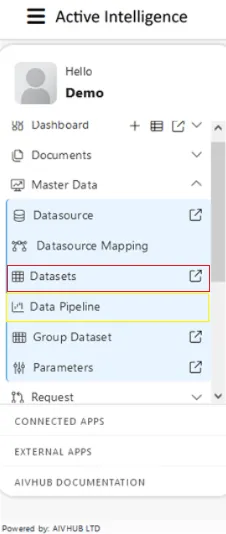
To create a pipeline using the second method in AIV (Artificial Intelligence Visualization), Look for the option labeled “Create Pipeline” located in the bottom menu bar. Click on the “Create Pipeline” option to initiate the pipeline creation process. This method provides an alternative approach to creating a pipeline directly from the Dataset section, streamlining the process for users. If you encounter any difficulties or have further questions, feel free to ask!
![]()
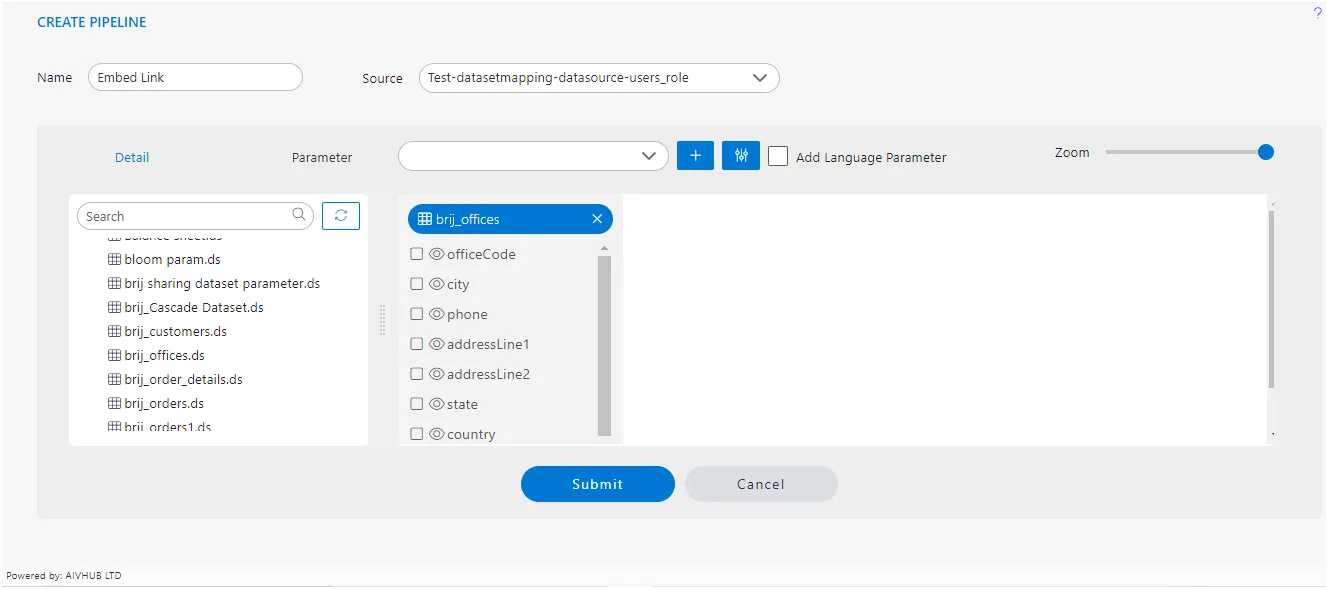
Once you click, you’ll be directed to a blank create pipeline window, resembling the image below:
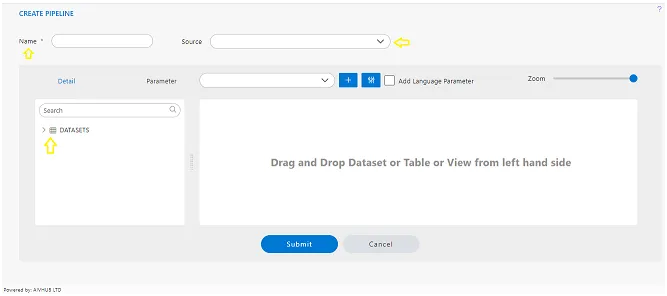
please provide the details you’d like to enter into the Pipeline dialog box, such as the dataset name, columns to select, or any other relevant information,
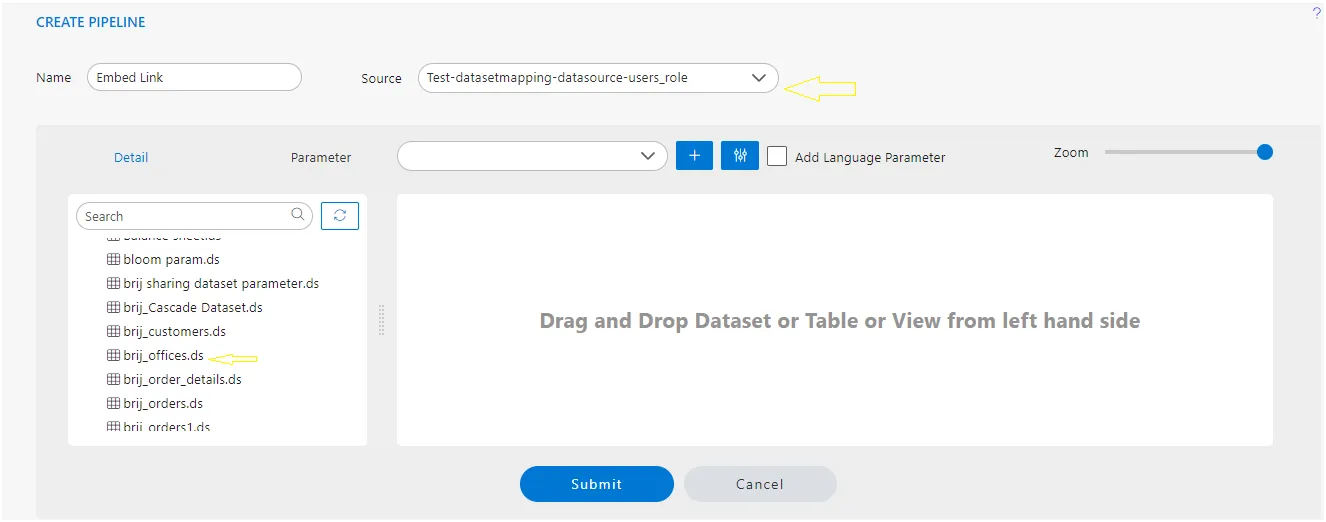
Name: Embed Link
Source: Test-datasetmapping-datasource-users_role
Expand dataset from the left side table view, As shown in the figure below:
To complete the task, follow these steps:
- Locate the
brij_officesdataset in the datasets list on the left side of the interface. - Click and hold the dataset name
brij_officeswith your mouse cursor. - Drag the dataset from the datasets list to the right side diagram box.
- Once the dataset is positioned in the diagram box, you can release the mouse button to drop it.
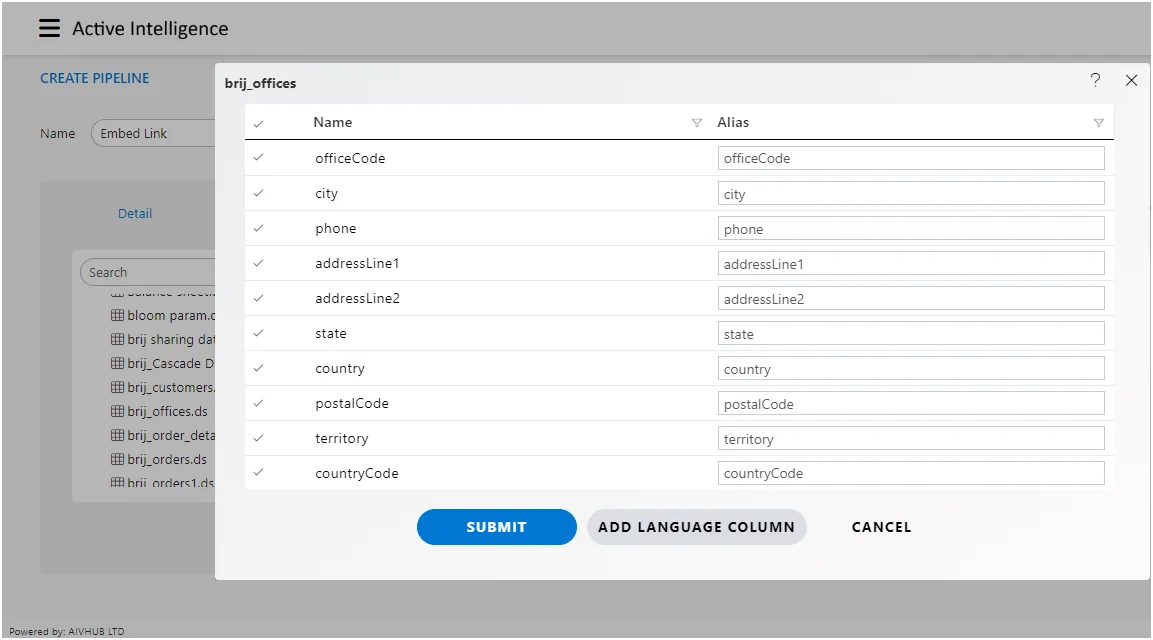
- To select all columns of the
brij_officesdataset, you may have an option to either click on a “Select All” button or manually select each column by checking the corresponding checkboxes next to their names. If you encounter any issues or need further assistance, feel free to ask!
After clicking the submit button for pipeline creation in AIV (Artificial Intelligence Visualization), the diagram box will typically display the pipeline structure or flow based on the configurations and selections made during the pipeline creation process. This could include visual representations of data sources, transformations, and destinations, depending on the design of the pipeline.
Please execute the action of dragging and dropping the dataset named brij_customers from the left dataset menu to the right diagram box..
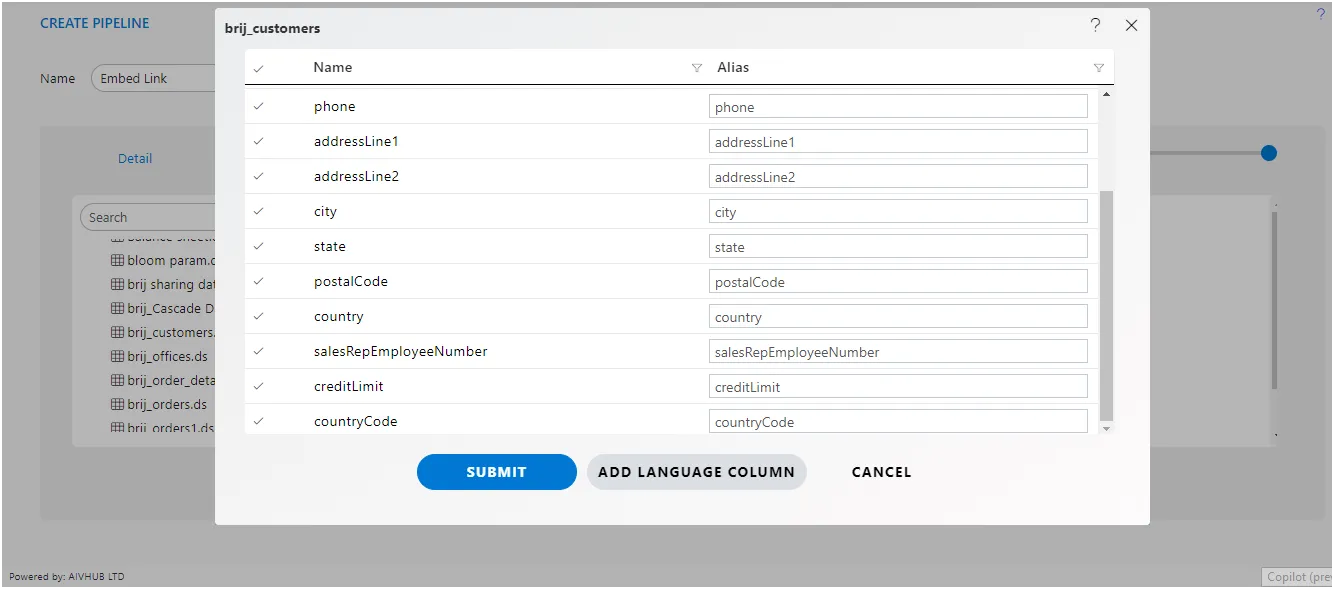
After selecting all columns from the brij_customers dataset, proceed by clicking the submit button.
After adding brij_offices and brij_customers from the datasets list, Drag the COUNTRY column from brij_offices to brij_customers, as shown in the figure below:
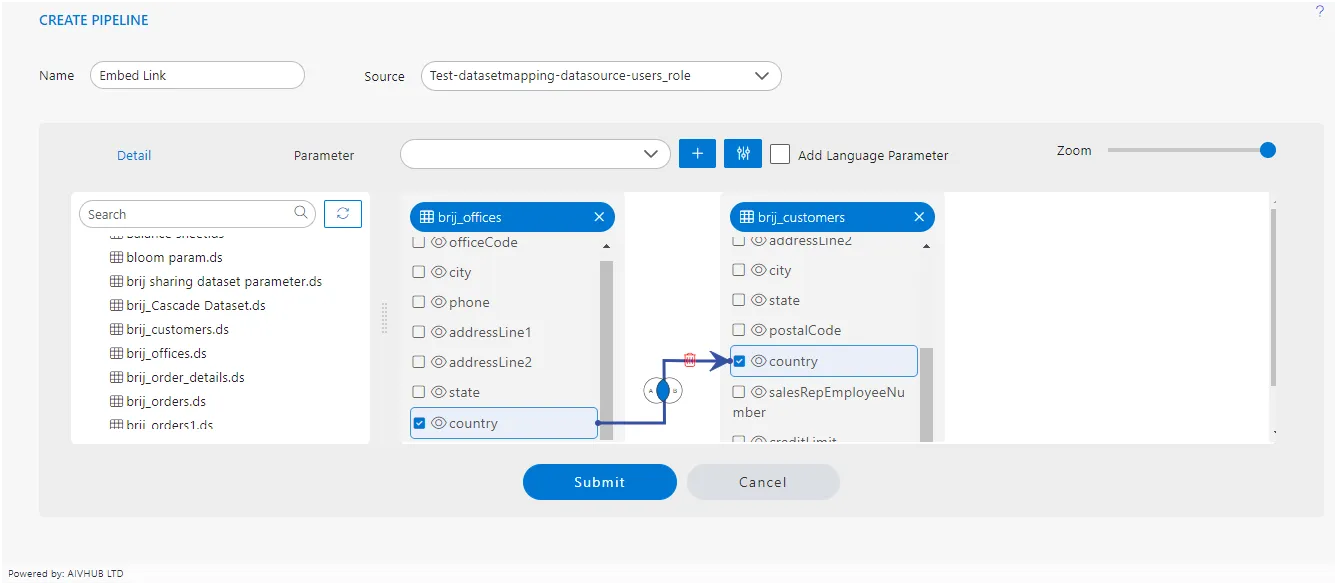
Click on Submit to save the Pipeline.
To execute the pipeline in the Adhoc Analysis:
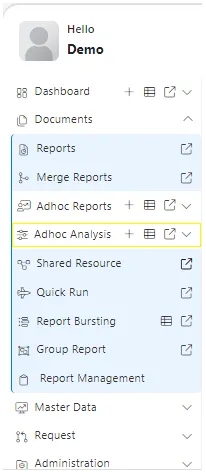
- Navigate to the “Documents” section within the Hamburger menu.
- Select the “Adhoc Analysis” option.
- Within the Adhoc Analysis interface, locate and click on the ”+” icon to initiate the creation of a new analysis. This process enables the execution of the pipeline within the Adhoc Analysis environment, allowing for further analysis and exploration of the pipeline results.
When you click on create Analysis then the Analysis Selection dialog box will open, as shown in the figure below:
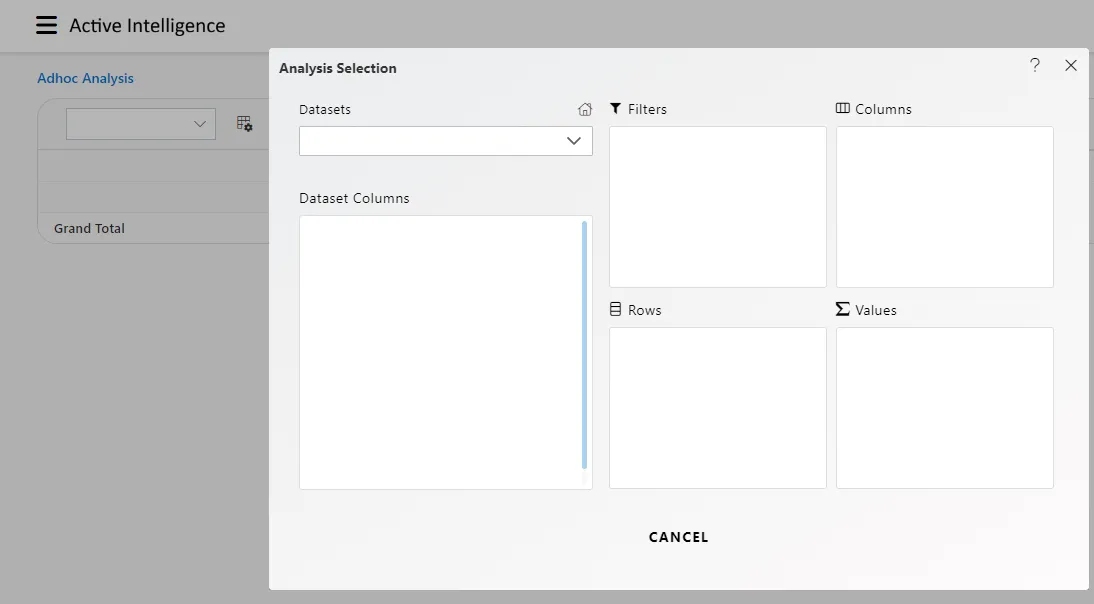
Enter the following details in Analysis Section:
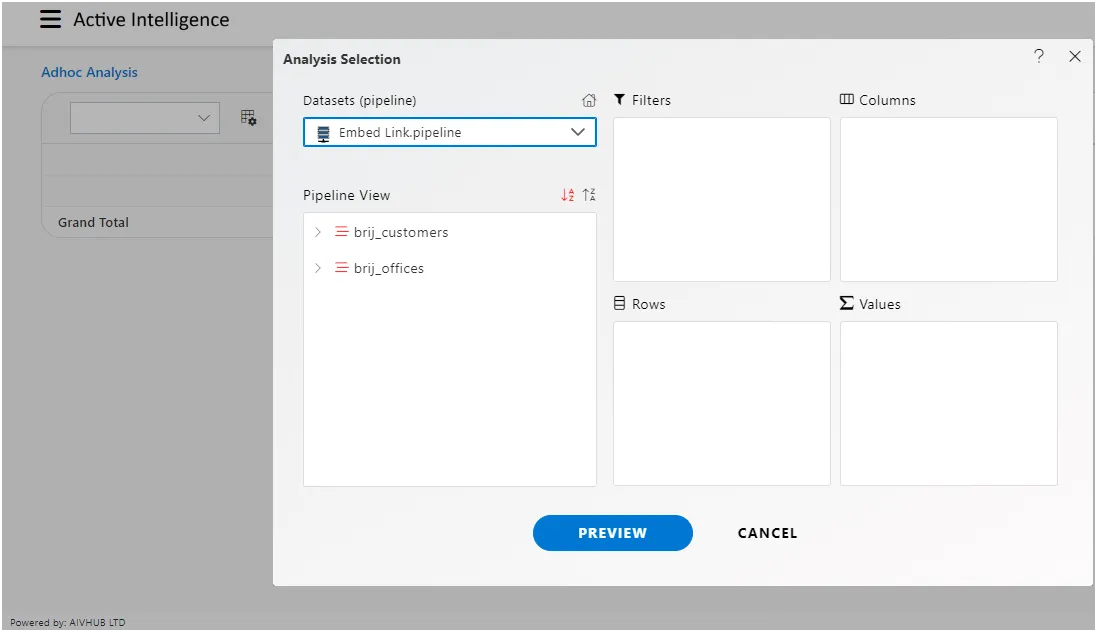
Dataset: Embed Link (select the Pipeline, which you are created)
The two tables will load into the left-side box of the Pipeline view, as depicted in the figure below.
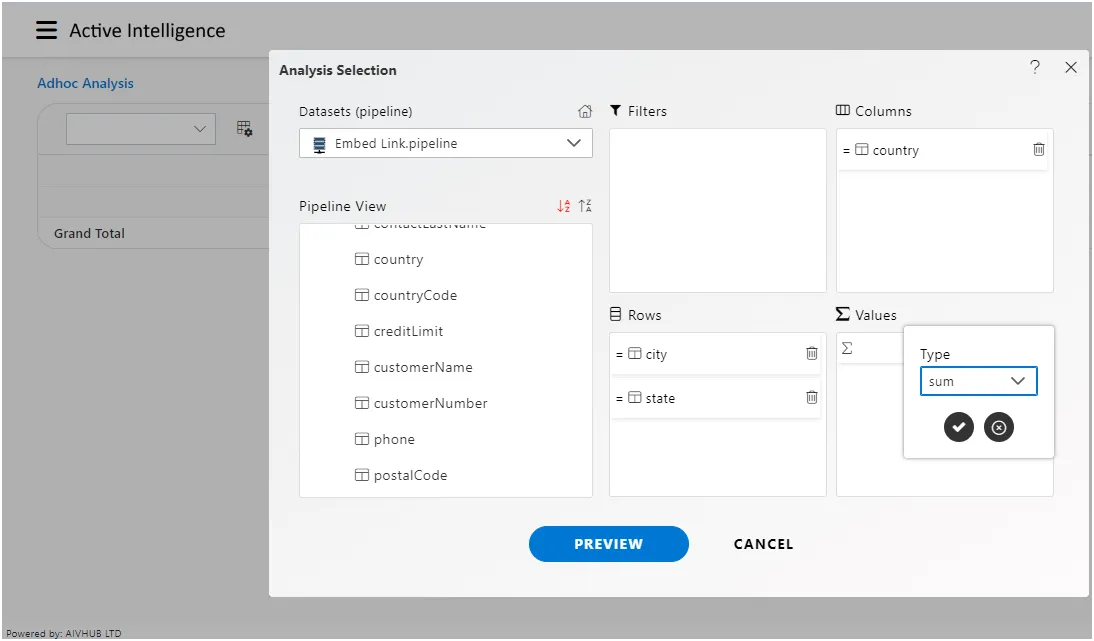
Please drag and drop the “City” and “State” columns from the brij_offices dataset to the Rows box. Next, drag and drop the Country column from the brij_customers dataset to the Columns box. Finally, drag and drop the Credit Limit column from the brij_customers dataset to the Values box, selecting sum as the type.
This arrangement will organize the data as described in the figure below.
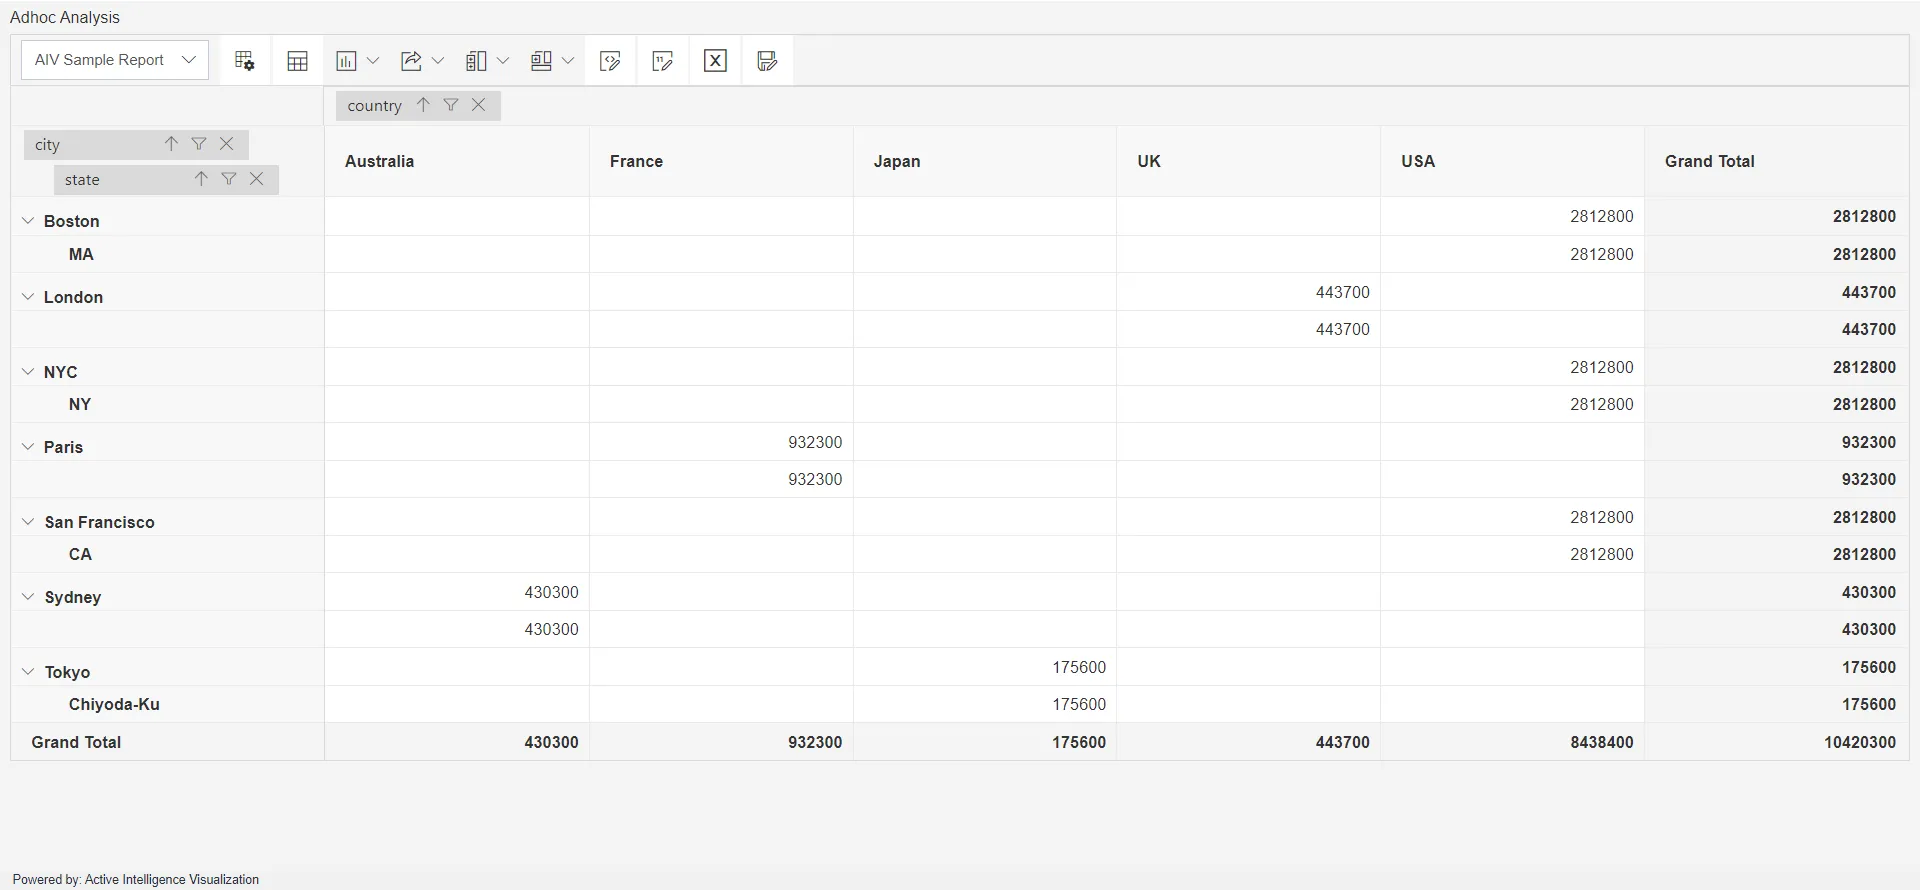
After clicking the Preview button to display the output, and then clicking the Cancel button, the screen will appear as follows.
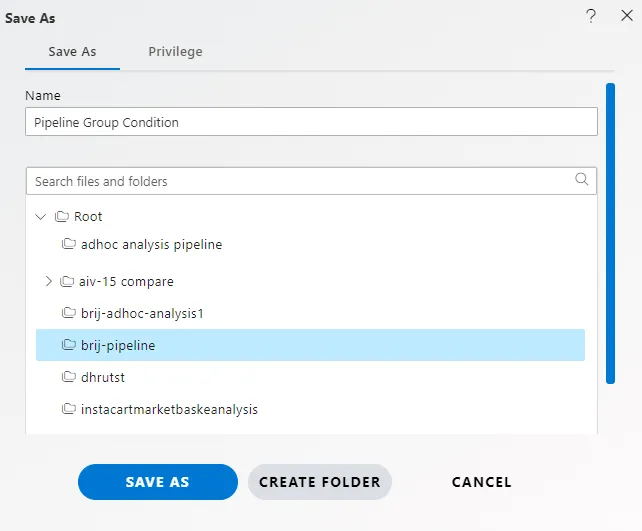
When you click on the Save as icon to save the Analysis, the screen will appear as shown below.
![]()
Give the name of Analysis.
Name: Embed pipeline.
Select the folder where you want to save Analysis, as shown in the figure below:
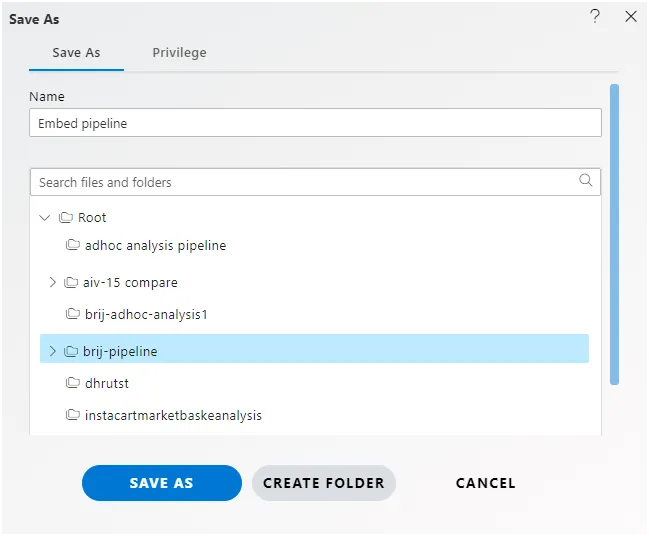
Click on Save as icon for saving the Analysis, it will show the screen as below:
Click on List View of Adhoc Analysis.
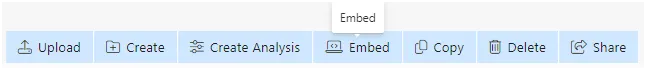
To embed from the Adhoc Analysis section, locate and click on the Embed option in the bottom menu bar, as depicted in the figure below.
You can see the Embed menu will open as shown in the figure below:
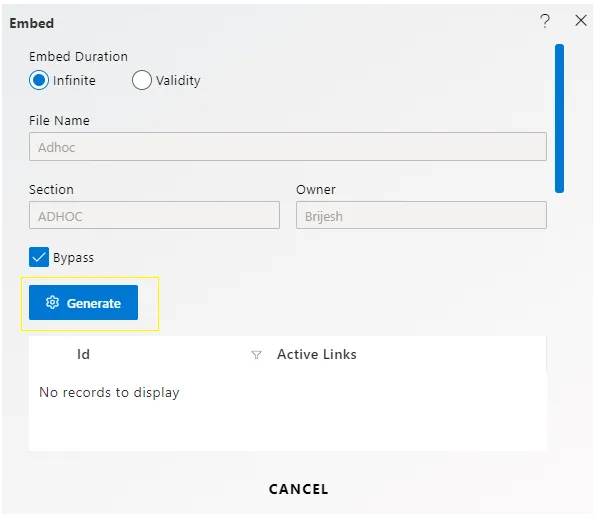
By default, the Bypass option is checked in the menu.
Now Click on Generate option & copy the External Embed link. As per shown below:
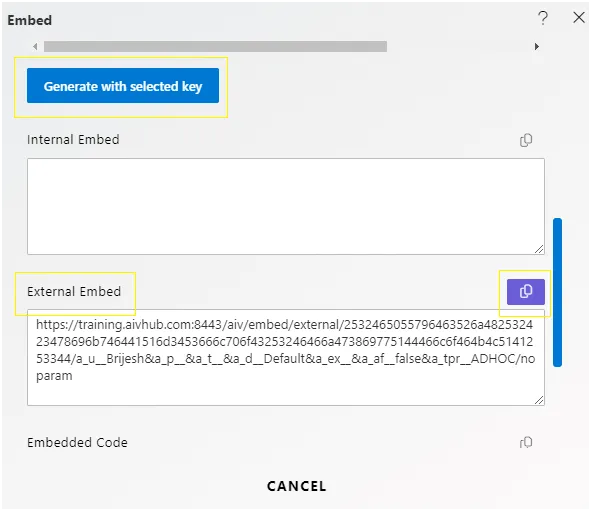
Click on Cancel Button.
To copy the link and write it in Notepad, follow these steps:
Copy the link provided in the embedding process. Open Notepad on your computer. Paste the copied link into Notepad. Add any necessary global parameters to the link as required.
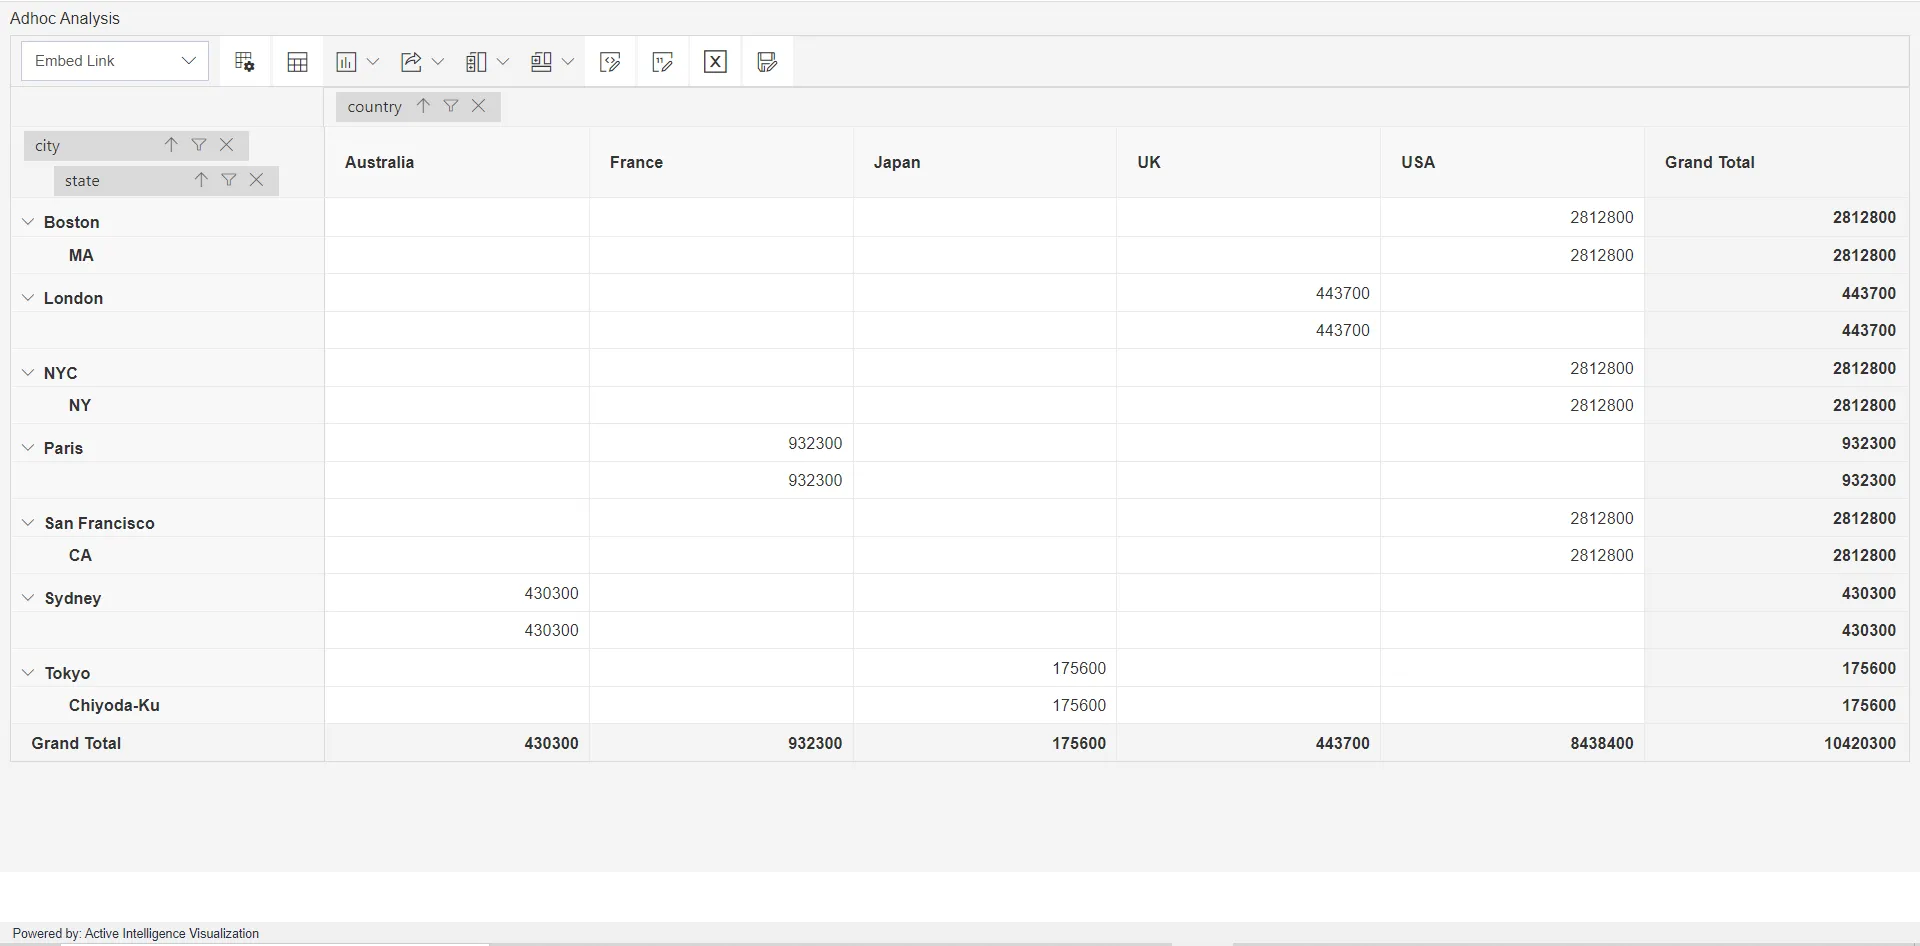
https://training.aivhub.com:8443/aiv/embed/external/57756f5a6b53455a557136475336655135596e44525842505a666843733339736a6959556c58354b623541253344/a_u__<Give Username>&a_p__&a_t__&a_d__Default&a_ex__&a_af__false&a_tpr__ADHOC/aivg_xrptxnamex___<Analysis Name>Once you paste the copied link into another browser, your screen will resemble the image below:
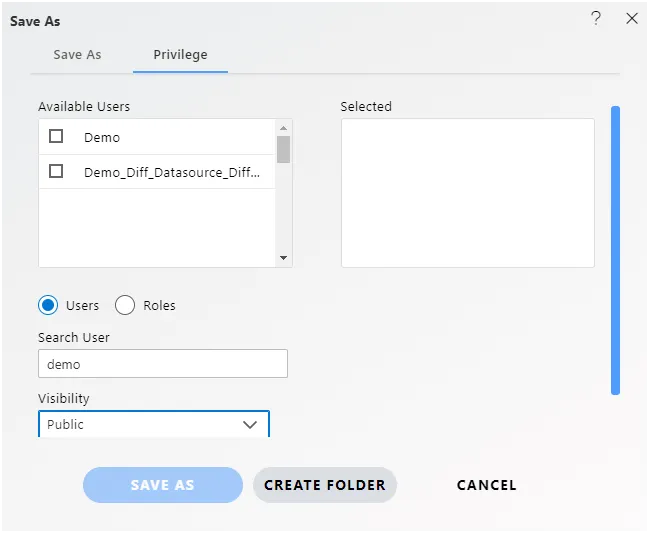
In another scenario, if you want to share the Embed link with another user, you’ll need to follow these steps:
- Share the Pipeline:
- Navigate to the Pipeline you want to share.
- Look for the option to share or collaborate on the Pipeline.
- Provide the necessary permissions or access rights to the other user.
- Share the Adhoc Analysis:
- Navigate to the Adhoc Analysis you want to share.
- Similarly, look for the option to share or collaborate on the Adhoc Analysis.
- Grant the required permissions or access rights to the other user. Once the Pipeline and Adhoc Analysis are shared with the other user, they will be able to access the Embed link and view the content as needed.
After sharing the Pipeline and Adhoc Analysis with the other user, follow these steps to copy the Embed link, write it in Notepad, and make changes:
- Copy the Embed link provided for the Pipeline or Adhoc Analysis.
- Open Notepad on your computer.
- Paste the copied Embed link into Notepad.
- Make any necessary changes or modifications to the Embed link as required.
- Save the Notepad file with the updated Embed link. Ensure that the changes made to the Embed link are accurate and valid, and the other user has the appropriate permissions to access the shared content.
https://training.aivhub.com:8443/aiv/embed/external/57756f5a6b53455a557136475336655135596e44525842505a666843733339736a6959556c58354b623541253344/a_u__<Give Username>&a_p__<Give Password>&a_t__&a_d__Default&a_ex__&a_af__false&a_tpr__ADHOC/aivg_xrptxnamex___<Analysis Name>Once you paste the copied link into another browser, your screen will appear similar to the image below:
You can save this analysis by clicking on the save icon and providing a name for the analysis. This allows you to access it later for further review or sharing. Additionally, you can check this analysis by logging into the user account where it was saved..