How to change pipeline configuration
How to change/Apply pipeline configuration
What is Pipeline?
This document provides guidance on initiating and engaging with the pipeline dataset, illustrating steps to create a pipeline utilizing a sample dataset.
Prerequisites.
-
Datasets with the (.ds) extension that possess at least one corresponding column (matching column).
-
Database tables with at least one matching column.
Download Pipeline.zip file from the link given PipelineDataset.zip
1. Create Pipeline with Existing Datasets.
To create a pipeline using existing datasets, it’s necessary to have a minimum of two datasets, each containing at least one matching column. In this demonstration of pipeline creation, we’re utilizing two sample datasets.
-
Customers. ds, which has information of customer details.
-
Offices. ds, which has information on Office data.
In this scenario, both datasets share matching data in the Country, City, and State columns. We’ll proceed to generate a pipeline dataset, extracting matching information from both tables through an inner join operation based on the Country column.
Performing a join operation on both tables using the Country column will yield only the data that matches between the two tables.
To delve deeper into SQL joins and expand your understanding, I recommend following this link: SQL Joins Guide SQL Joins
Let’s begin creating the pipeline.
To begin the pipeline creation process, please log in to the AIV application using your valid user credentials. Once logged in, we can proceed with the pipeline creation steps. If you encounter any issues during the login process, feel free to ask for assistance.
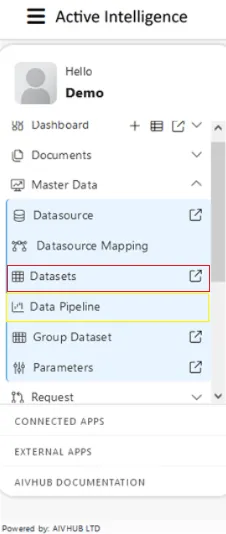
To navigate to the Dataset section within the AIV application, follow these steps:
- Click on the hamburger menu icon (typically three horizontal lines) located in the top-left corner of the application interface.
-
From the menu that appears, select “Master Data.” Within the Master Data menu, locate and click on the “Data pipeline” or second method click on “Dataset” option.
-
Once you’re in the Dataset section, we can continue with the pipeline creation process by using bottom menubar. If you need further guidance or assistance, feel free to ask!
Navigate to the footer menu of the AIV application interface.Look for the “Create Pipeline” button.Click on the “Create Pipeline” button to begin the process of creating a new pipeline.
![]()
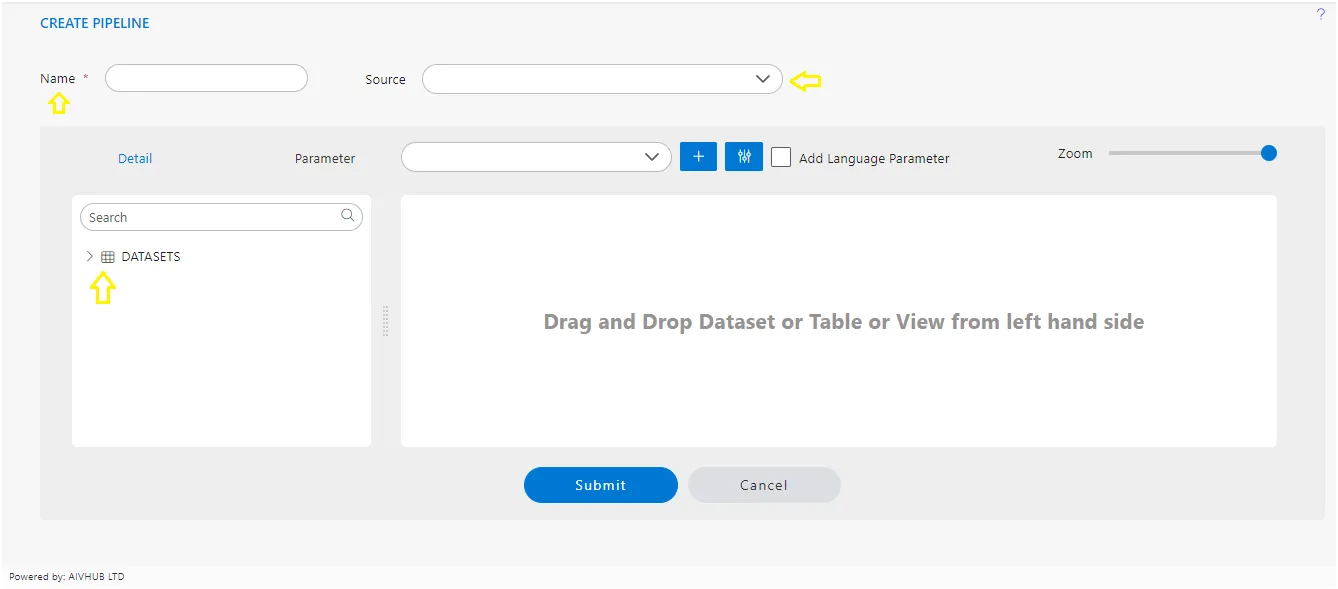
Once you’ve clicked on the “Create Pipeline” button, you’ll likely be directed to a new page or modal where you can start configuring and defining your pipeline.
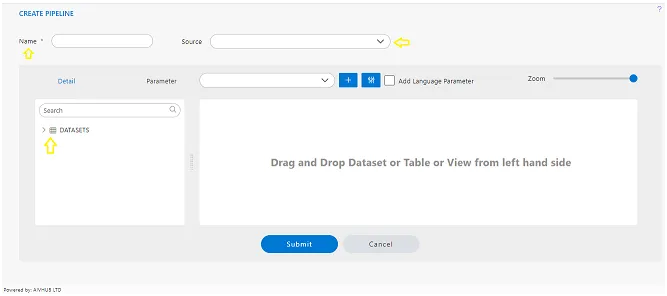
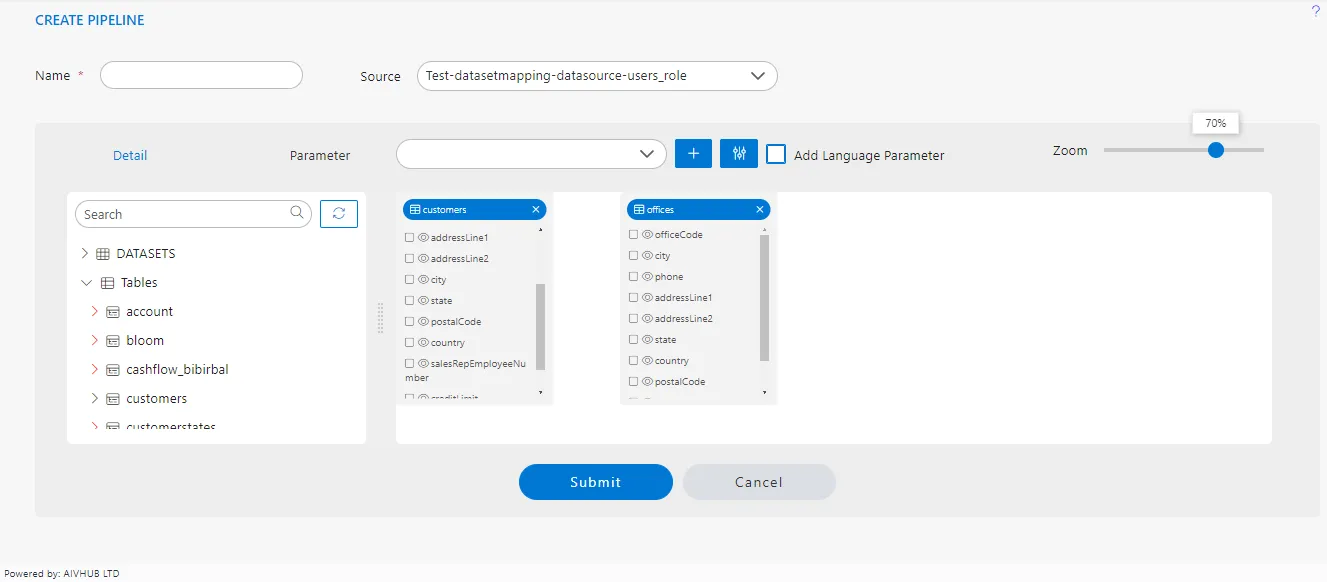
a user interface within the AIV application for selecting data sources and datasets to use in the pipeline creation process. Here’s a breakdown of the steps.
In the Source section, when you select Test-datasetmapping-datasource-users_role, it indicates that you can view the list of datasets in the details tab. From this list of datasets, we need to search for the specific datasets we require. Initially, we need a customer’s table, so we will utilize the search box to find the customer’s dataset. Once located, we can simply drag and drop this dataset from the list into the playground.
Once the dataset is dropped, a list of columns will be displayed for the selected dataset. This will allow you to view and interact with the various columns and their corresponding data within the dataset.
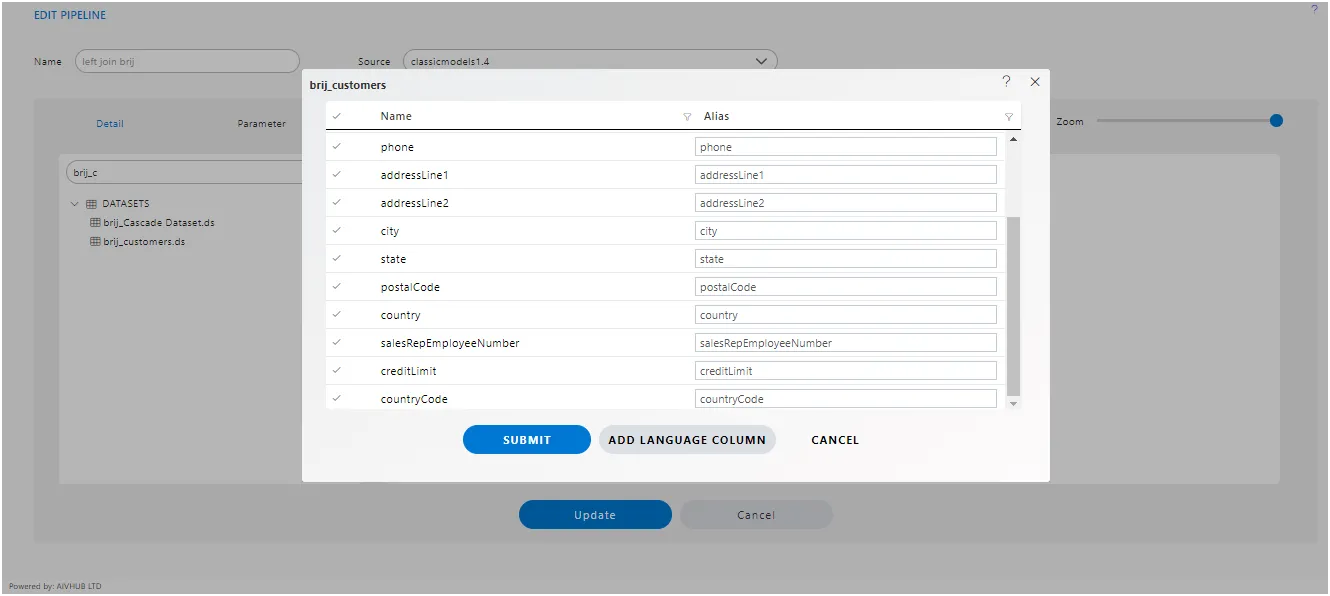
Here, users have the option to select or deselect columns to be added to the playground. Each column name is accompanied by a checkbox, allowing users to toggle their selection. By default, all columns are selected, providing users with a starting point from which they can refine their choices according to their specific needs or preferences.
To add a node to the playground, simply click on the “Submit” button. This action will incorporate the selected dataset, along with its chosen columns, into the playground environment.
Similarly, to add a second node, follow the same procedure as before. Select the desired dataset and columns, and then click on the “Submit” button again. This will insert another node into the playground, allowing for further analysis or manipulation of the data.
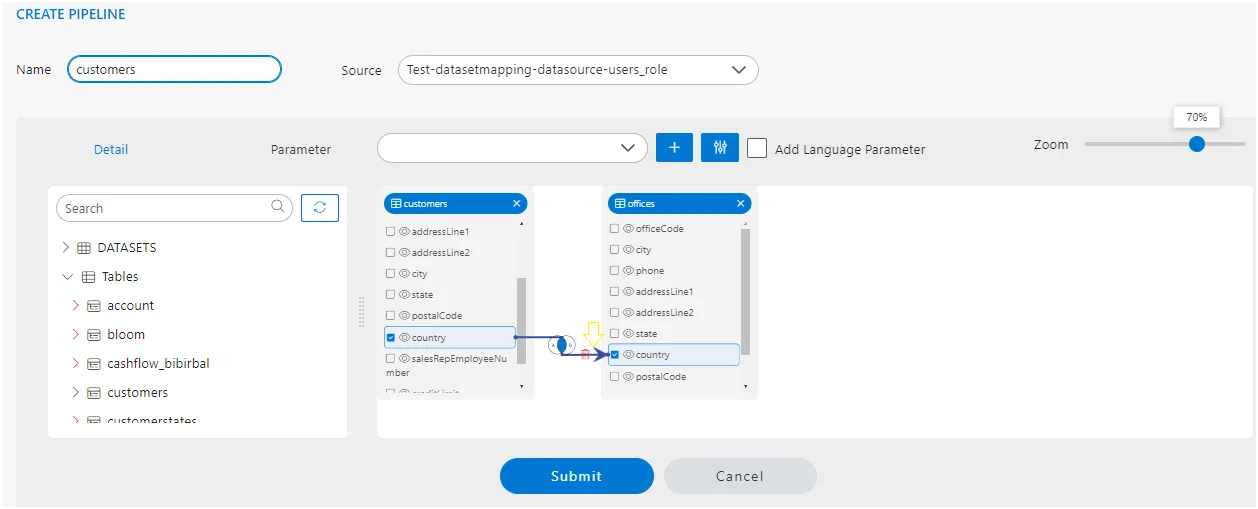
To create a join between two nodes by drag and drop, follow these steps:
-
Select the First Node : Begin by selecting the first node containing the dataset you want to join with another dataset.
-
Select the Column to Join : From the selected node, locate the column you want to use for the join. Click and drag this column to the corresponding column in the second node.
-
Configure the Join Type : Once you release the column over the second node, a dialog or menu will appear where you can configure the join type. This dialog should provide options such as inner join, left join, right join.
-
Choose the Desired Join Type : Navigate through the options provided in the join configuration dialog to select the appropriate type of join for your analysis.
-
Confirm and Apply the Join : After selecting the desired join type, confirm your selection and apply the join through
submitbutton. This action will establish the join between the two nodes based on the specified columns and join type.
For more detailed instructions, including screenshots and additional guidance, refer to the documentation on how to create a pipeline in the platform. Look for the section or documentation titled “Type of Join” to learn more about configuring different types of joins within the pipeline environment. Click here to navigate
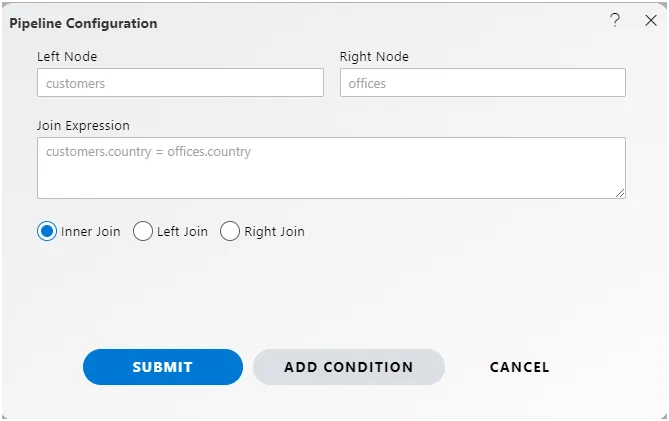
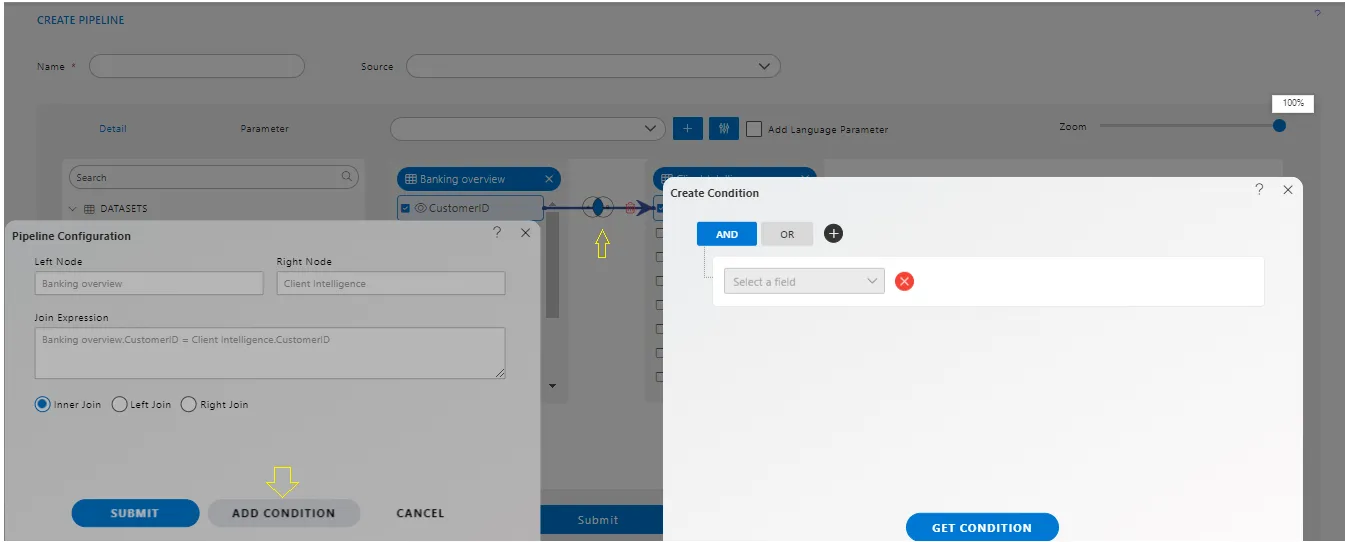
To change the join condition, click on this venn diagram and you will see Pipeline configuration window will be open,
Let’s understand Each point in this configuration.
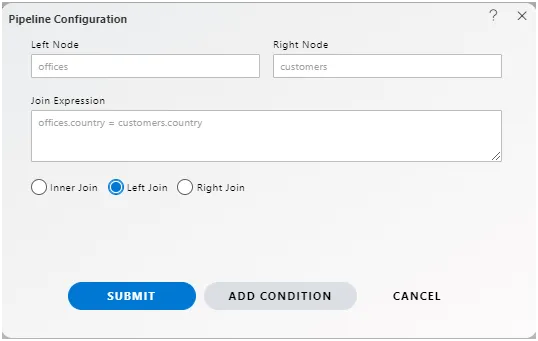
1. Left/Right Node Name.
The direction of the arrow indicates the flow of data from one node to another in the pipeline. When creating a join between two nodes by drag and drop, the direction of the arrow signifies the source node (left side) and the target node (right side) of the join.
For example : If you drag a column from customers to offices and then configure the join,customers will be on the left side, and offices will be on the right side.
Conversely, if you drag a column from offices to customers, offices will be on the left side, and customers will be on the right side.
In both cases, the join configuration will determine how data from the source node is matched with data from the target node based on the selected columns and join type.
2. Join Expression.
In this field, you can observe the join expression that has been automatically generated by the drag and drop function. It will display the columns with which the join has been applied, providing a clear representation of the criteria used for the join operation between the two nodes. This expression typically reflects the relationship between the columns selected for the join, facilitating transparency and understanding of the join logic applied within the pipeline.
In this example, we have applied join between the country column of 2 nodes so you can see in the screenshot the expression is customers. country = offices.country that means the country from the customer node is compared with the country of offices node.
3. Join Type.
Within this pipeline configuration, users can make three types of joins:
Inner Join: This type of join returns only the rows where there is a match in both datasets. In other words, it includes only the rows where the values in the specified columns match between the two datasets.
-
Left Join (or Left Outer Join): This join type returns all rows from the left dataset and the matched rows from the right dataset. If there is no match, it returns NULL values for the columns from the right dataset.
-
Right Join (or Right Outer Join): Conversely, the right join returns all rows from the right dataset and the matched rows from the left dataset. Similar to the left join, if there is no match, it returns NULL values for the columns from the left dataset.

These three types of joins offer users flexibility in combining datasets based on different matching criteria and handling unmatched records according to their specific requirements within the pipeline configuration.
4. Submit/Cancel/Add Condition
-
Submit : To implement changes to the playground node, simply click the “Submit” button. .
-
Cancel : To discard any changes made in the configuration window, click on the “Cancel” button. This action will revert the configuration back to its previous state, ensuring that any modifications or additions made are not saved and do not affect the current setup in the playground environment.
-
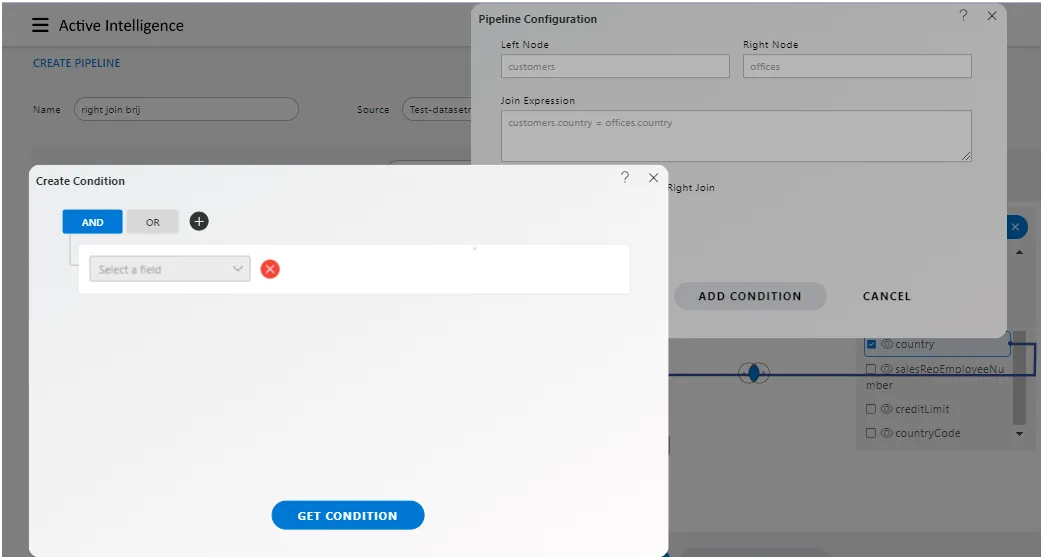
Add Condition : From this point, users have the ability to add additional conditions above the existing join condition. This functionality allows users to refine their data manipulation further by incorporating additional criteria that need to be met before the join operation takes place.
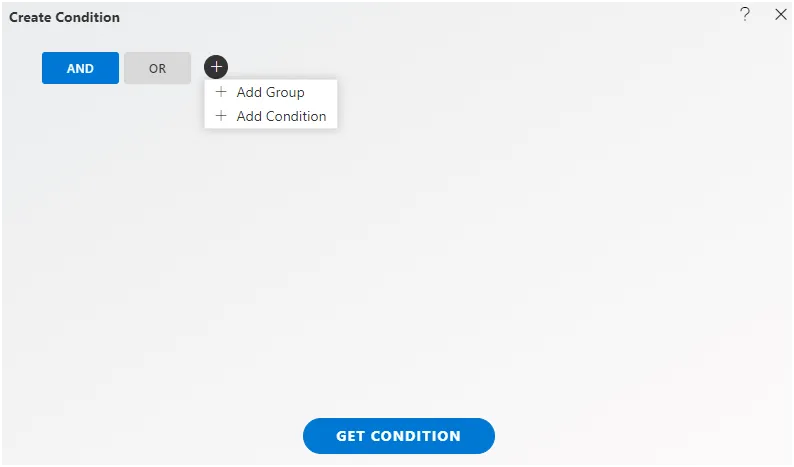
Add Condition Terminology.
In AIV, the term “Add Condition” refers to the action of including additional criteria or rules to filter or manipulate data within the pipeline configuration. When users click on the “Add Condition” button, it allows them to specify further conditions that must be met for data processing. This feature enhances the flexibility and granularity of data manipulation, enabling users to refine their analyses according to specific requirements.
-
Condition Type: This feature allows users to define conditions based on various factors such as column values, expressions, or logical operations. Common condition types may include:
-
Column Value Condition : Specifies a condition based on the value of a particular column in the dataset.
An example of a Column Value Condition in AIV might be:
Condition Type: Column Value Condition
Condition: “Customer Age is greater than or equal to 18”
In this example, “Customer Age” is a column in the dataset, and the condition specifies that only records where the value in the “Customer Age” column is greater than or equal to 18 will be included in the data processing. This condition filters out any records where the customer’s age is below 18, effectively focusing the analysis on adult customers.
- Expression Condition : Involves defining conditions using mathematical or logical expressions involving one or more columns.
An example of an Expression Condition in AIV might be:
Condition Type : Expression Condition
Expression: “Total Sales > 1000 AND Product Category = ‘Electronics’”
In this example, the condition is defined using an expression involving two columns: “Total Sales” and “Product Category.” The expression specifies that only records where the total sales are greater than 1000 and the product category is ‘Electronics’ will be included in the data processing. This condition filters the dataset to focus specifically on sales transactions involving electronics products with a total sale amount exceeding 1000.
- Pattern Matching Condition : Allows users to specify conditions based on pattern matching or regular expressions within the data.
An example of a Pattern Matching Condition in AIV might involve a scenario where you want to filter data based on specific text patterns within a column.
Condition Type: Pattern Matching Condition.
Pattern: “Email Address contains ‘@gmail.com’”
In this example, the condition filters the dataset to include only those records where the email addresses contain the domain “@gmail.com”. This pattern matching condition is useful for segmenting data based on specific text patterns, allowing you to focus on records that meet certain criteria within the dataset.
- Logical Condition : Involves combining multiple conditions using logical operators such as AND, OR, or NOT to create complex filtering criteria.
In AIV, logical conditions allow users to combine multiple conditions using logical operators such as “AND” and “OR” to create more sophisticated filtering criteria.
AND Operator :
- When using the “AND” operator, both conditions must be true for a record to be included in the result. For example, if you have conditions :
- Customer Age is greater than or equal to 18
- Product Category is ‘Electronics’
- The result will include records where both conditions are satisfied. that is, customers aged 18 or older who purchased electronics.
OR Operator :
- Conversely, when using the “OR” operator, if either condition is true, the record will be included in the result.
- For example, using the same conditions as above:
- Customer Age is greater than or equal to 18
- Product Category is ‘Electronics’
- The result will include records where either condition 1 or condition 2 is satisfied. that is, customers aged 18 or older or any purchase related to electronics. These logical operators provide users with flexibility in defining complex filtering conditions to tailor their analysis precisely to their needs.
By utilizing different condition types, users can effectively control and manipulate data flow within the pipeline to meet their specific analysis requirements.
By Default, conditions will be selected and a single line of field dropdown will be displayed. The user needs to select the column on which he wants to apply the condition.
- Add Group/Condition: The “Add Group/Condition” feature in AIV enables users to create and group conditions using
AND/ORlogic for more complex filtering criteria.
Here’s how it works :
Add Group : This option allows users to create a new group of conditions. Within a group, conditions are evaluated together using AND or OR logic.
Add Condition : This option lets users add individual conditions to the existing group or a new group if none exists.
When users click on the “Add Group/Condition” button, they are prompted to choose one option from the list of two: "Add Group" or "Add Condition". This choice determines whether they want to create a new group of conditions or add a single condition to an existing group.
By utilizing this feature, users can create sophisticated filtering criteria by combining multiple conditions and groups of conditions using logical operators such as AND and OR.