How to create pipeline
How to create first pipeline
What is Pipeline?
This document provides guidance on initiating and engaging with the pipeline dataset, illustrating steps to create a pipeline utilizing a sample dataset.
Prerequisites
-
Datasets with the (.ds) extension that possess at least one corresponding column (matching column).
-
Database tables with at least one matching column.
Download Pipeline.zip file from the link given PipelineDataset.zip
1. Create Pipeline with Existing Datasets.
To create a pipeline using existing datasets, it’s necessary to have a minimum of two datasets, each containing at least one matching column. In this demonstration of pipeline creation, we’re utilizing two sample datasets.
-
Customers. ds, which has information of customer details.
-
Offices. ds, which has information on Office data.
In this scenario, both datasets share matching data in the Country, City, and State columns. We’ll proceed to generate a pipeline dataset, extracting matching information from both tables through an inner join operation based on the Country column.
Performing a join operation on both tables using the Country column will yield only the data that matches between the two tables.
To delve deeper into SQL joins and expand your understanding, I recommend following this link: SQL Joins Guide SQL Joins
Let’s begin creating the pipeline.
To begin the pipeline creation process, please log in to the AIV application using your valid user credentials. Once logged in, we can proceed with the pipeline creation steps. If you encounter any issues during the login process, feel free to ask for assistance.
To navigate to the Dataset section within the AIV application, follow these steps:
-
Click on the hamburger menu icon (typically three horizontal lines) located in the top-left corner of the application interface.
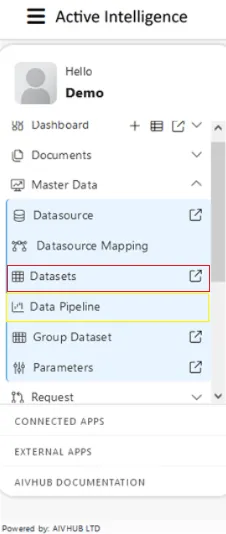
-
From the menu that appears, select “Master Data.” Within the Master Data menu, locate and click on the “Data pipeline” or second method click on “Dataset” option.
-
Once you’re in the Dataset section, we can continue with the pipeline creation process by using bottom menubar. If you need further guidance or assistance, feel free to ask!
Navigate to the footer menu of the AIV application interface.Look for the “Create Pipeline” button.Click on the “Create Pipeline” button to begin the process of creating a new pipeline.
![]() Once you’ve clicked on the “Create Pipeline” button, you’ll likely be directed to a new page or modal where you can start configuring and defining your pipeline.
Once you’ve clicked on the “Create Pipeline” button, you’ll likely be directed to a new page or modal where you can start configuring and defining your pipeline.
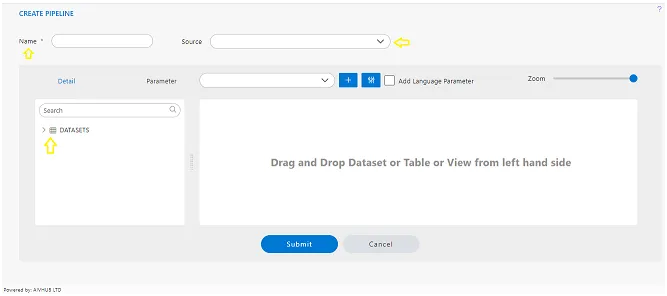
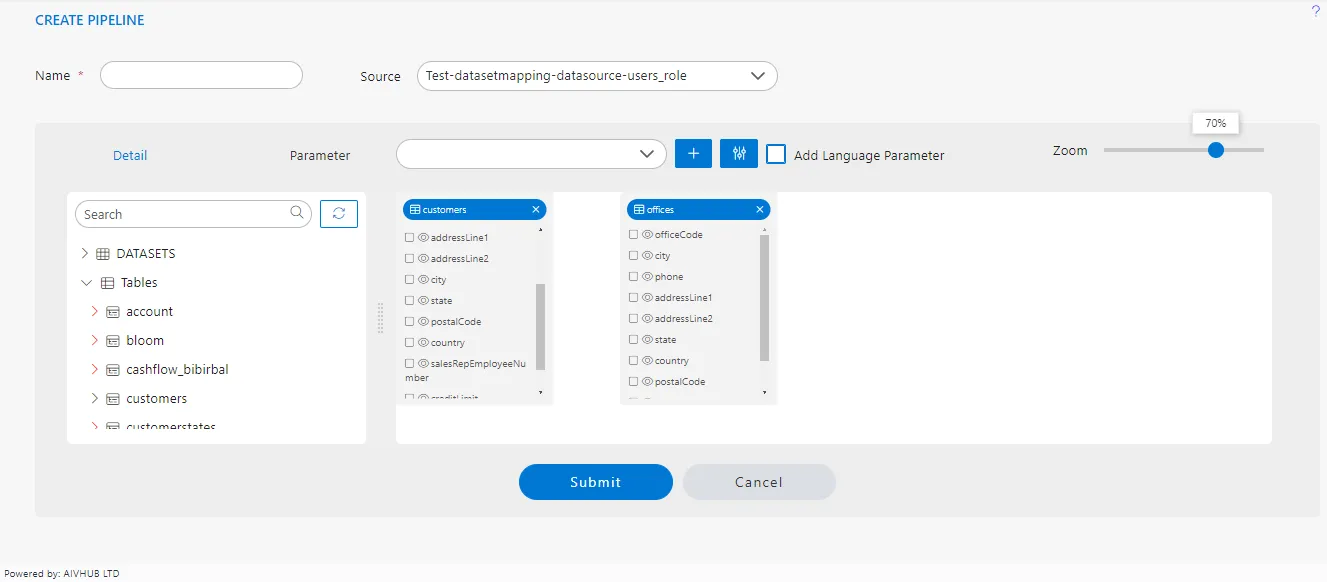
a user interface within the AIV application for selecting data sources and datasets to use in the pipeline creation process. Here’s a breakdown of the steps.
-
Source Dropdown: Clicking on this dropdown will reveal a list of available data sources that are accessible to the logged-in user.
-
Selecting a Data Source: Users can choose a specific data source from the dropdown list. This selection will determine which database or data repository the pipeline will pull data from.
-
Searching for a Dataset: Once a data source is selected, users can search for a specific dataset within that data source using the search box. In this case, you’re searching for a dataset named “customers.”
-
Drag and Drop: After finding the desired dataset in the search results, users can drag and drop it from the list (presumably displayed in the search results) into the “playground” area. The playground area is likely where users configure and visually design their pipelines.
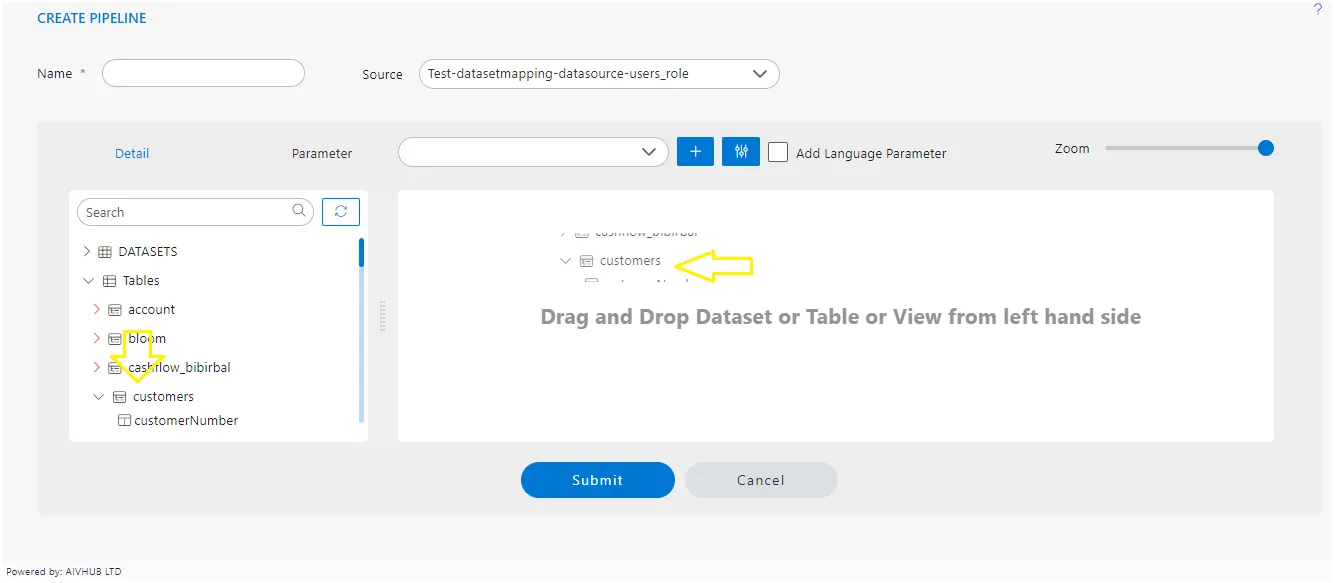
After dropping the dataset into the designated area, the application will promptly present a comprehensive list of columns corresponding to the dataset you’ve selected. This feature facilitates easy identification and selection of specific columns for further analysis or integration into your pipeline.
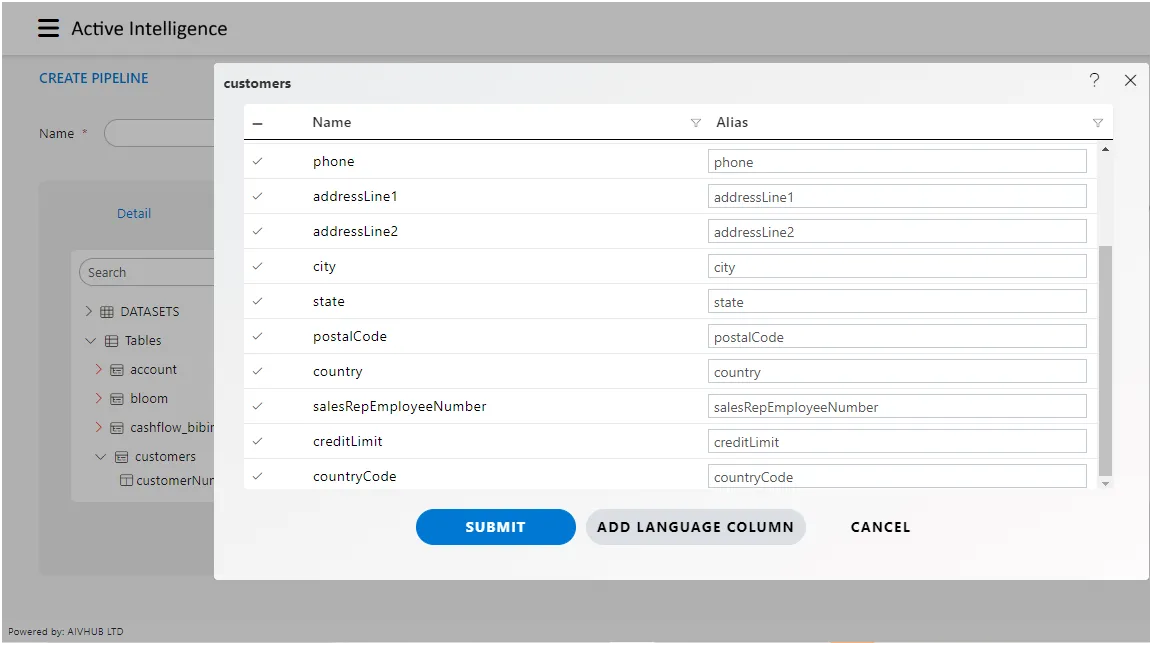
You can see 3 buttons in this window,
-
Upon selecting or deselecting the necessary columns, you can proceed by clicking the “Submit” button. This action will incorporate the chosen dataset into the playground, ensuring that only the selected columns are included. This streamlined process enhances efficiency by allowing users to focus solely on the relevant data for their analysis or pipeline development.
-
Add Language Column
- The “Cancel” button serves as an option to abort the addition of the dataset to the playground. If you decide not to proceed with adding the dataset, simply click on the “Cancel” button to revoke the action. This feature provides users with flexibility and control over the dataset selection process within the application’s interface.
Column filter
Within the dataset window, users can conveniently locate and filter columns by utilizing the filtering option located adjacent to the “Name” header. This filter function enables users to swiftly narrow down their search and pinpoint specific columns based on their names, streamlining the dataset exploration process.
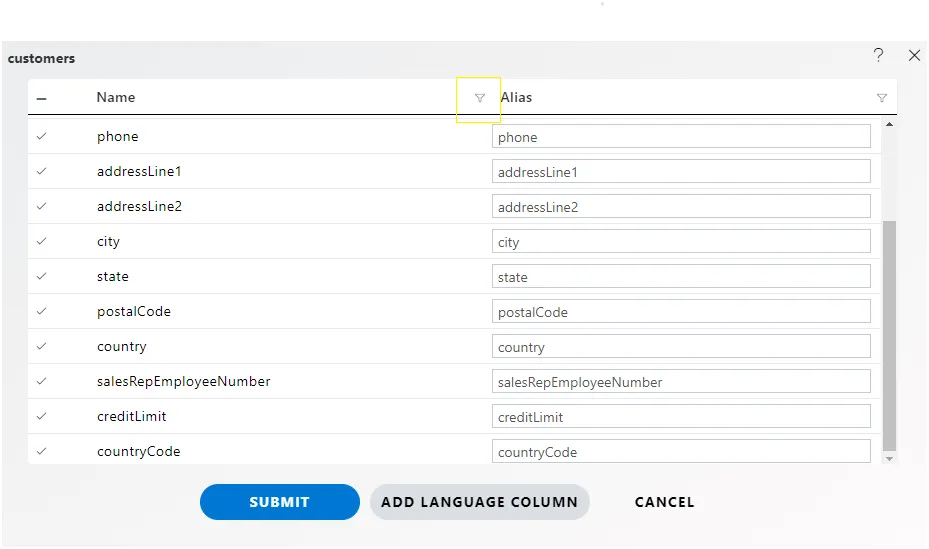
When you click on this filter options as below screen.

- You can sort the listing of columns with
Sort A to ZandSort Z to Aoptions
Text Filters
- There are many options available to filter columns listed below;
- Equal
- Not Equal
- Starts With
- Ends With
- Contains
- Custom Filter
The column filters operate in a similar fashion for the remaining columns, such as the “Alias” and “Language” columns if they are added. Users can expect consistent functionality across all columns within the dataset window, facilitating efficient filtering based on various criteria.
Alias
In the context of AIV,the “Alias” function likely allows users to assign alternative names or labels to columns within datasets. This feature can be useful for various purposes, such as providing more descriptive or user-friendly names, standardizing naming conventions, or facilitating easier referencing within queries or analyses.
For example, users might use the Alias function to rename a column named “Cust_ID” to “Customer ID” for better readability. Additionally, aliases can be employed in queries to simplify syntax or when working with multiple tables to disambiguate column names.
Once a node of the customers dataset is added in the playground, we need to add a second node of the offices dataset.
2. Add a second node into a playground
Use Case: In this scenario, if the user needs to retrieve the total credit limit of each sales employee territory-wise, they can use the following approach:
-
Identify that the “Customers” table lacks the “Territory” column but contains “customerNumber” and “creditLimit” columns.
-
Utilize the “Offices” table, which does have the “Territory” data.
-
Ensure that there is at least one matching field between the two tables to perform a join operation.
-
Join the “Customers” and “Offices” tables based on the matching column, typically using the “Country” column.
-
Retrieve the necessary data based on the joining condition to obtain the total credit limit for each sales employee territory-wise.
This process involves linking the two tables based on a common field, such as the sales representative’s employee number, to associate customer data with the corresponding territory information. By joining the tables, the user can then analyze and aggregate credit limit data based on territories assigned to sales employees.
Now both these nodes are having matching data in the country column and both nodes have the country column in them.
To get matching data from both the tables, we have to join both tables with matching columns and that is country in this case.
Refer Steps we have followed to add customers node into the playground to search and add offices node in the playground.
Once offices node is added, you will see 2 nodes in the playground as in the below image,
Performing a join between tables is straightforward with the pipeline interface. Simply hover your mouse pointer over the country column of the customer’s table. Press and hold the left mouse button, then drag your cursor to the country column of the second node, which represents the Offices table. Release the mouse button to drop it on the column name. You’ll notice an arrow appears between these two columns, indicating the join operation, and the selected column is highlighted for clarity. This visual representation streamlines the process of defining joins within the pipeline interface.
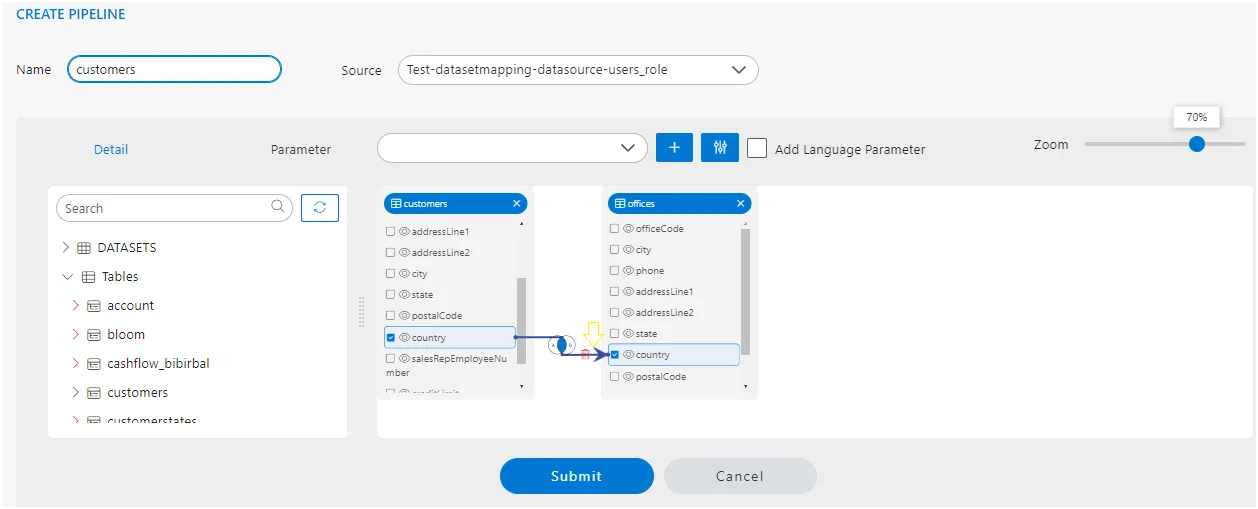
Once join is created you can see the Checkbox of both the columns are selected and a small diagram will be displayed at the middle of the arrow and a delete icon as well.
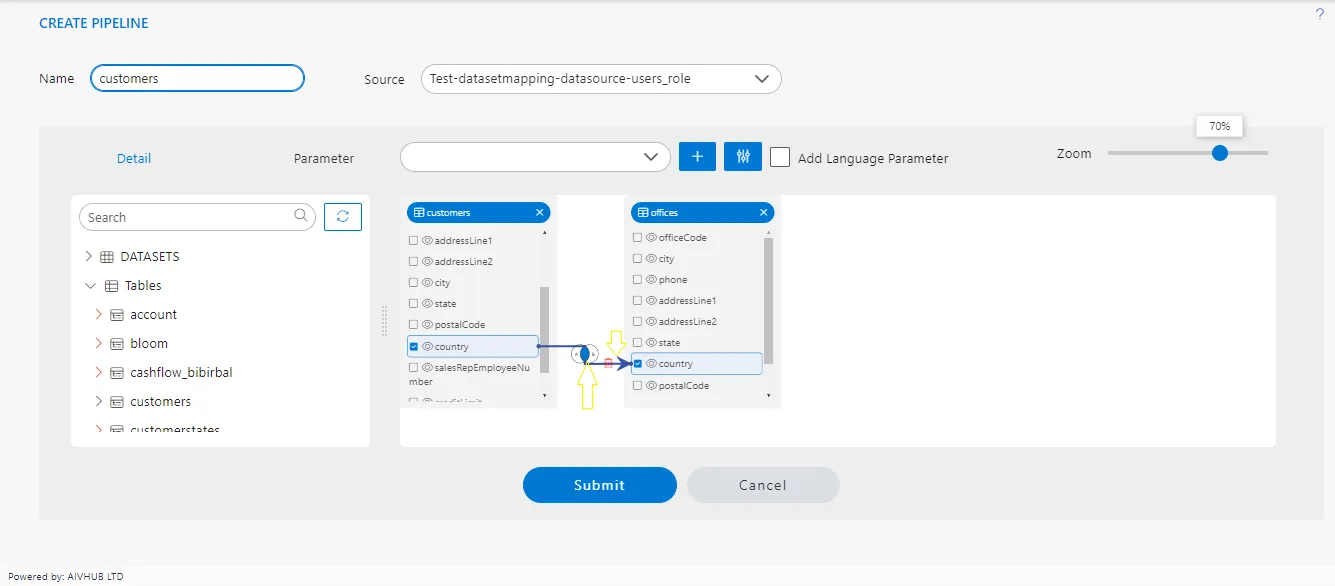
- In the pipeline interface, a small diagram referred to as a
Venn Diagramis displayed along the arrow line connecting two nodes. This diagram signifies the type of join that has been applied between the two nodes. It visually represents the relationship between the datasets and thetype of join operation, facilitating easy identification and understanding of the join configuration within the pipeline. - Indeed, the delete icon located at the arrowhead side of the arrow line serves the purpose of deleting the link between nodes within the pipeline
Type of Join
In the context of AIV, once a link is established between nodes within the pipeline, users can determine the type of join applied between the two nodes by examining the Venn Diagram displayed along the arrow line. The Venn Diagram visually represents the relationship between the datasets and provides an indication of the type of join operation being utilized. Different configurations of overlapping circles within the diagram correspond to specific types of joins, such as inner join, outer join, left join, or right join. This intuitive visualization allows users to quickly understand the join strategy implemented in their pipeline, facilitating effective data integration and analysis.
To change the join condition, click on this Venn diagram and you will see Pipeline configuration window will be open,
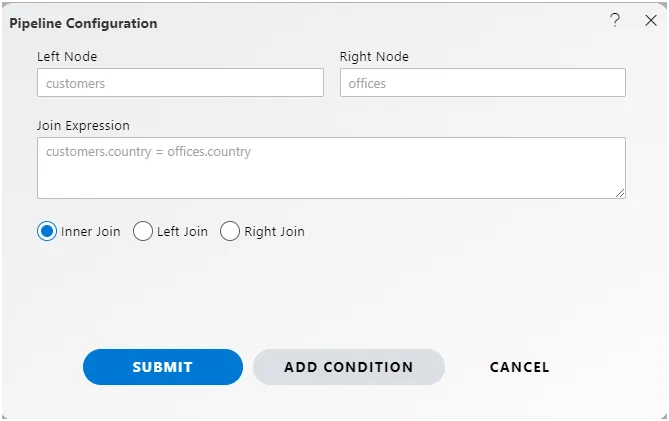
Pipeline Configuration
To know operations performed in this window, Click Here
Click on Submit button and Give the name of the pipeline.
To create a pipeline named “Customers,” follow these steps:
-
Name: Customers
-
Click on the “Submit” button to initiate the creation of the pipeline. After creating the pipeline, you can run it in the Adhoc Analysis section by following these steps:
-
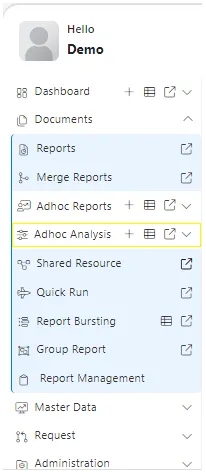
Go to the “Documents” section in the Hamburger menu.
-
Navigate to the “Adhoc Analysis” subsection.
-
In the Adhoc Analysis section, click on the ”+” icon to create a new analysis.
This process will allow you to perform ad-hoc analysis using the pipeline you’ve created. If you encounter any difficulties or need further assistance, feel free to ask for help!
When you click on create Analysis then the Analysis Selection dialog box will open, as shown in the figure below:
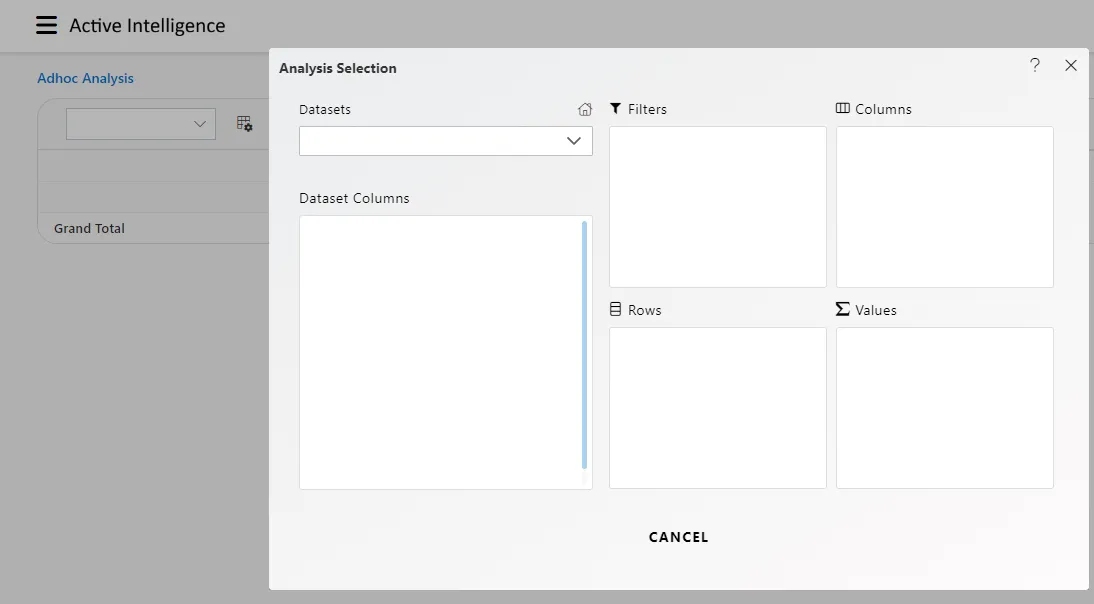
Enter the following details in Analysis Section:
Dataset: Customers (select the Pipeline, which you are created)
The two tables will get load the left side box of Pipeline view, Now expends the OFFICES table.
Drag and drop City, Country in Rows Box from the Office table and State in Column box and Creditlimit in Values Box from the Customers table, as shown in the figure below:
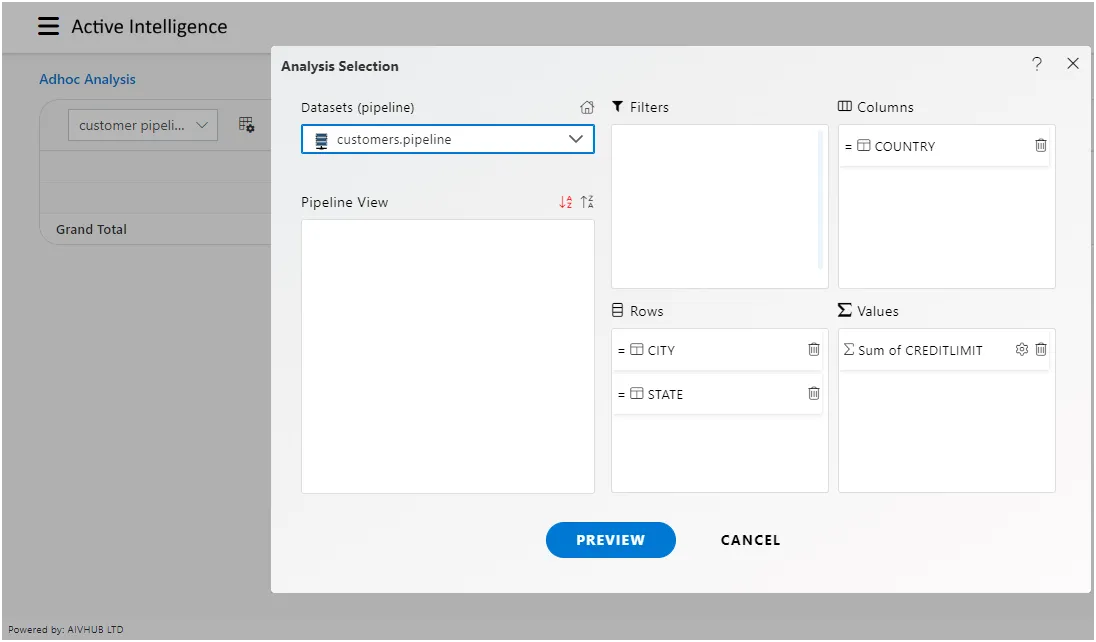
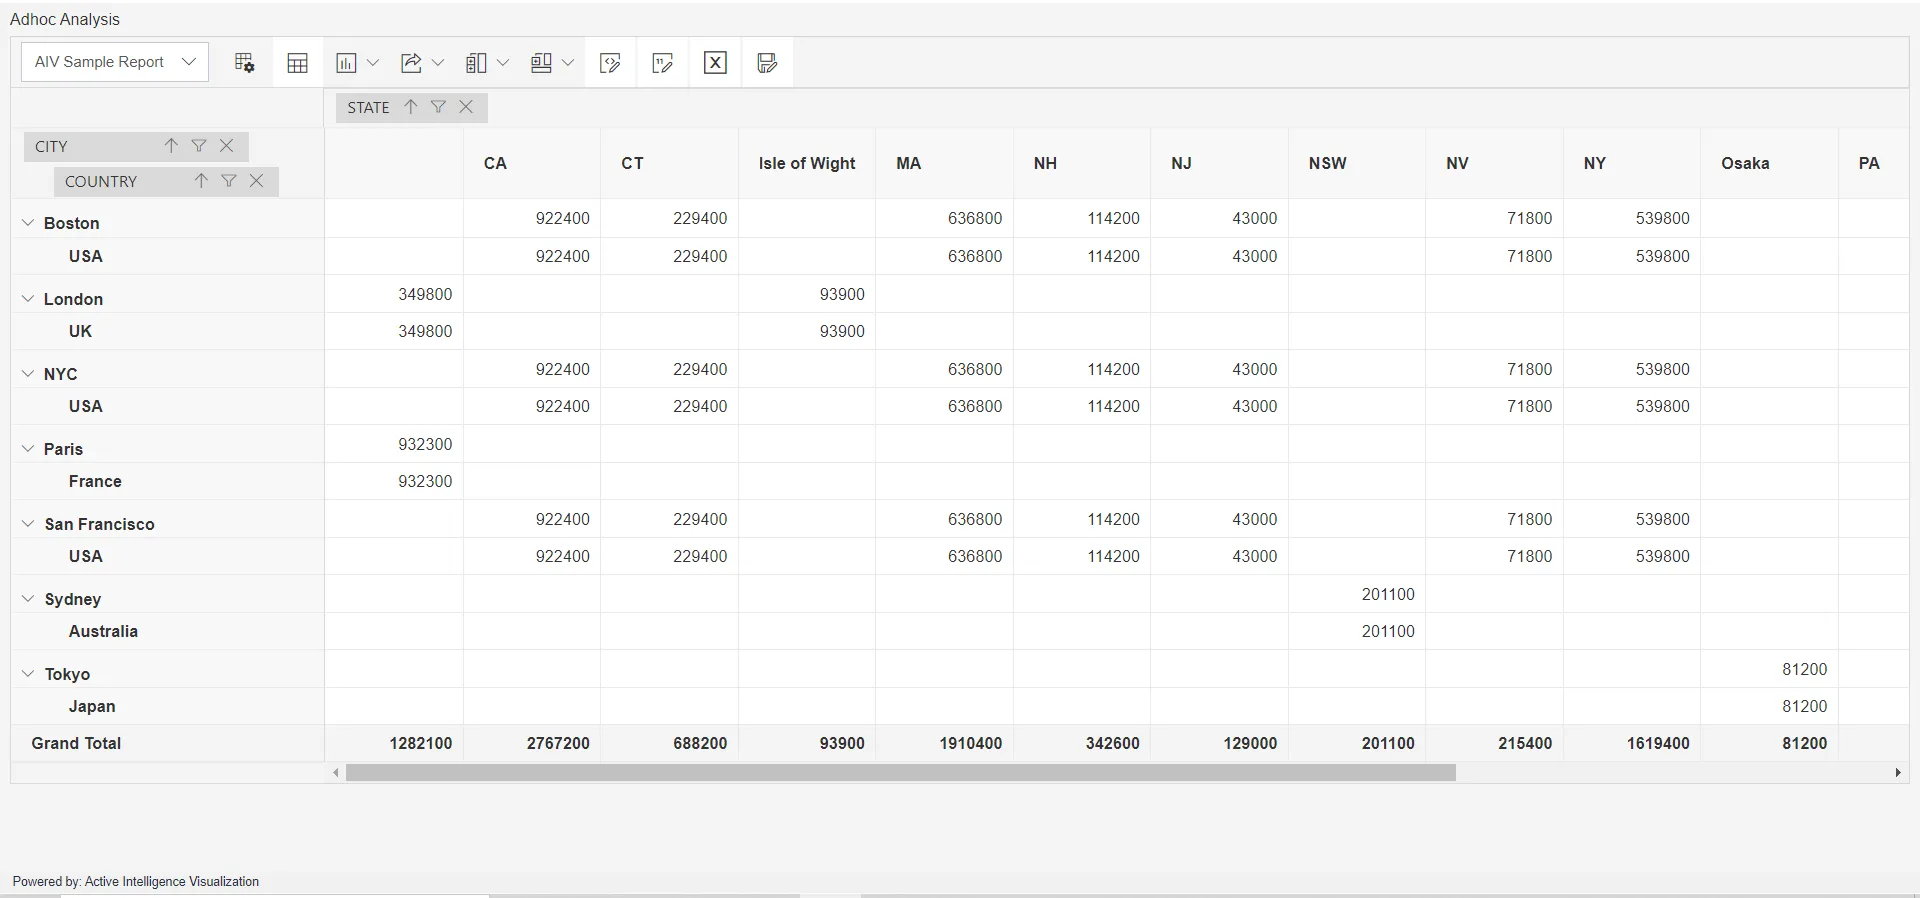
After clicking the “Preview” button, the output will be displayed. Subsequently, clicking on the “Cancel” button will return the screen to its original state.:
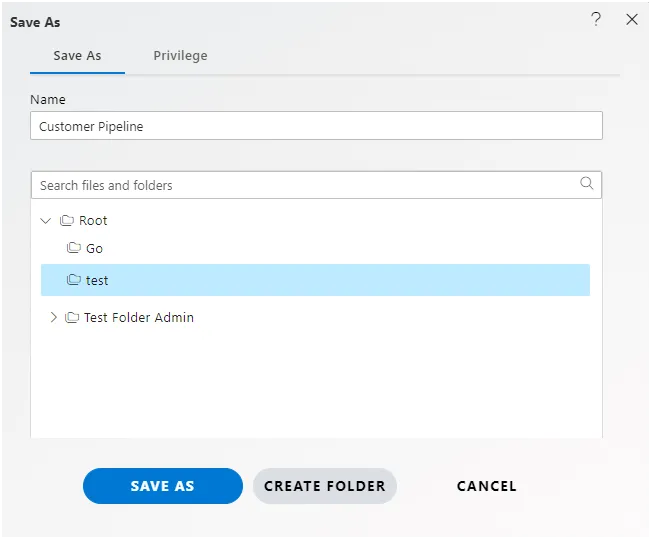
Click on Save as icon for saving the Analysis, it will show the screen as below:
![]()
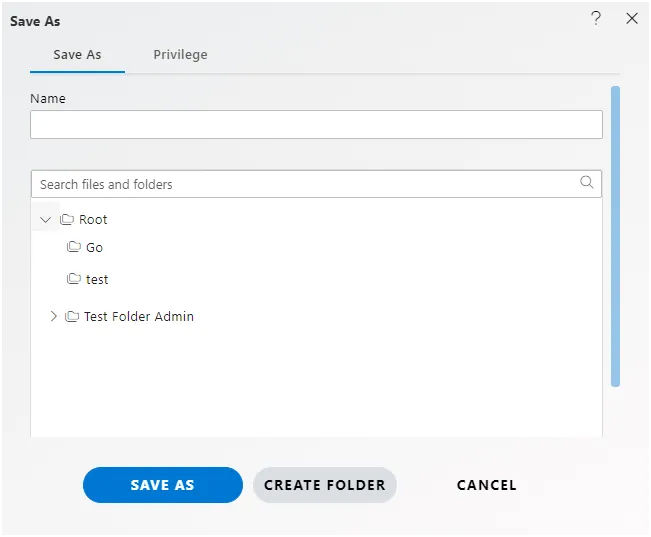
Give the name of Analysis.
Name: Customer Pipeline and Select the folder where you want to save Analysis, as shown in the figure below: