Group Condition in Pipeline
How to Apply Group Condition in Pipeline.
What is Group Condition?
- In AIV, a group condition refers to a criterion or set of criteria applied to group or filter data within a dataset or pipeline. It determines how data should be aggregated or grouped together based on specific attributes or fields. For instance, a group condition might involve grouping sales data by region or filtering customer data based on certain demographics.
Objective
- The objectives of group condition in a pipeline in AIV include :
Data Aggregation : Group conditions allow users to aggregate data based on specific attributes or fields, such as summing sales revenue by product category or counting the number of orders by region.
Data Filtering : Users can filter data within a pipeline based on certain criteria defined in the group condition, enabling them to focus on specific subsets of the dataset that meet their requirements.
Enhanced Analysis : By applying group conditions, users can perform more granular analysis of their data, uncovering insights and patterns that may not be apparent when viewing the data in its raw form.
Customization : Group conditions provide flexibility for users to tailor the presentation and organization of data according to their analytical needs, allowing for customizable reporting and visualization.
Improved Decision Making : With the ability to group and analyze data more effectively, users can make more informed decisions and derive actionable insights from their datasets, ultimately driving better business outcomes.
Prerequisites
-
For this example we are using Sales.ds.
-
Download dependency file . After downloading the file, extract if and upload Sales.ds from file into the AIV.
Skill Level Required
- Good to have basic knowledge of pipeline. Click here to know more about pipeline in detail.
Steps to Create Group Conditin in Pipeline
-
Log in to your AIV application using your valid credentials.
-
There are two ways by which user can go to the Pipeline Section.Navigate to the Pipeline section through one of the following methods:
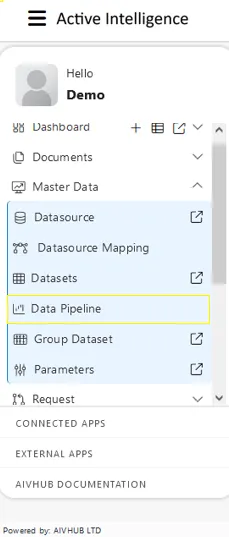
a. From the main Aiv hamburger, click on the “Dataset” option in the navigation menu.
![]()
b. Alternatively, access the Pipeline section through the main menu by clicking on the “Hamburger” icon, then selecting “Data pipeline” from the aiv main menubar.
By selecting hamburger menu > MasterData > Data Pipeline.
-
Once in the Pipeline section, locate and click on the “Create Pipeline” button to start creating a new pipeline.

-
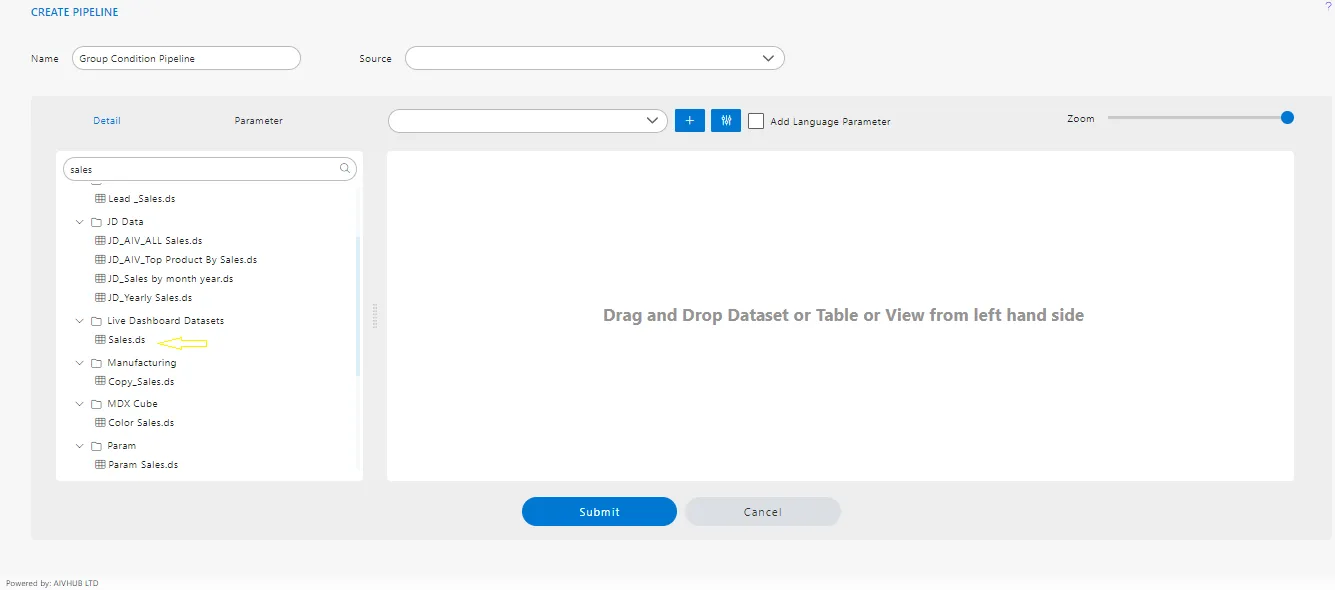
In the pipeline creation interface, drag and drop the required datasets, tables, or views onto the canvas to add them to the pipeline.
-
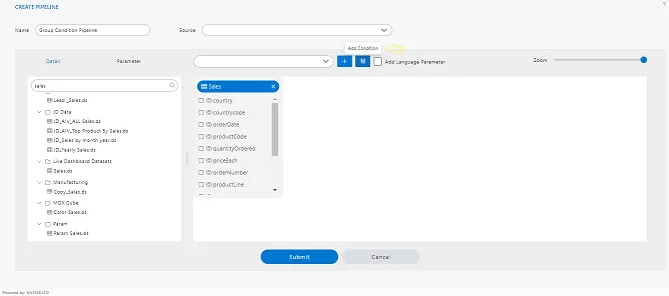
Example of creation pipeline dataset in aiv.adding details on pipeline canvas area.
- Name: Group Condition Pipeline.
-
Drag and drop the datasets you want to include in your pipeline from the dataset list onto the canvas area. For example, you can add tables or datasets like “Sales”, “Orders”, “Customers”, and “Products”.Here we are using sales.ds file.
-
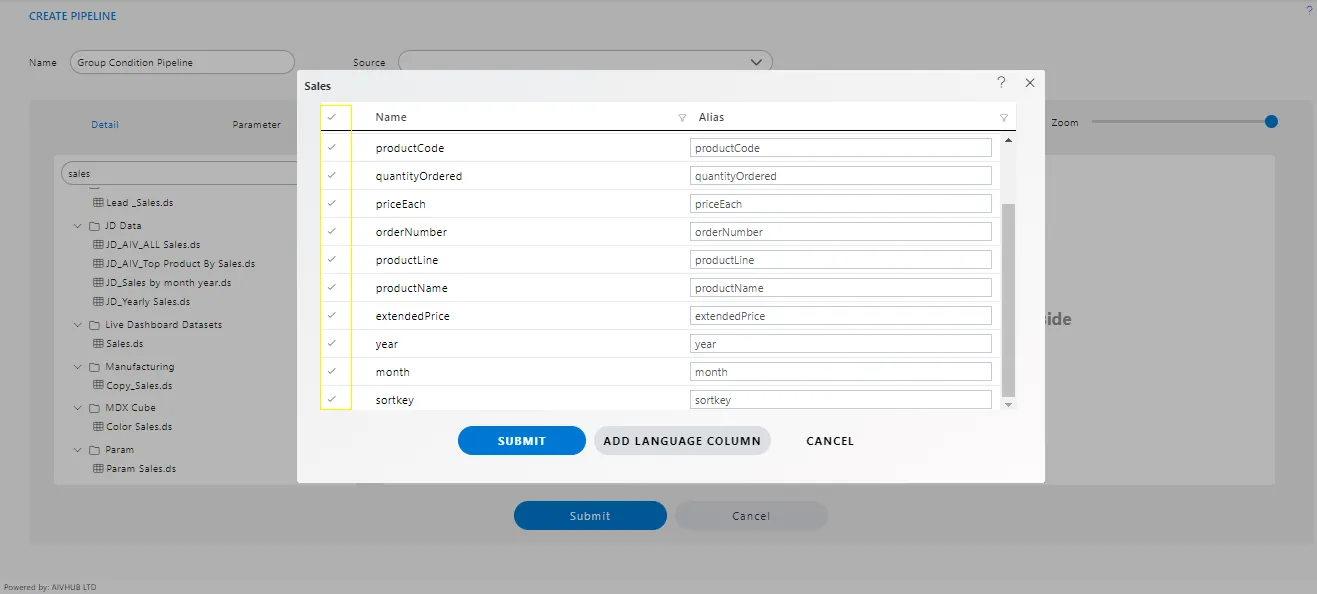
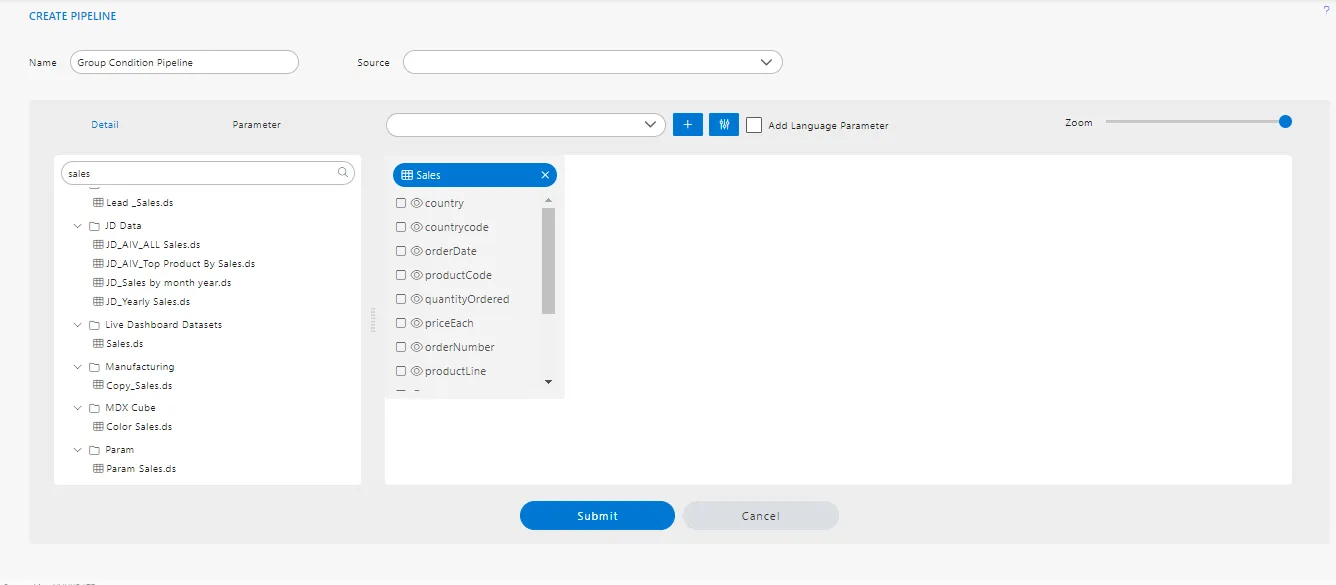
Once added to the canvas, select the columns you want to include from each dataset. This can be done by clicking on the dataset node and selecting the desired columns from the column list.
-
After clicking the submit button, the diagram box will be updated to reflect the changes made in the pipeline configuration.
-
Click on the “Add Condition” button as shown in the image below:
-
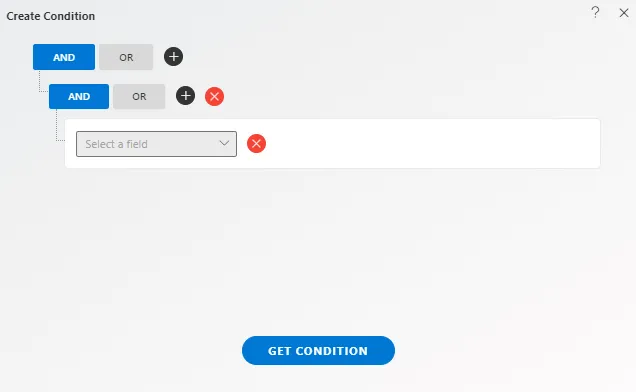
As you click on
Add Conditionone window will shown as shown below: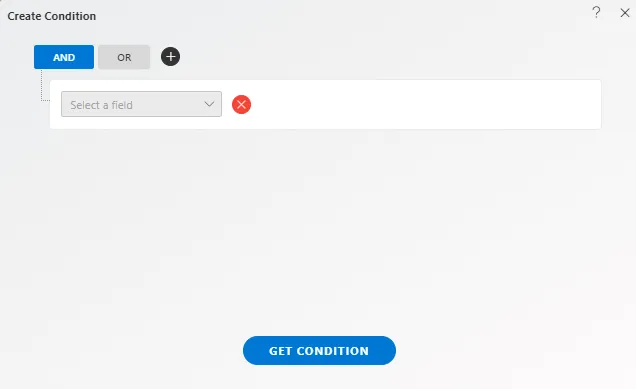
-
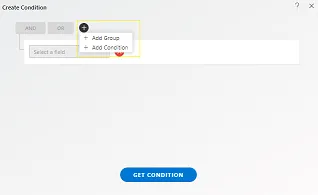
Select OR & click on (+) icon, then select
Add Group, as shown in the image below:
-
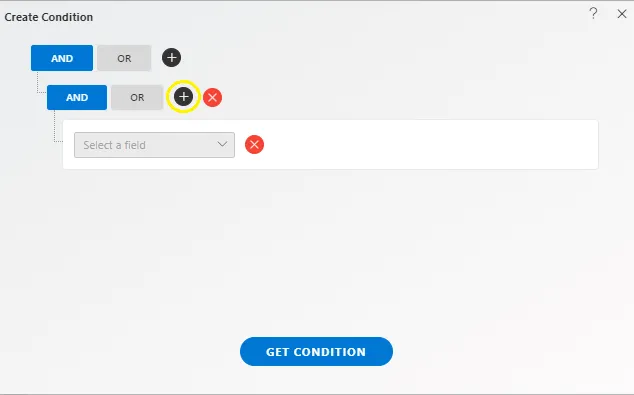
As you click on
Add Group, one group is added as shown: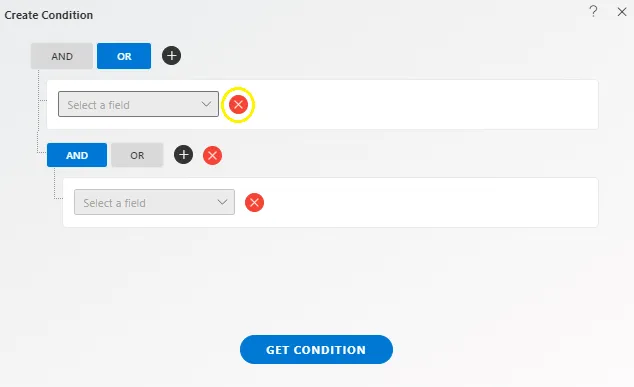
-
Click on (╳) icon, as shown in image above.
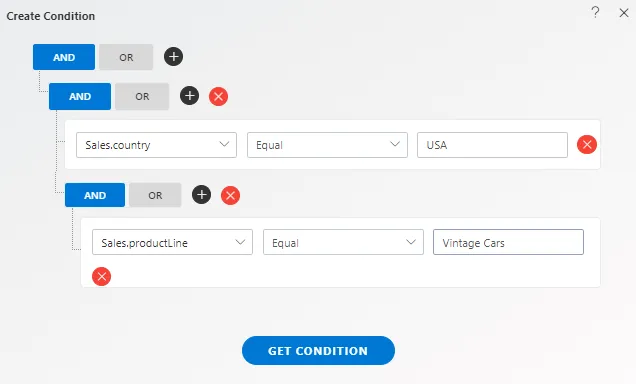
-
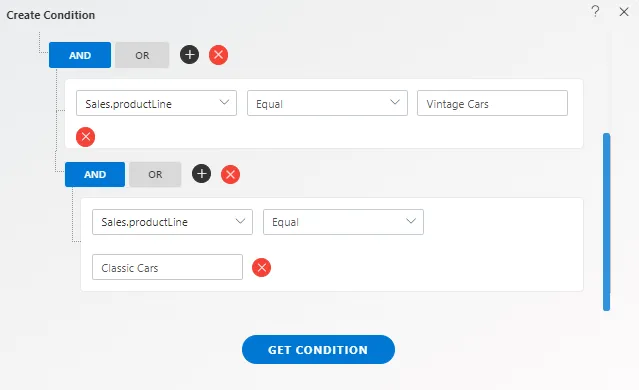
Fill the details as shown in image below:
-
Click on the plus (+) icon to add a new AND condition as indicated.
-
Please provide the specific details that need to be filled as shown.
-
Certainly! Could you please provide the details for the new group and the conditions to be set in reference to step 11 and step 14? Additionally, could you specify what details need to be filled?
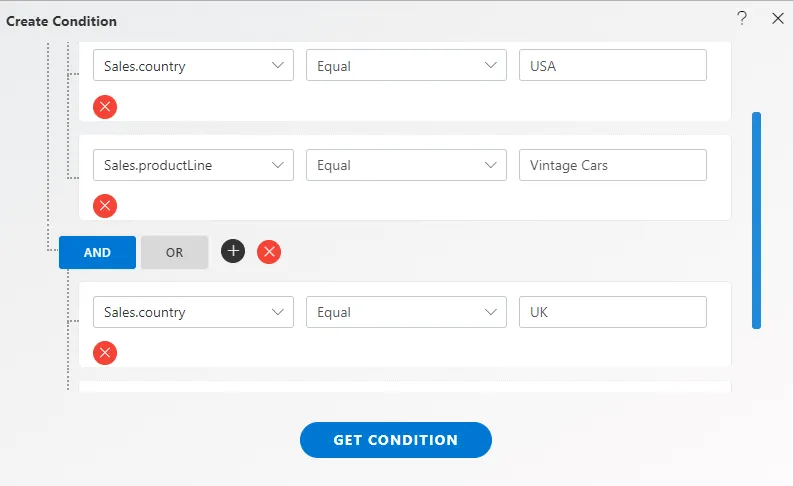
-
see, next figures of group condition applied on pipeline dataset.
-
Please click on the “GET CONDITION” button.
-
After clicking on the “GET CONDITION” button, proceed to click on the “Submit” button, and your pipeline dataset will be successfully created.
-
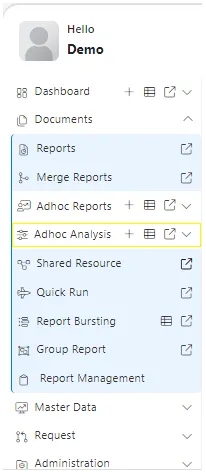
Now, click on hamburger menu > Document > Adhoc Analysis & click on the + icon to create a new Analysis, as shown in the figure below.
-
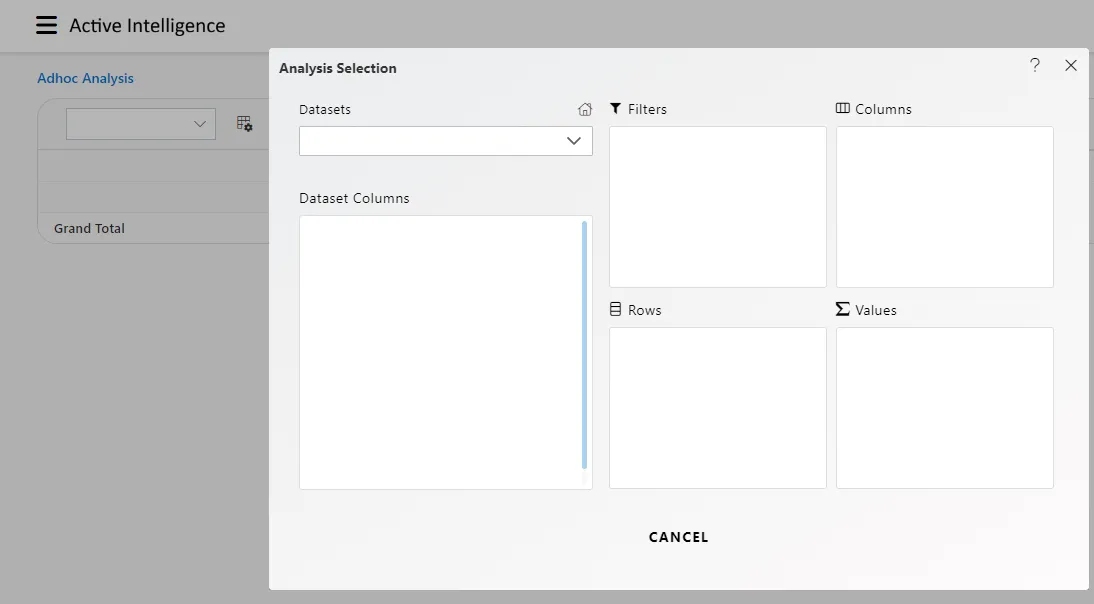
When you click on “Create Analysis,” the Analysis Selection dialog box will open, as depicted in the figure below.
-
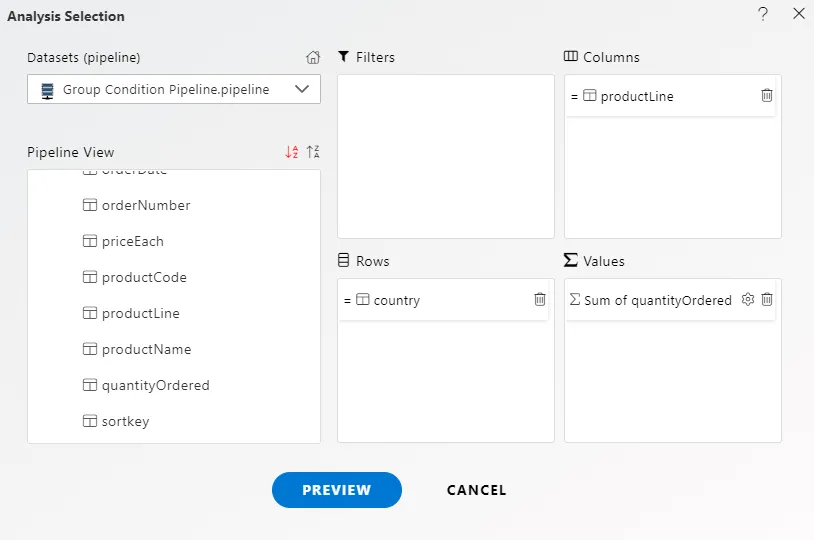
In the “Create Analysis” dialog box, fill in the details as shown.
- Datasets: Group Condition Pipeline.pipeline
- Rows: COUNTRY
- Colummns: PRODUCTLINE
- Values: QUANTITYORDERED
- Type: Sum
-
Click on the “Preview” button, then click on the (╳) button to close the preview window.
-
Your Analysis widget will appear as shown in the image below.
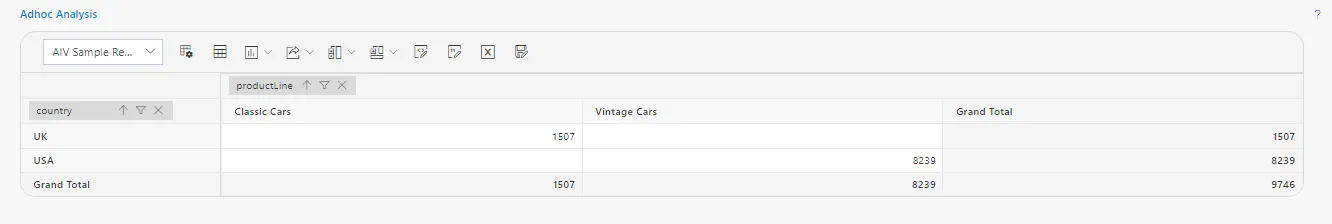
-
Give the name of Analysis.
- Name: Pipeline Group Condition
-
Click on Save button to save your Analysis.
-
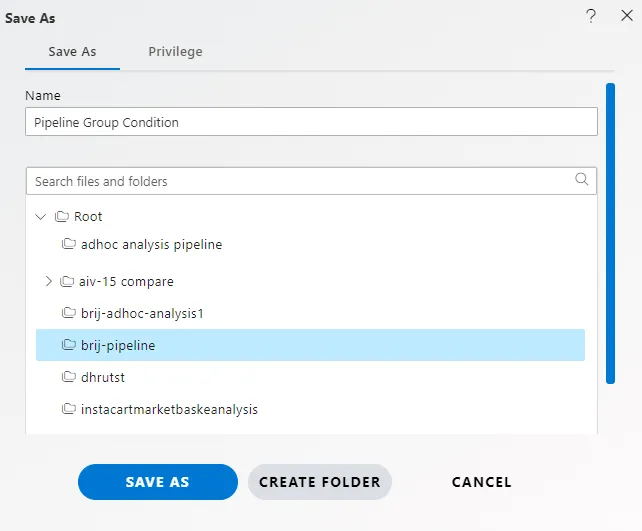
When you click on the Save as icon to save the Analysis, the screen will appear as shown below

-
Give the name of Analysis.
-
Name the Analysis “Group Condition Pipeline” and select the folder where you want to save it, as depicted in the figure below.
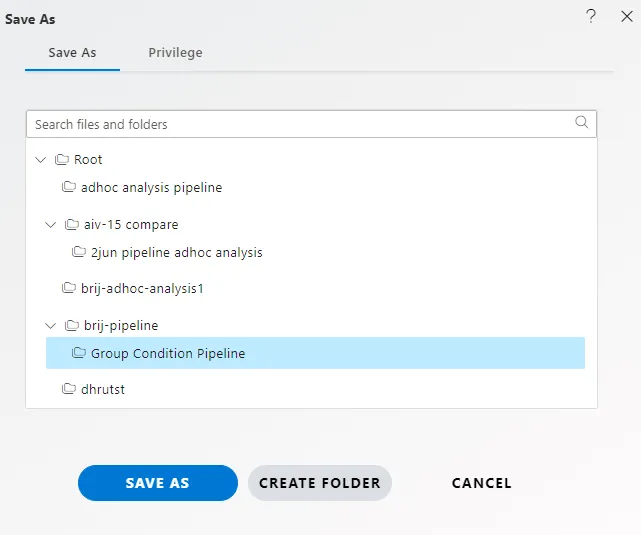
-
Click on Save As button.