Dummy Filter using Custom Visualization
Dummy Filter using Custom Visualization: This video contains how to to apply filter using custom visualization.
- When we require to make user-defined filters with required looks and design, we need to use custom visualization to make designs and link them with widgets using dummy filters.
- Login into AIV.
- Make Dashboard, to make dashboard click on Plus icon (+) from Dashboard section, as shown in the figure below:
![]()
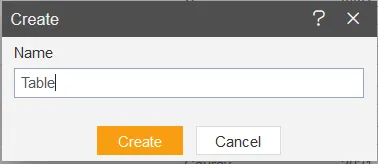
- Insert name & click on create button, as shown in the figure below:
- From the left Vertical Menu bar, click on the Custom Visualization icon.
- Make 3 buttons for the year filter, as shown in the figure below:
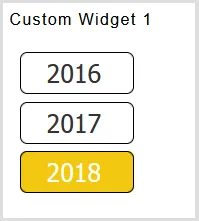
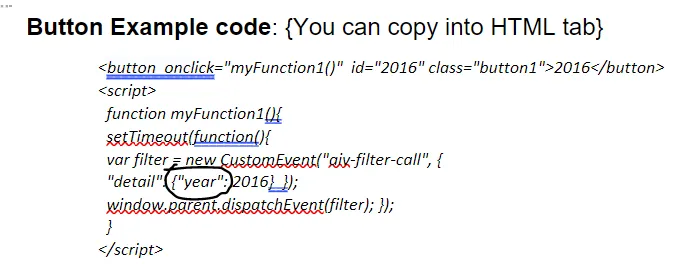
Button Example code: {You can copy into HTML tab}
<button  onclick="myFunction1()"  id="2016" class="button1">2016</button>
<script>
function myFunction1(){
setTimeout(function(){
var filter = new CustomEvent("aiv-filter-call", {
"detail": {"year": 2016}  });
window.parent.dispatchEvent(filter); });
}
</script>
Button CSS code: {You can copy into CSS tab}
.button1 {
background-color: white;
color: #333333;
padding: 4px 26px;
border-radius: 5px;
padding-left: 20px;
border: 1px solid #000000;
background-color: white;
font-family: 'Tahoma';
font-size: 20px;
margin-top: 6px;
}
.active, .button1:hover {
background-color: #F2C80F;
color: white;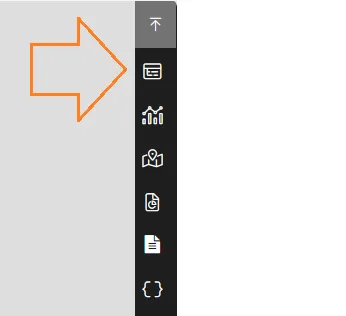
} - Now, make a Table widget in the dashboard, click on the table widget icon from the left Vertical Menu bar, as shown in the figure below:
- Insert the following details to make a table widget: • Name: sales table • Datasets(ds): sales.ds
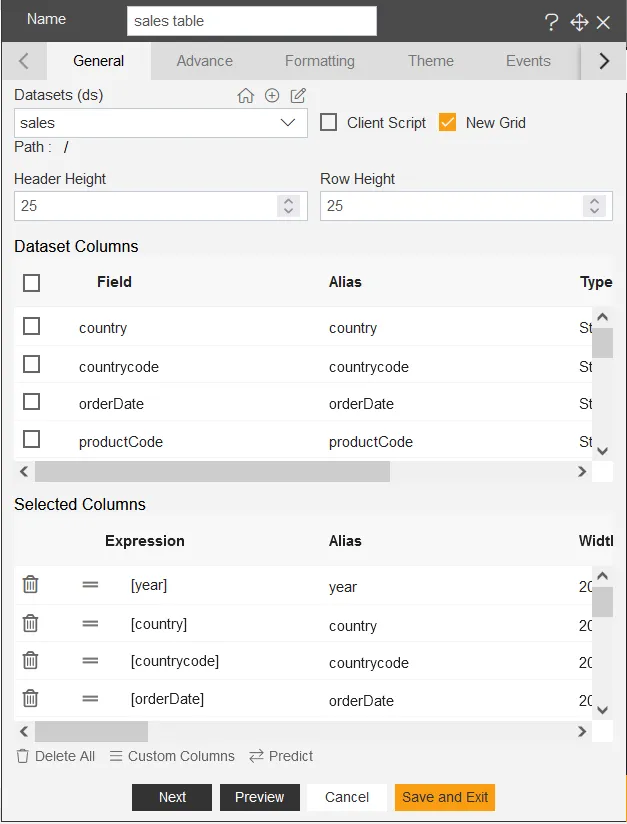
- Click on the save and exit button, now add a filter to connect the custom-made buttons to the table widget.
- Now, make a filter for the year, click on the filter icon, as shown in the figure below:
![]()
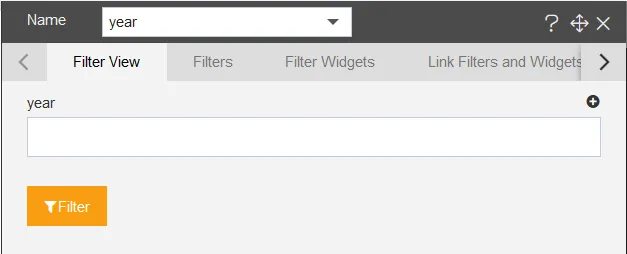
- As you click on the filter icon, the filter dialog box pops up on the dashboard, as shown in the figure below:
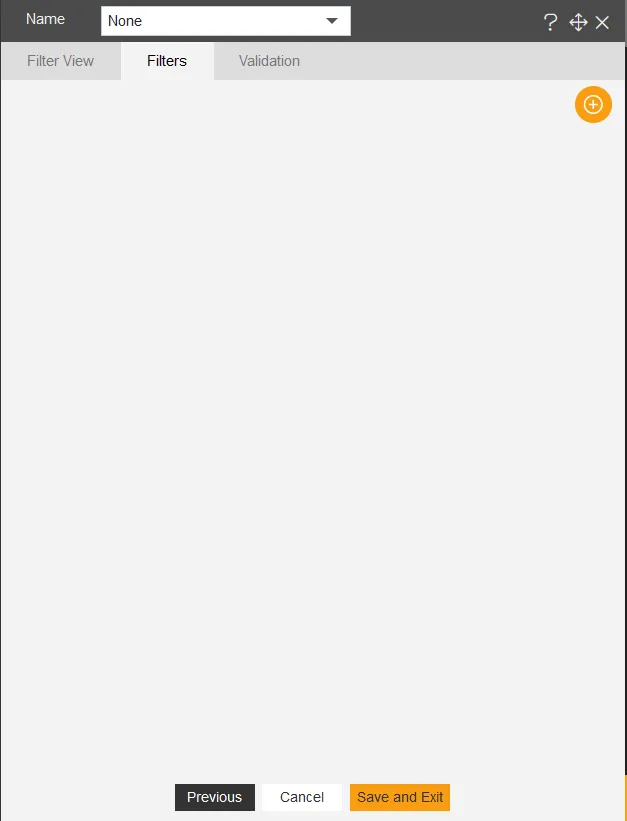
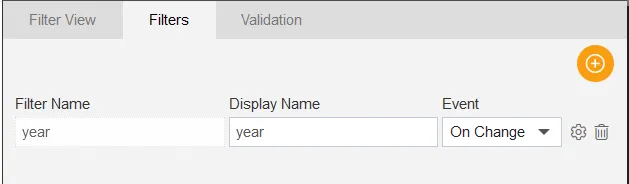
- Click on the plus icon to add a filter, and enter the name of the filter, as shown in the figure below:
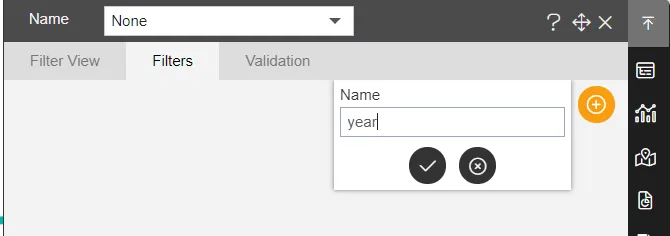
NOTE: Make sure the name of the filter you apply is the same you have applied in the filter event while creating buttons.
-Here year is the name of dummy filter that we need to create.
- Click on the check icon to add the filter. after that, edit the click Event from On Click to On Change, as shown in the figure below:
-
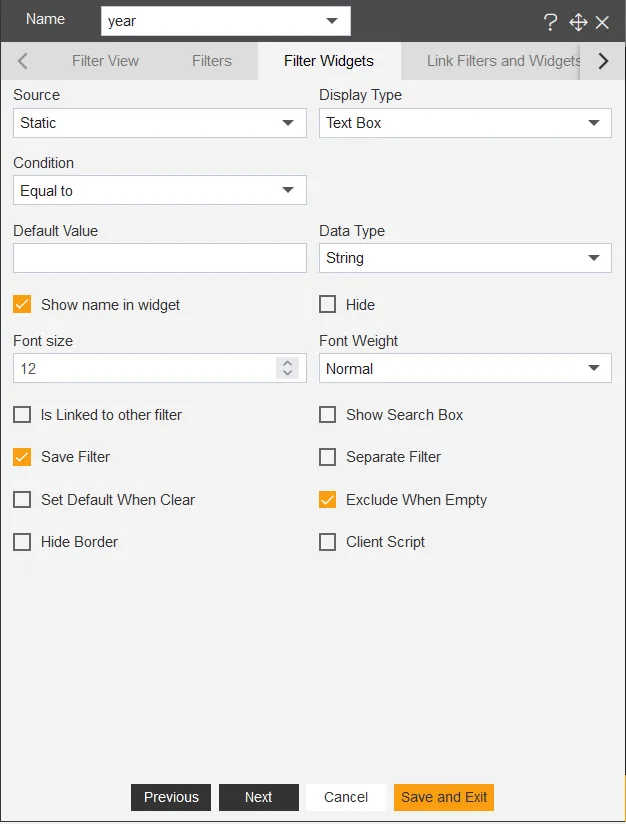
Now, click on the setting icon from the right side of the filter dialog box.
-
After landing to filter widgets tab, select display type as Textbox.
- To link the year filter to the widget, click on Layer dropdown and select Layer1, From Tabs dropdown select Tab1, From Widgets dropdown select sales table.
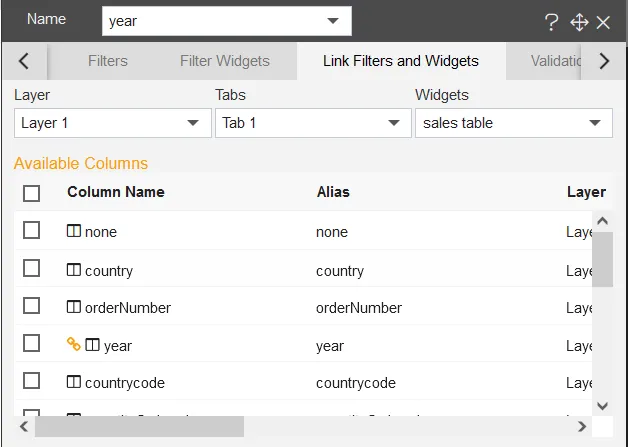
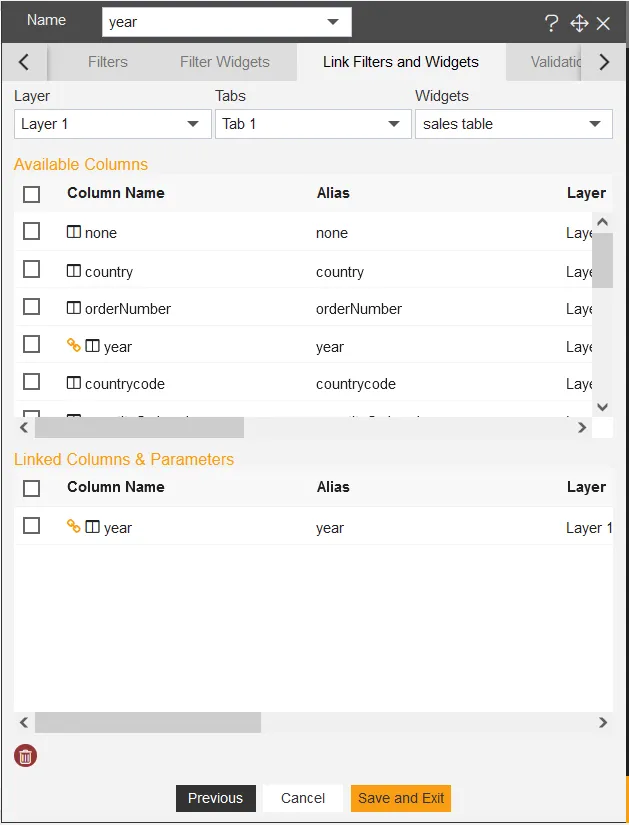
- From available columns of the sales table. select the year column, it will appear in the linked columns & parameter box.
- Go to the filter view tab from the top of the tabs bar, click on the Plus icon (+) on the top right corner of the year filter. Click on the save and exit button. And go to preview mode.
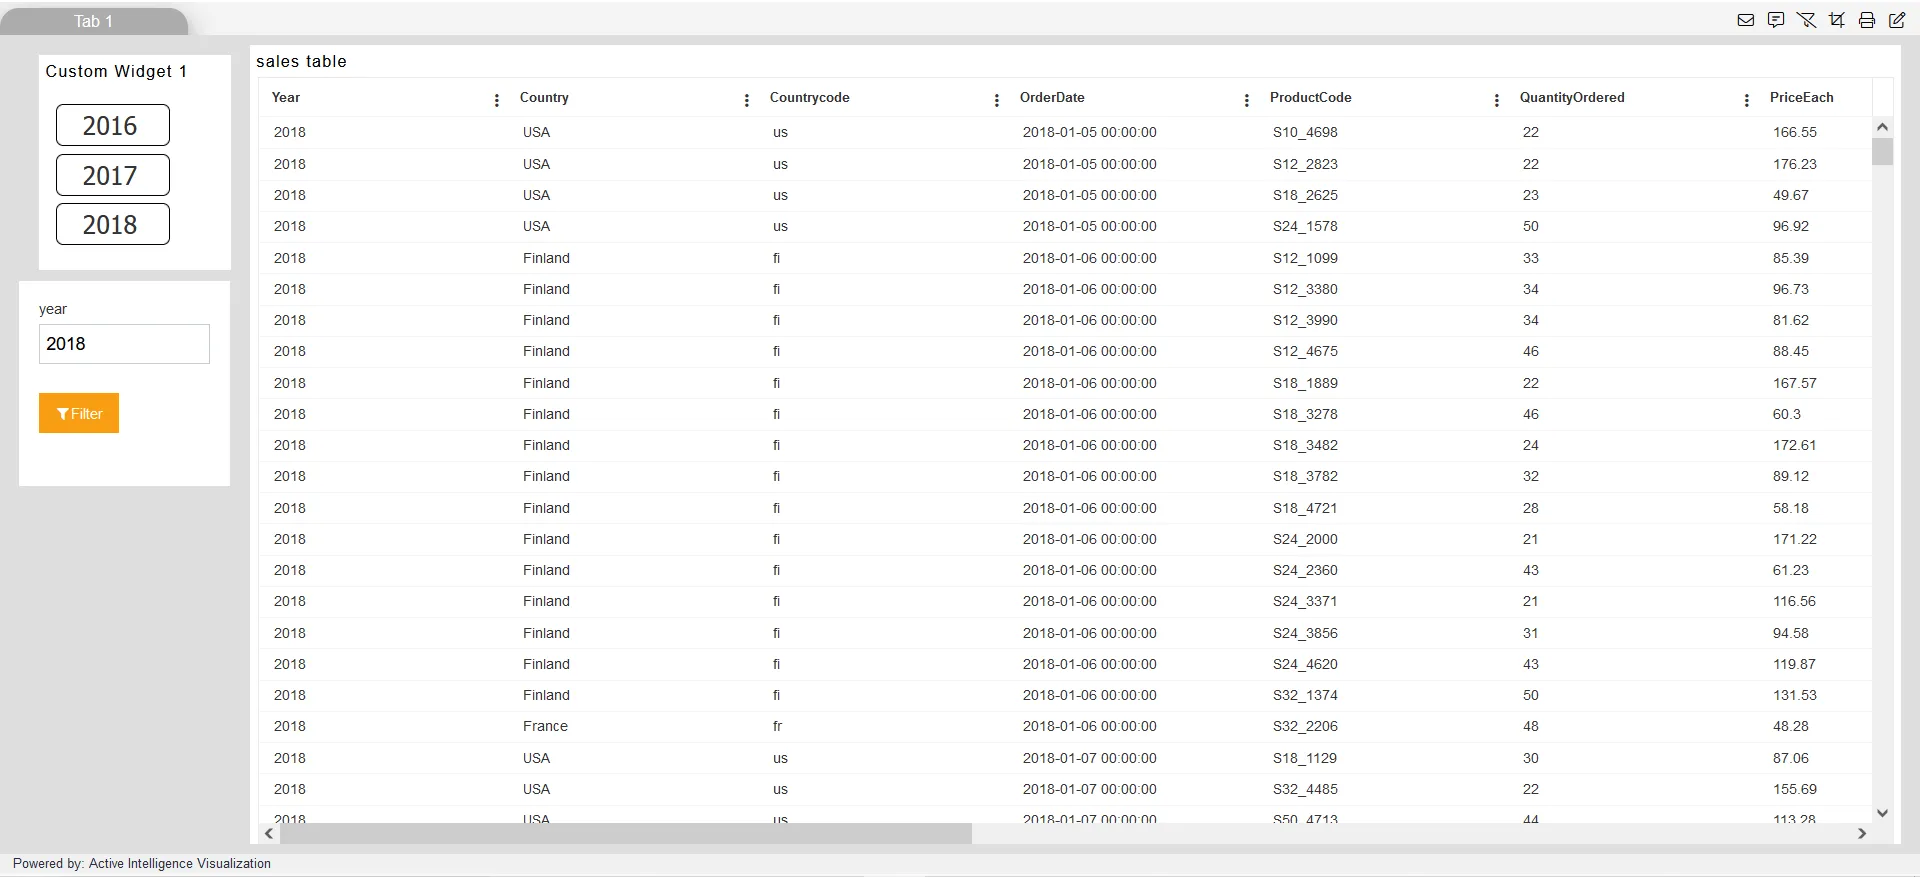
- The example screen below shows the custom visualization and widget connection through the filter.
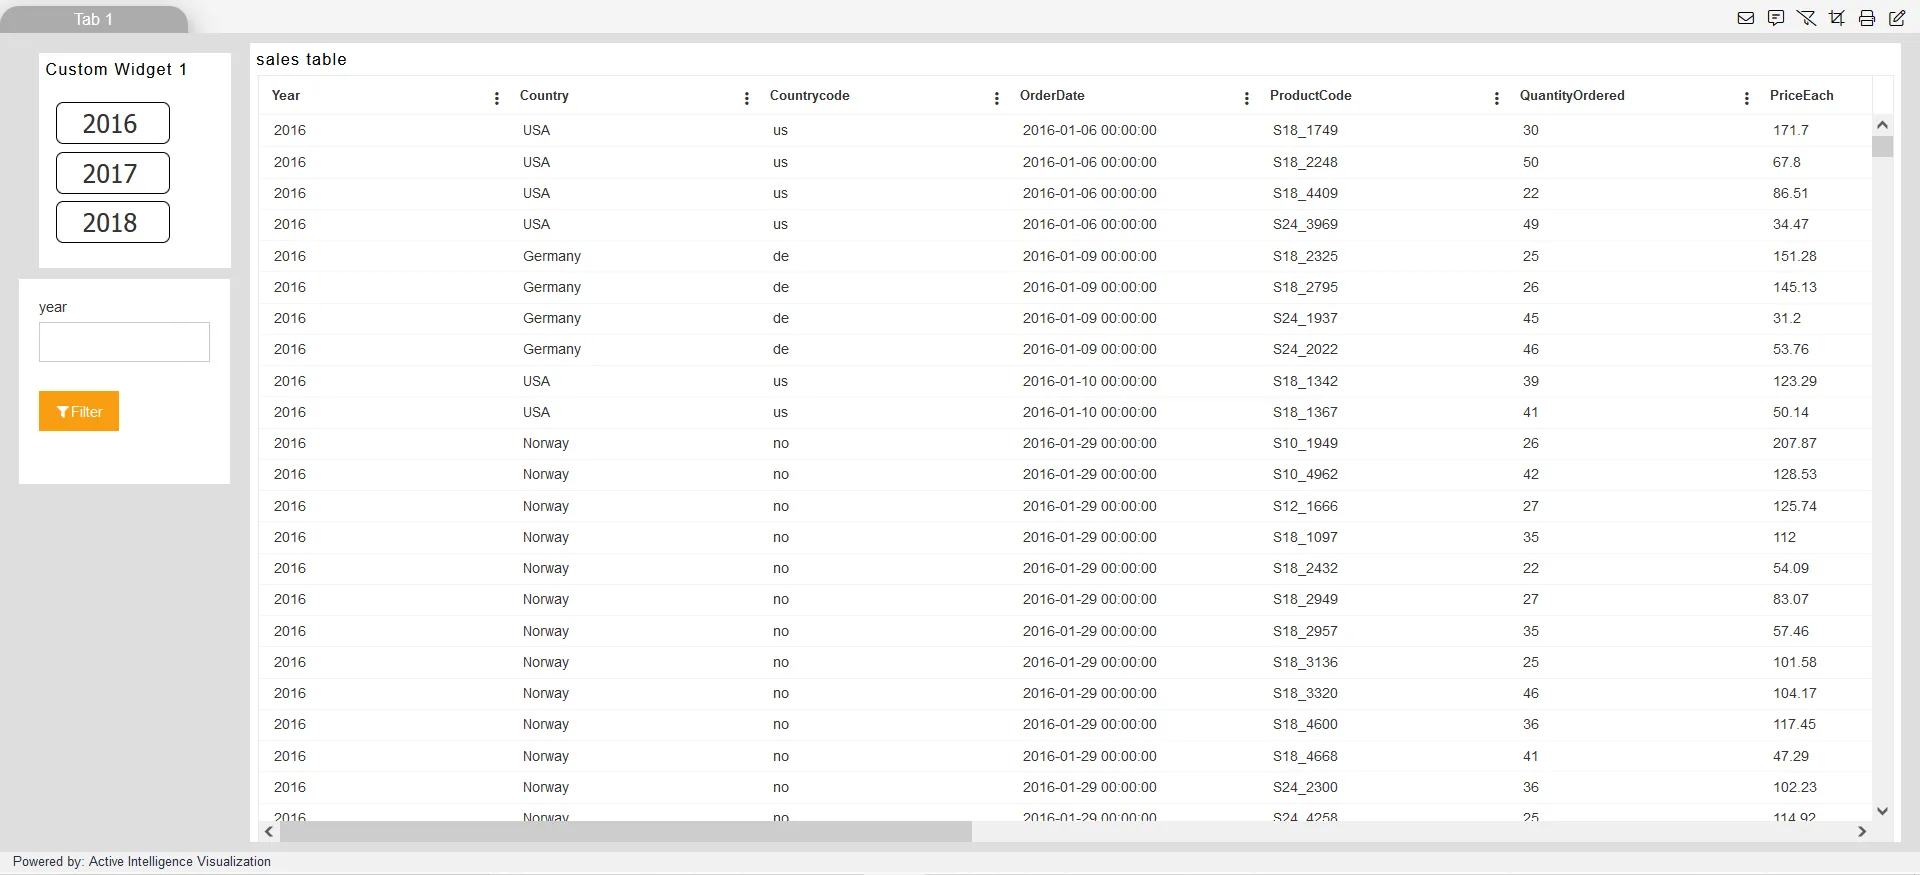
- As the user selects the custom filter button, it passes on the selected value of the filter and filters the table widget as the year selected. As shown in the figure below:
- Now, you can hide the filter using Bring Forward and Send Backward. To enable it, click on the ellipse icon from the top-right corner and select send backward, and drag under any of the widgets.