Create Dataset
In AIV, a Dataset is a structured data model used to transform raw data into meaningful information for visualizations (VIZ) and reports.
After connecting a datasource, creating a dataset is the next essential step. Datasets allow users to filter, aggregate, join, transform, and refine data according to business requirements.
For definitions of terms used throughout this workflow, see Dataset Terminology.
Prerequisites
Before creating a dataset, ensure that:
- A datasource has been successfully configured and connected from the Master Data section.
- You have the necessary access permissions to create datasets.
Workflow Overview
Creating a dataset involves the following steps:
- Navigate to the Dataset Section
- Create a New Dataset
- Define Dataset Details
- Configure Query Logic
- Configure Output Columns
- Preview Dataset
- Save Dataset
Step 1: Navigate to the Dataset Section
-
Click the Hamburger Menu (
 ).
). -
Expand the Master Data section.
-
Select Datasets.

-
The Dataset Grid screen opens, displaying all existing datasets.
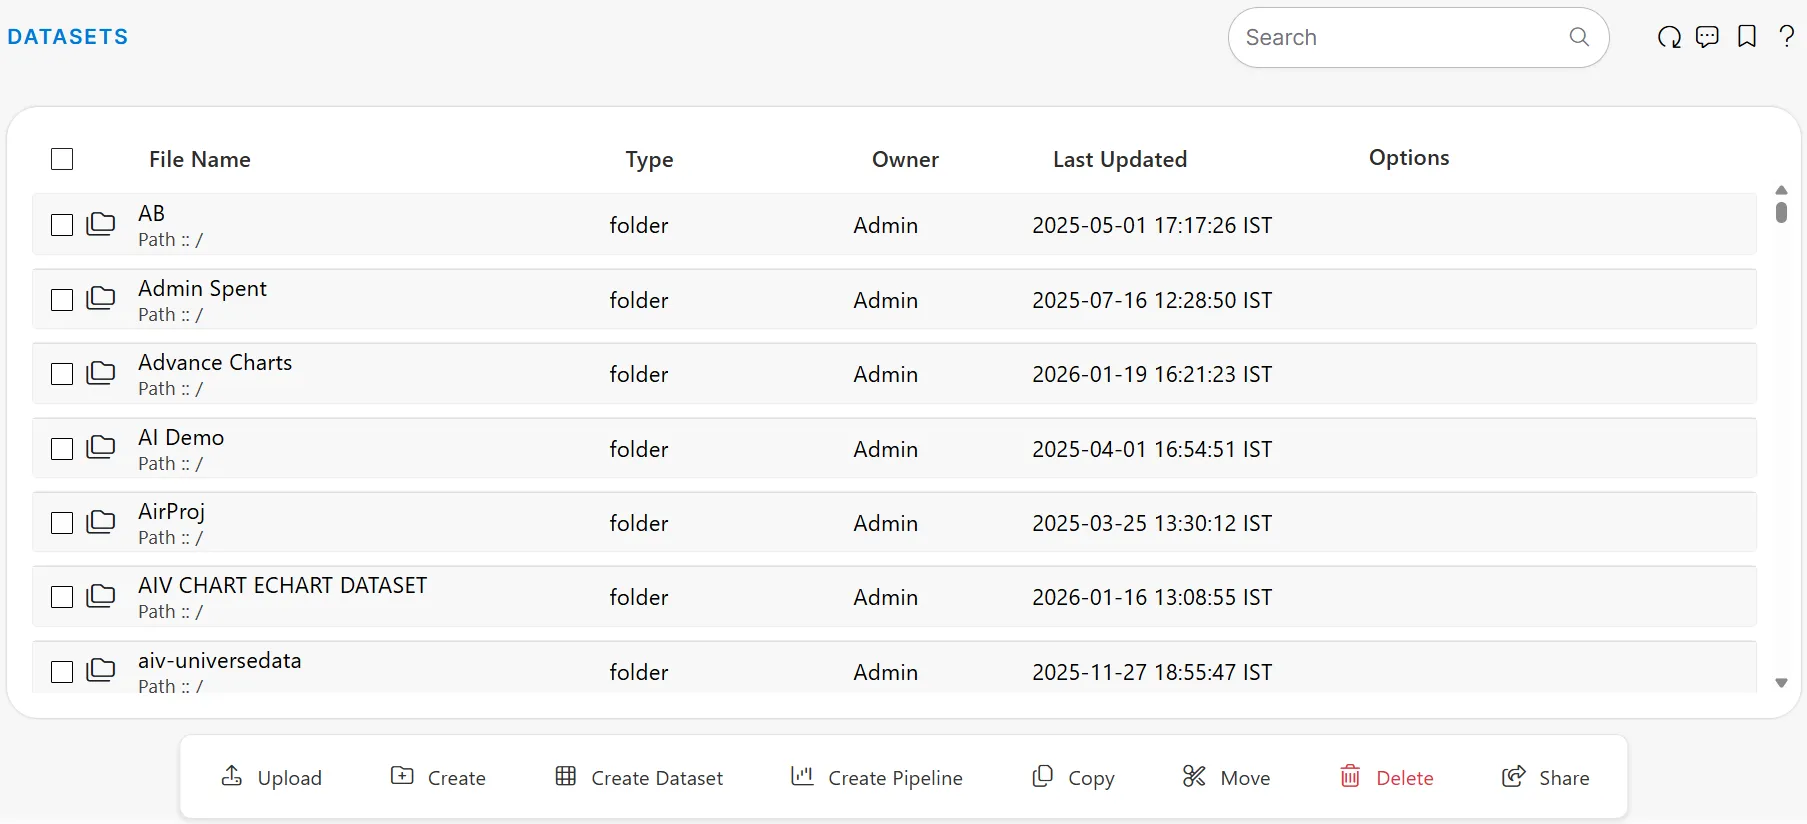
Step 2: Create a New Dataset
From the Dataset Grid, you can create a dataset using either of the following methods:
Option 1: Footer Menu
-
Click the Create Dataset button in the footer.

Option 2: Context Menu
-
Right-click on an empty space within the grid.
-
Select Create Dataset.
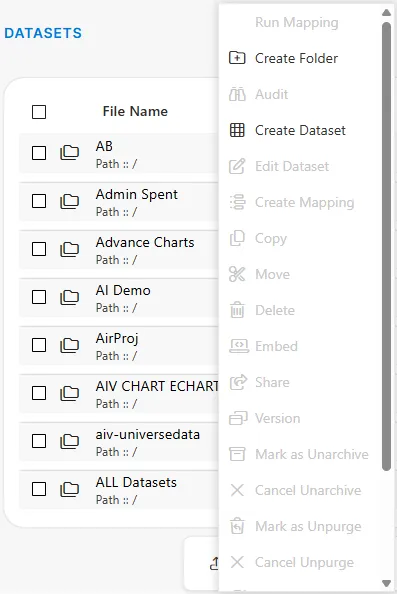
-
The Create Dataset screen will appear.
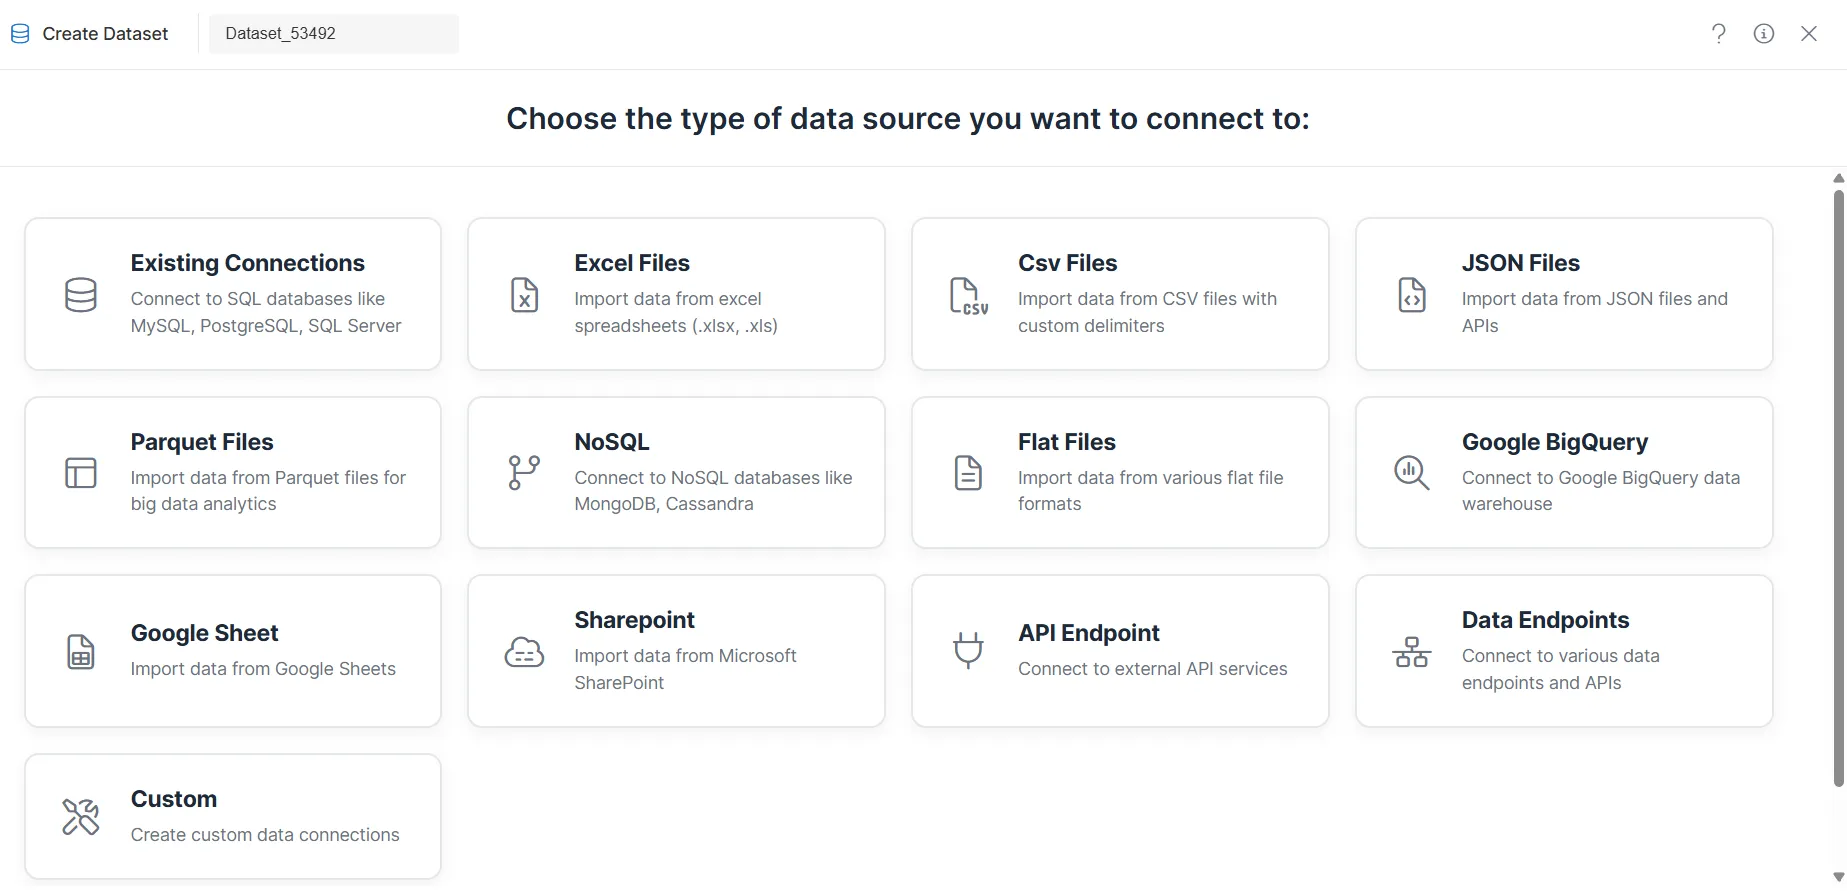
Step 3: Define Dataset Details
This step corresponds to Step 1 – Data Source Selection and Step 2 – Connection Selection in the dataset workflow. See Data Source Selection Terminology and Connection Selection Tab Terminology for detailed explanations.
Dataset Name
- Enter a meaningful and descriptive name.
- The name can also be modified later in the Dataset Editor or during the Save process.
Source
-
Select the appropriate source type (e.g., Existing Connections, Excel Files, CSV Files).
-
Choose the connected datasource.
Select Database
- Search for the required database by typing its name.
- Select the database to open the Dataset Editor.
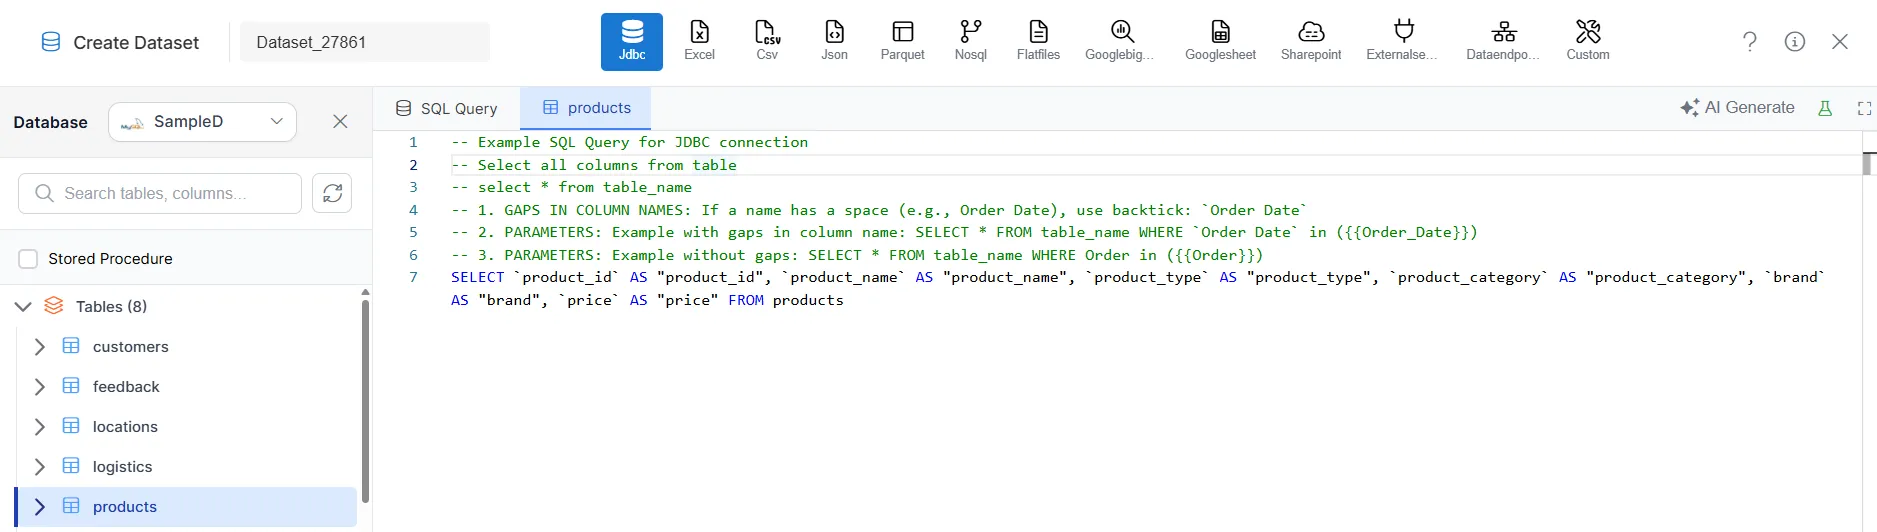
Step 4: Configure Query Logic
Once inside the Dataset Editor, you can retrieve data using one of the following methods.
View Available Tables
Expand the table tree structure to view available tables:

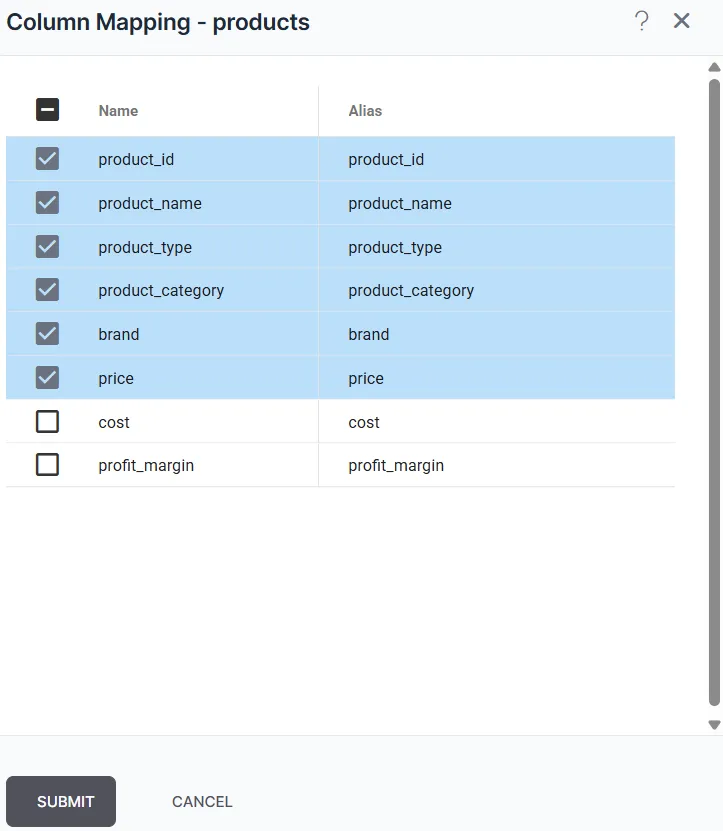
Option A: Drag & Drop
-
Drag and drop a table into the editor.
-
A list of columns from the selected table will appear.
-
Select or deselect required columns using the checkboxes.
-
Click SUBMIT.
-
The system automatically generates the SQL query.
Option B: Quick Table Query
- Click directly on a table.
- A simple query is automatically generated to display its contents.
Option C: Custom SQL
- Manually write a custom SQL query when advanced filtering, joins, or transformations are required.
Step 5: Configure Output Columns
See Output Columns Tab Terminology for detailed explanations of all configuration options, including aliases, data types, format transformations, and overwrite data type.
-
Navigate to the Output Columns tab.
-
Review all columns returned by the query.
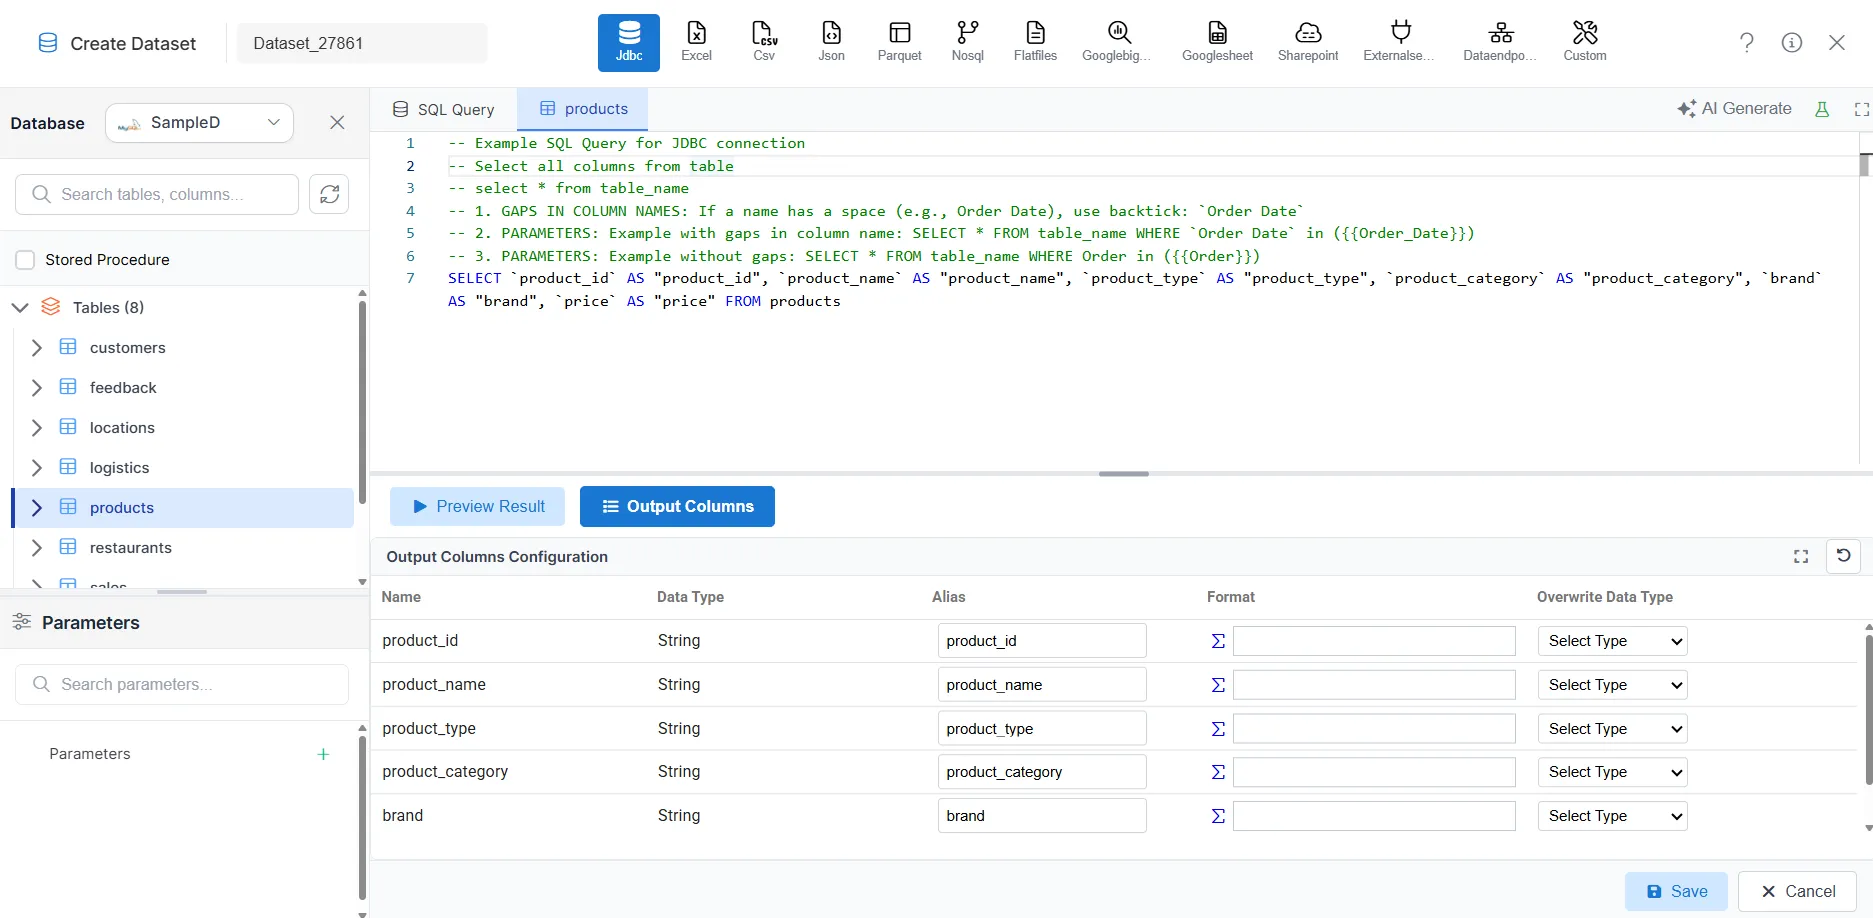
Available Configuration Options
- Rename columns using the Alias field.
- Modify data types.
- Apply formatting rules.
- Apply transformation functions.
Date Formatting Example
- Verify if the column data type is Date.
- If not, convert it using Select Type.
- Apply the required date format (e.g., convert
2024-12-01to01-12-2024).
Apply String Transformations
Click the Σ (Sigma) icon next to the Format field to apply available transformation functions:
- toLowerCase – Converts text to lowercase
- toUpperCase – Converts text to uppercase
- charAt(position) – Extracts a character at a specific position
- substr(start, length) – Extracts a substring
Step 6: Preview Dataset
See Preview Tab Terminology for detailed explanations of preview options, filtering, and validation features.
-
Click Preview Result.
-
The system displays up to 500 records.
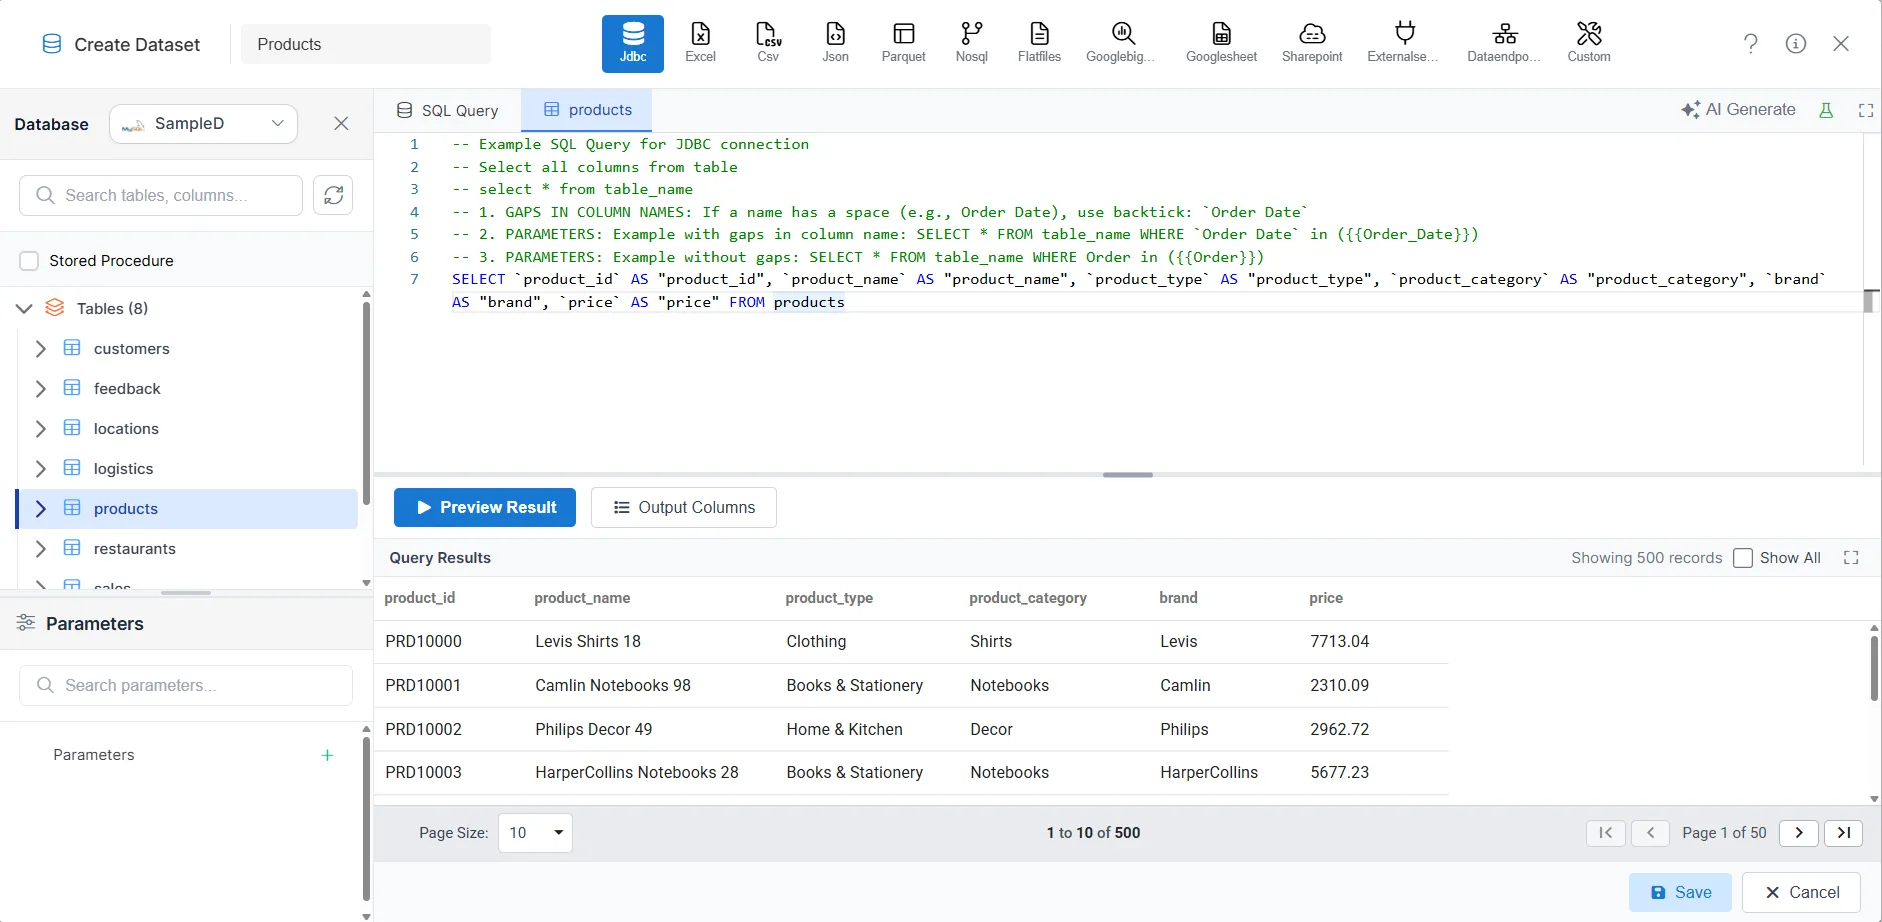
This step allows you to validate data structure, formatting, and transformations before saving.
Step 7: Save Dataset
-
Click Save.
-
The Save Dataset dialog box appears.
-
Optionally rename the dataset.
-
Select the destination folder.
-
Click Save Dataset to confirm.

-
A confirmation message appears upon successful creation.

-
The dataset will now be visible in the Dataset Grid View.
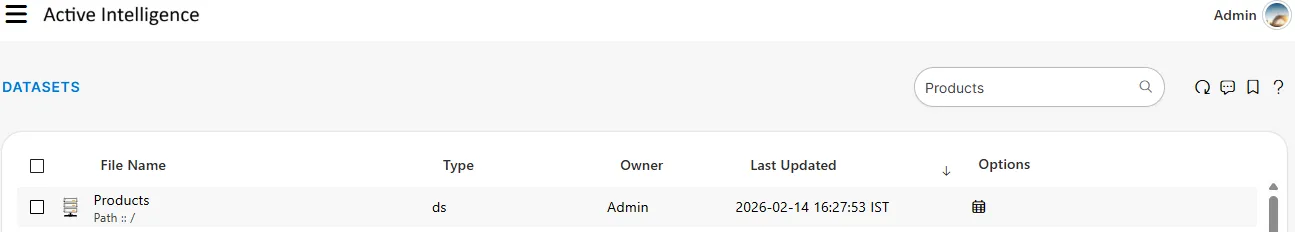
The dataset is now ready to be used for building visualizations (VIZ), dashboards, and reports within AIV.