Right Join
Create Right Join in Pipeline.
Introduction
The right join in a pipeline on AIV enables users to combine data from multiple tables, beginning with selecting data from the right table and matching it with rows from the left table. The right join returns a result set that includes all rows from the right table, regardless of whether they have matching rows from the left table. This document will provide guidance on how to create a pipeline that utilizes the right join to connect multiple tables and create the pipeline dataset.
Prerequisites
The prerequisites for setting up an inner join pipeline typically include :
-
Access to the AIV application with appropriate permissions.
-
Availability of datasets or tables to be joined.
-
Understanding of the common field or column on which the join operation will be performed.
-
Knowledge of the right join concept and its application in combining data from multiple sources.
-
Familiarity with the AIV interface for creating and configuring pipelines.
-
Working parameter datasets, particularly if dynamic filtering or conditions are involved.
-
Clear understanding of the desired output and how the joined data will be utilized downstream.
These prerequisites ensure a smooth setup and execution of the inner join pipeline within the AIV environment.
Objective
Follow steps to create Inner-Join Pipeline in AIV :
-
Download Pipeline.zip File: Access the link provided to download the Pipeline.zip file to your local system. Download Pipeline.zip file from the link given. Pipeline.zip
-
Extract the ZIP File : Once the download is complete, extract the contents of the Pipeline.zip file to a folder on your computer.
-
Access AIV Platform : Log in to the AIV platform using your credentials.
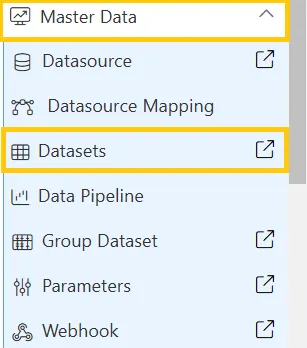
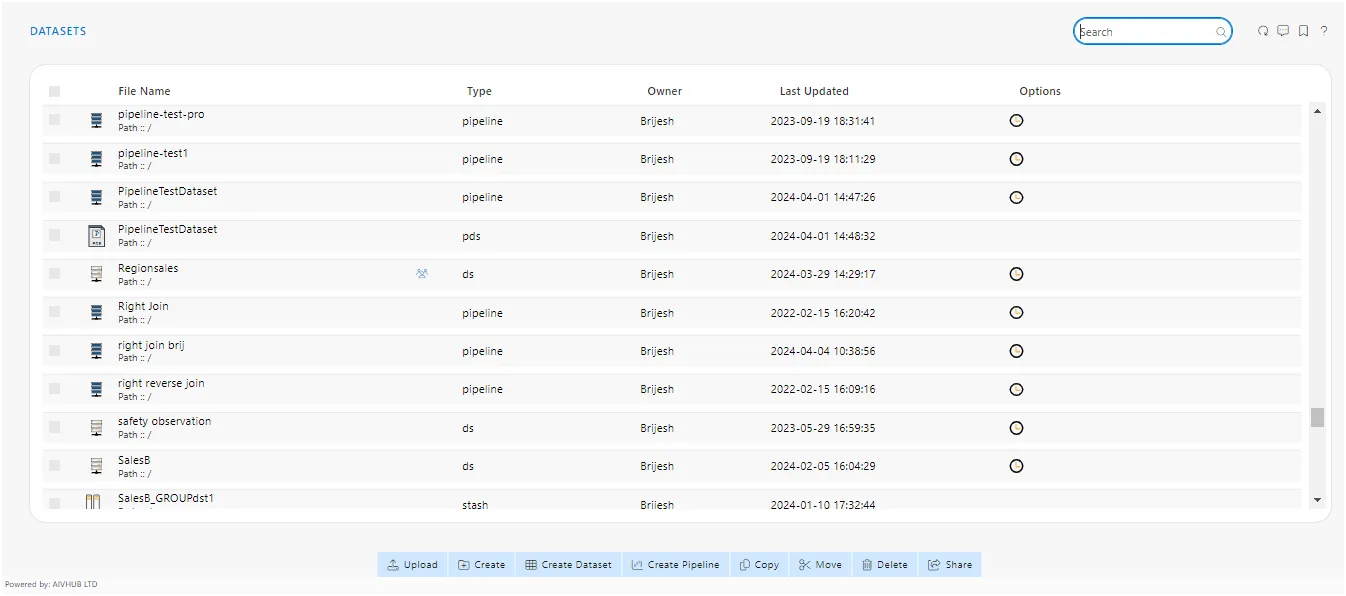
Navigate to the Dataset section and click on “Create Pipeline” located in the bottom menu bar, as illustrated in the figure below.
![]()
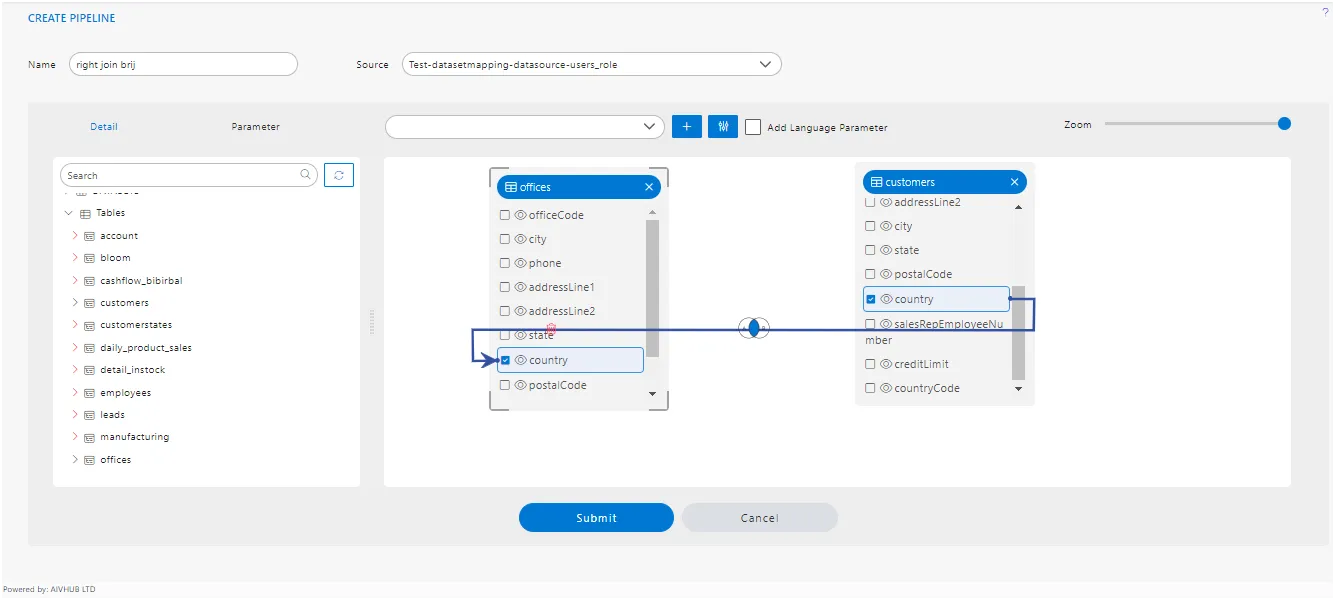
After clicking, you will see a blank window for creating a pipeline, as depicted in the image below.
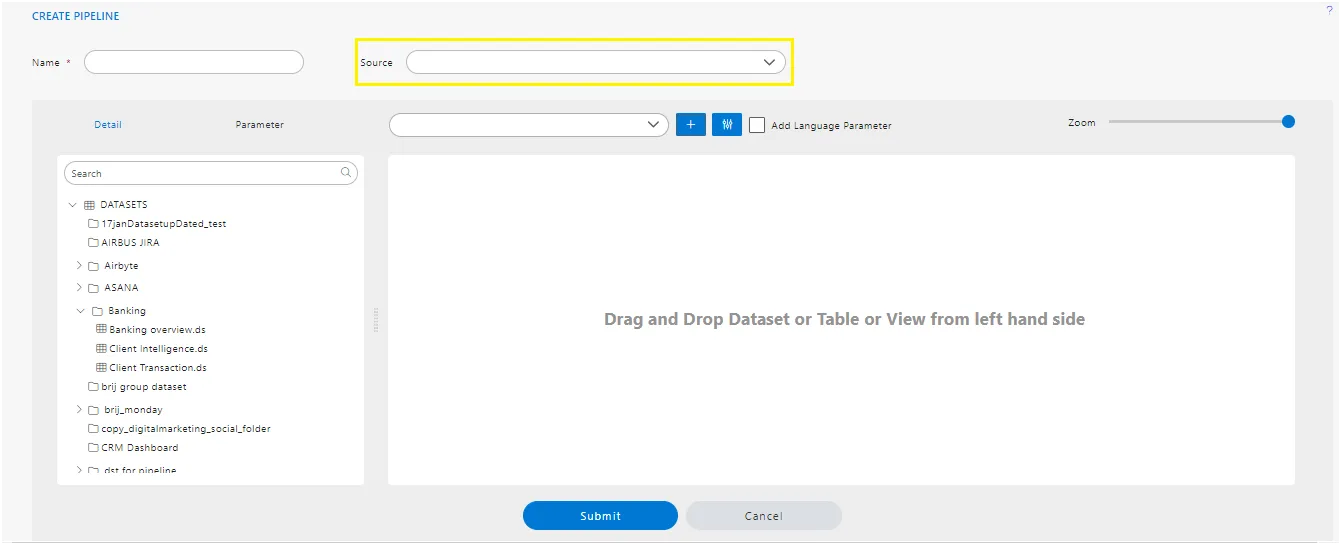
Enter the Following detail in the Pipeline dialog box:
Name: right join brij
Source: Test-datasetmapping-datasource-users_roleTest-datasetmapping-datasource-users_role (select as per your requirement)
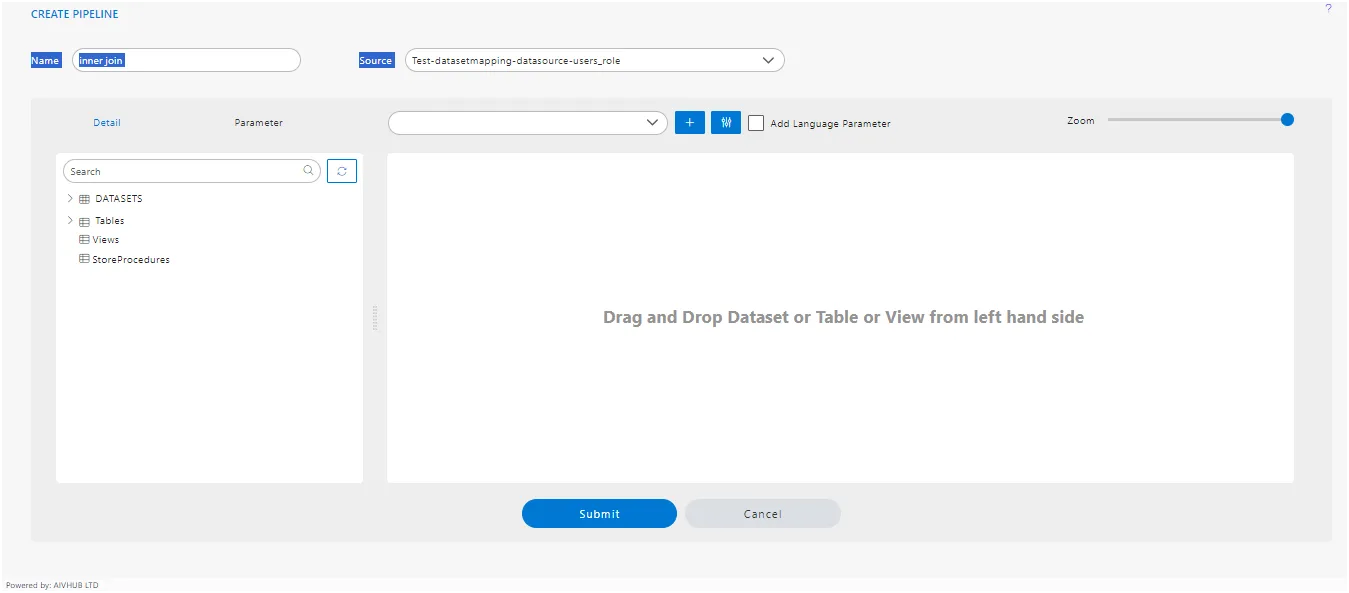
Expand tables from the left side table view, As shown in the figure below.
Drag and drop the “offices” from the list of tables,datasets to the diagram box on the right side, then select all the columns of the “offices”, as shown in the figure below.
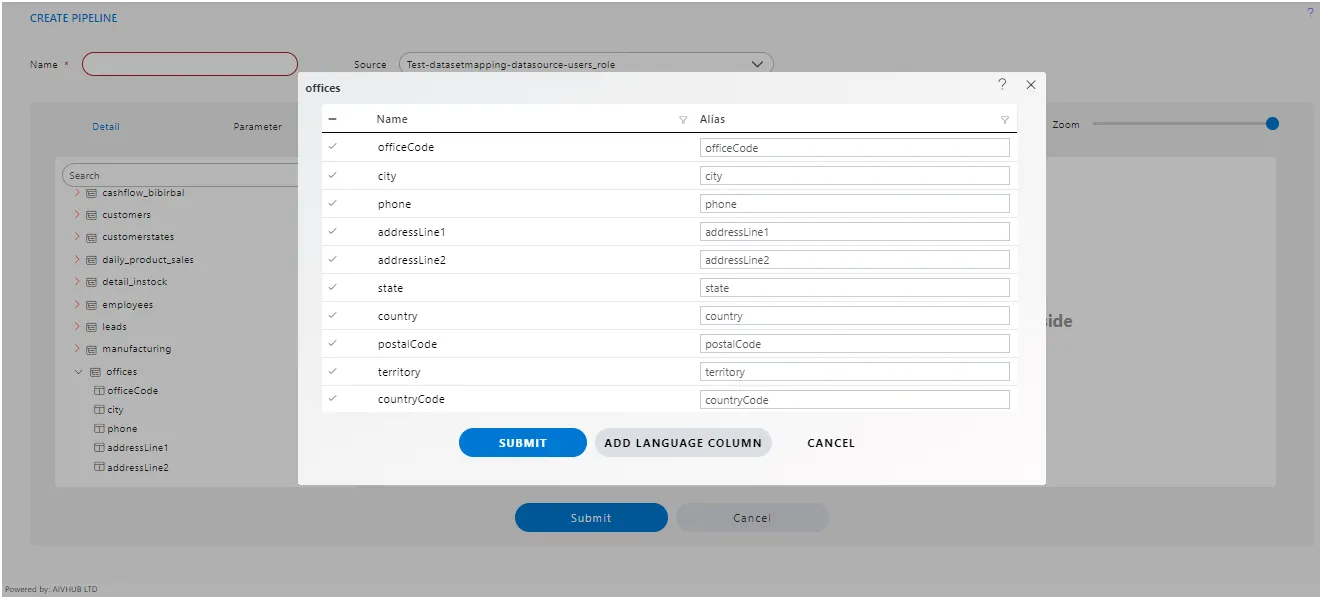
After clicking the submit button, the diagram box will resemble the figure below.
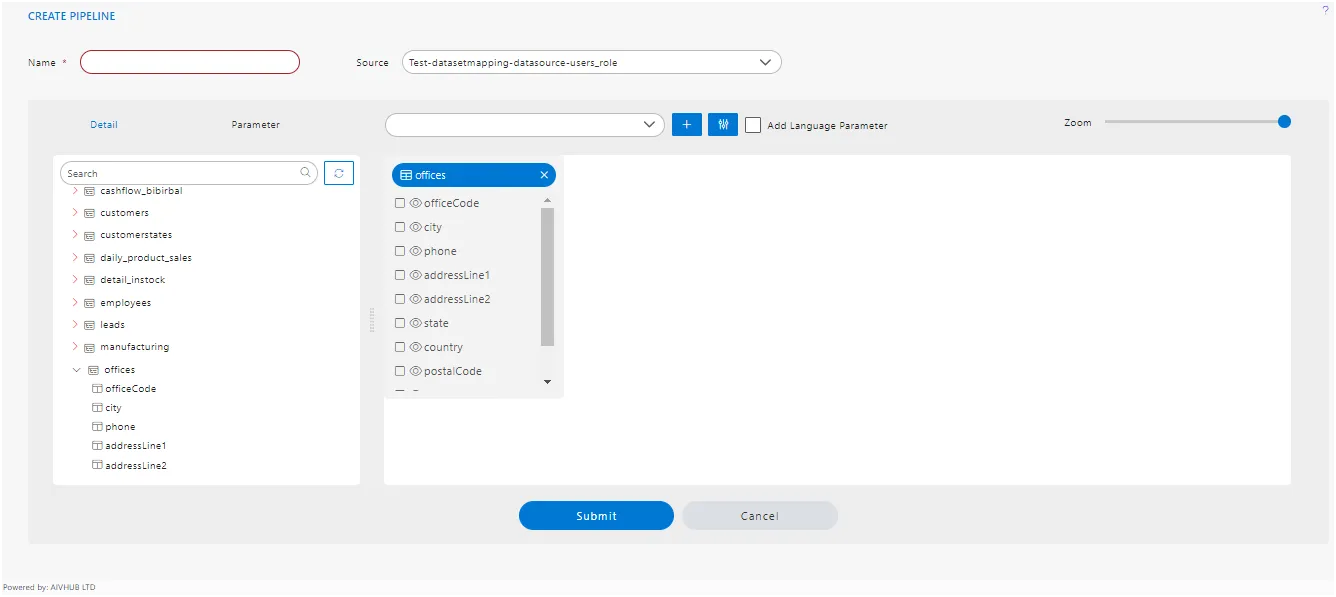
Drag and drop the customers from the left table menu to the right diagram box.
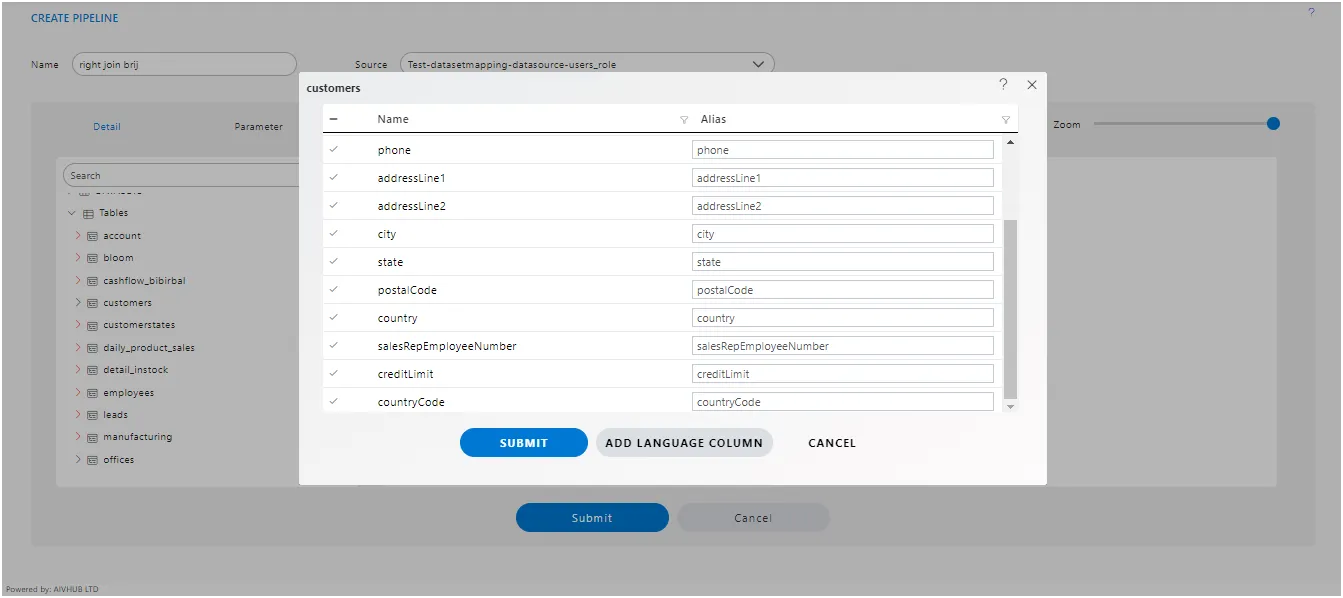
Select all the columns from the Customers table, and click submit button.
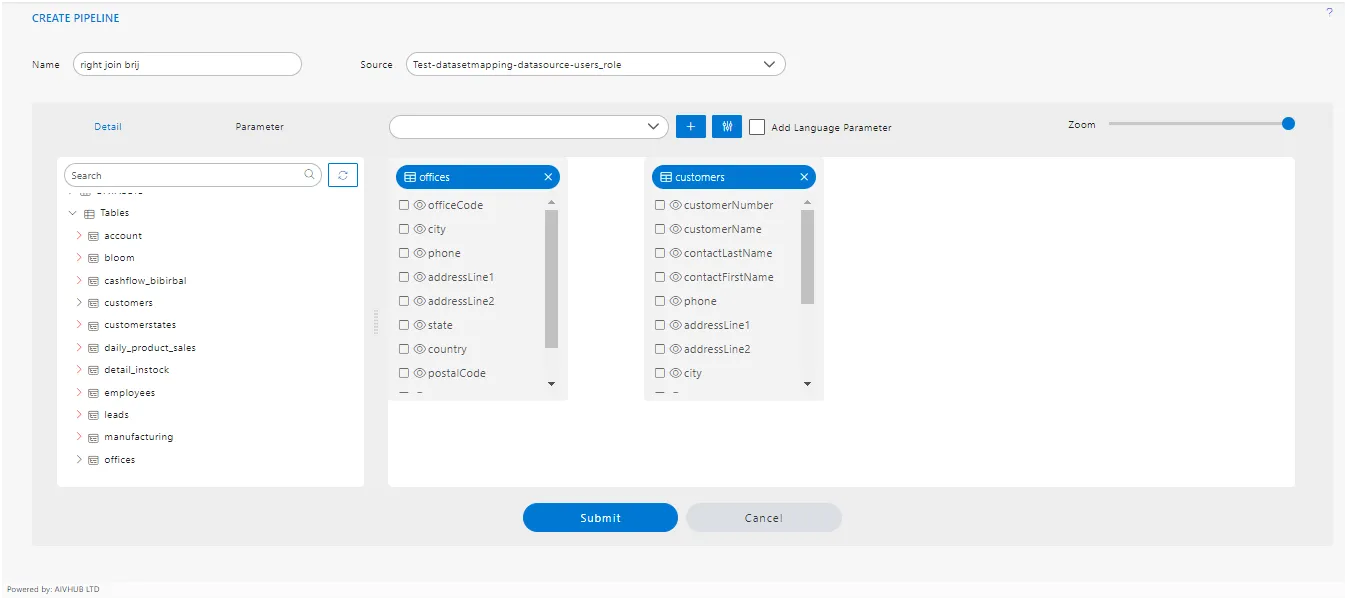
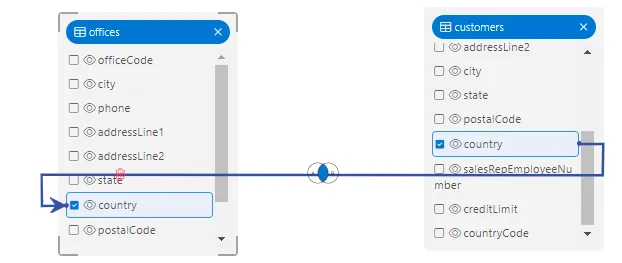
After adding offices and customers from the table and datasets list, Drag the country column from offices to customers, as shown in the figure below.
Click on the join between the two tables to add Pipeline configuration.
The Pipeline configuration control box will open. Select the Inner Join radio button and click on the Submit button, as shown in the figure below.

Click on Submit button. The Connection between the two tables will look as shown in the figure below.
Click on Submit to save the Pipeline.your pipeline dataset should be visible on dataset section of Aiv.
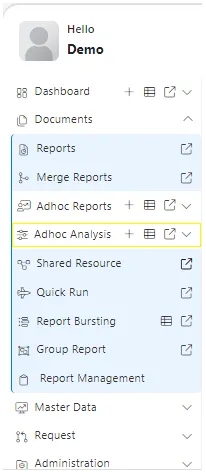
Go to Documents > Adhoc Analysis section from the Hamburger menu. In Adhoc Analysis, click on the + icon to create a new Analysis, as shown in the figure below.
When you click on create Analysis then the Analysis Selection dialog box will open, as shown in the figure below.
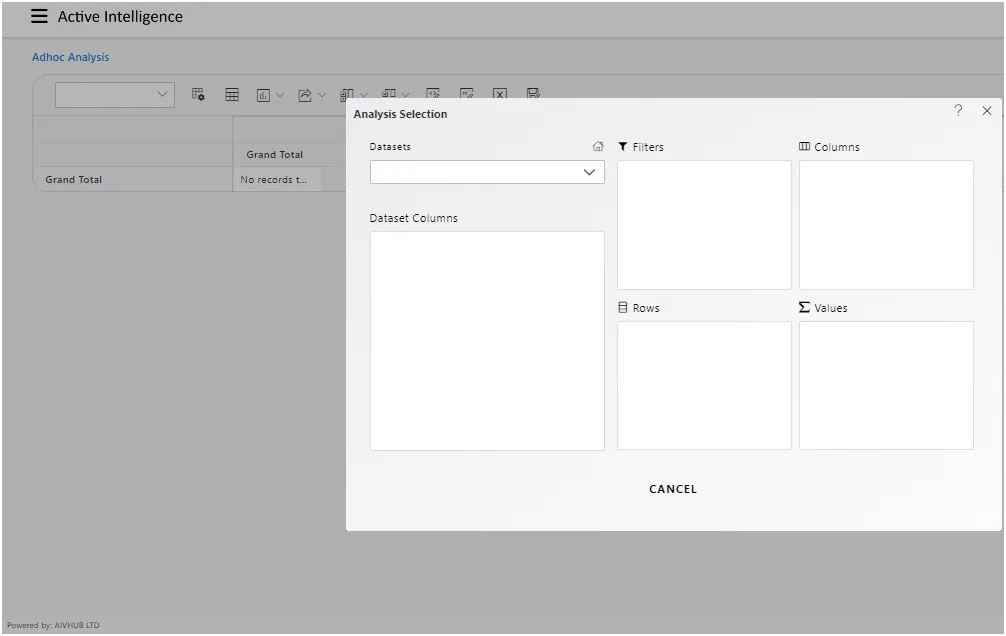
Enter the following details in Analysis Section.
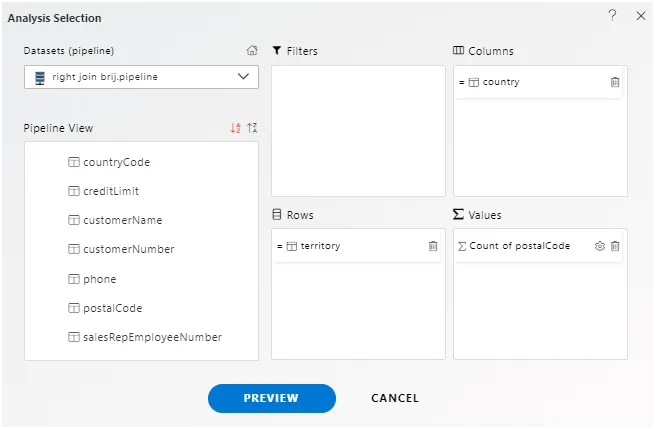
Dataset: right join brij.ds (select the Pipeline, which you are created)
The two tables will get load the left side box of Pipeline view, Now expends the OFFICES table.
Drag and drop a territory column from OFFICES to Rows, Drag and drop the country column from OFFICE and put it in the Column box, and drag and drop the postalcode column from Customers to Values box (Select count in Type), as shown in the figure below.
Click on Preview Button it will show the output and after the preview click on Cancel Button it will show the screen as follows :
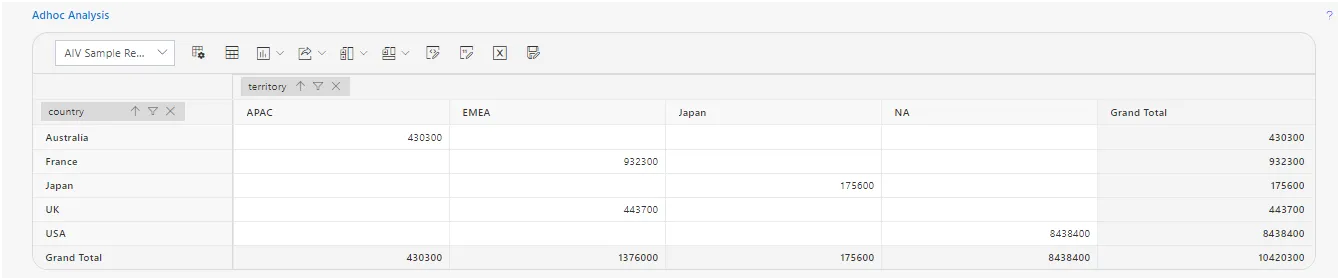
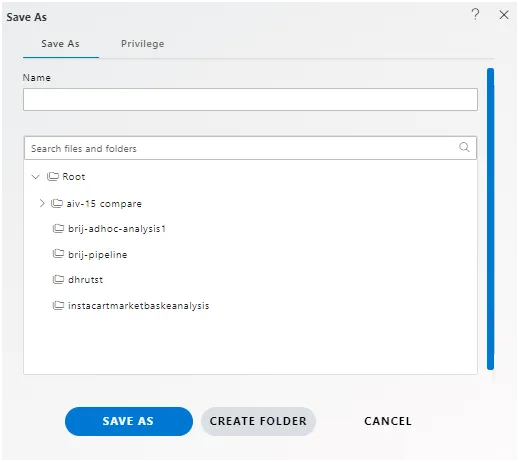
Click on Save as icon for saving the Analysis, it will show the screen as below.Give the name of Analysis.
![]()