AIV Insight Buddy
AIV Insight Buddy is an intelligent data analysis assistant that automatically generates comprehensive insights from dashboard visualizations. Leveraging advanced artificial intelligence, Insight Buddy transforms complex data patterns into clear, actionable intelligence, enabling users to make informed decisions rapidly and confidently.
Core Capabilities
Automated Insight Generation
Insight Buddy provides instant, AI-powered analysis of dashboard widgets with a single click. The system processes visualization data and delivers structured insights that highlight critical trends, patterns, and opportunities within seconds.
Usage Example:
Action: Select the insight icon on any dashboard widget
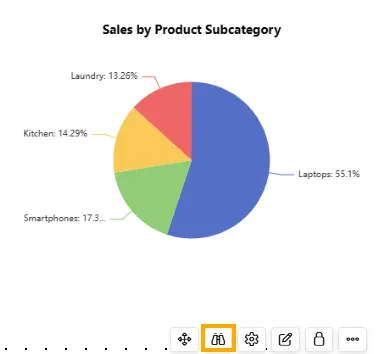
Output: Comprehensive three-part analysis including findings, recommendations, and Q&A
Widget-Level Analysis
Users can target specific charts or data visualizations for detailed examination. Insight Buddy supports multiple visualization types including:
-
Bar charts and column charts
-
Line graphs and area charts
-
Pie charts and donut charts
-
Scatter plots and combo charts
-
Data tables and matrices
Structured Analysis Framework
InsightBuddy delivers insights organized into three distinct sections, each serving a specific analytical purpose:
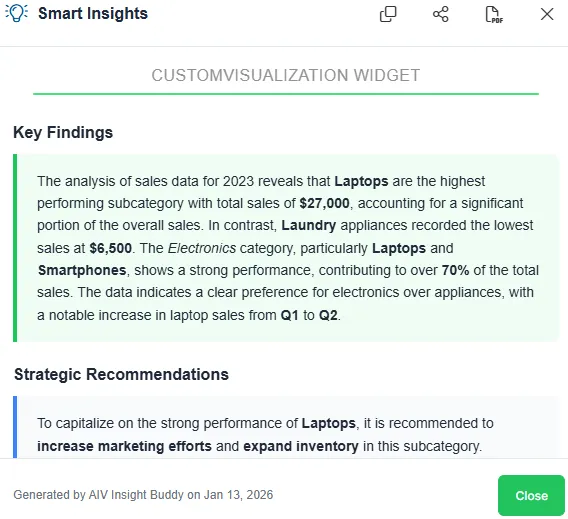
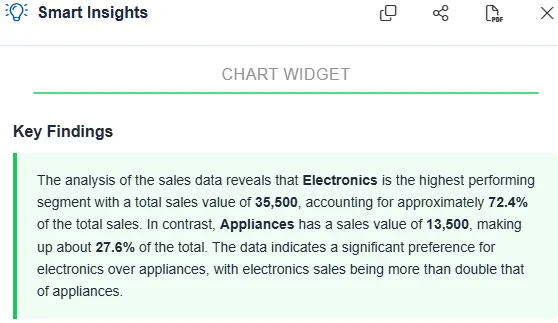
1. Key Findings
This section presents critical discoveries extracted from the data, featuring:
-
Quantitative metrics with precise values and percentages
-
Identified trends, patterns, and anomalies
-
Performance comparisons across segments
-
Highest and lowest performing data points
Example Analysis:
For a product sales visualization, key findings might reveal:
The analysis of sales data for 2023 reveals that Laptops are the highest performing subcategory with total sales of $27,000, accounting for a significant portion of the overall sales. In contrast, Laundry appliances recorded the lowest sales at $6,500. The Electronics category, particularly Laptops and Smartphones, shows a strong performance, contributing to over 70% of the total sales. The data indicates a clear preference for electronics over appliances, with a notable increase in laptop sales from Q1 to Q2.
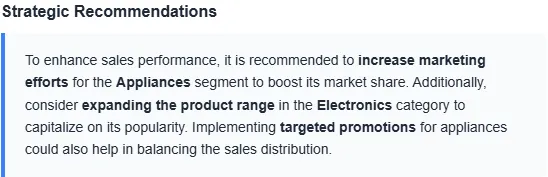
2. Strategic Recommendations
This section provides actionable guidance based on the analytical findings:
-
Specific process improvement strategies
-
Resource optimization opportunities
-
Production or inventory adjustment recommendations
-
Implementation roadmaps for suggested actions
Example Recommendations:
To capitalize on the strong performance of Laptops, it is recommended to increase marketing efforts and expand inventory in this subcategory. Additionally, consider promotional campaigns for Smartphones to boost sales further. For the Appliances category, particularly Laundry, explore customer feedback to identify potential improvements or bundle offers to enhance sales.
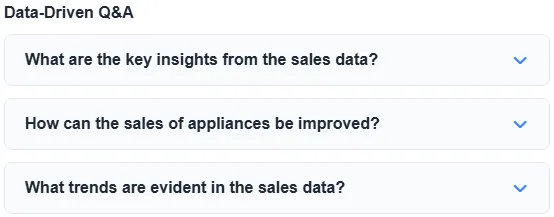
3. Data-Driven Q&A
This section addresses relevant questions about the analyzed data with detailed, comprehensive responses. The number of question-answer pairs (typically 3-6) scales according to data complexity and depth of available insights.
Q&A Structure:
-
Opening Summary: Concise overview with key metrics (2-3 sentences)
-
Critical Insight Box: Highlighted finding with visual emphasis and contextual labeling
-
Detailed Breakdown: Structured analysis using subheadings and bullet points
-
Contextual Recommendations: Additional guidance and actionable next steps
Example Q&A:
Question: What are the key sales trends for 2023?
Answer:
The key sales trends for 2023 highlight a strong preference for Electronics, with Laptops leading the sales figures.
🏆 Top Performer: Laptops achieved the highest sales at $27,000.
Breakdown:
- Laptops: $27,000
- Smartphones: $8,500
- Kitchen Appliances: $7,000
- Laundry Appliances: $6,500
The data suggests a growing demand for electronics, particularly laptops, which saw a significant increase from Q1 to Q2. To maintain this momentum, consider enhancing product features and customer engagement strategies.
Feature Set
Professional Formatting
Insights utilize professional formatting standards to enhance readability and comprehension:
-
Bold emphasis for critical metrics and values
-
Italic styling for key terminology and concepts
-
Color-coded highlight boxes for priority findings
-
Visual indicators (icons and emojis) for categorical organization
-
Structured layouts with clear hierarchical organization
-
Bullet points and numbered lists for systematic presentation
Real-Time Processing
Insight Buddy operates on current data, ensuring that all generated insights reflect the most recent information available in the dashboard. The system processes data dynamically, adapting to changes in underlying datasets without manual intervention.
Export and Collaboration
Generated insights can be efficiently shared and documented:
-
Copy to clipboard for quick integration into reports
-
Export for inclusion in presentations and documentation
-
Share with team members and stakeholders
-
Reference in decision-making meetings and strategy sessions
Implementation steps for generating insights
-
Access Dashboard: Navigate to the dashboard containing relevant data visualizations
-
Select Widget: Identify the chart, graph, or data visualization requiring analysis
-
Disable Insights: Open the widget settings and disable the Hide Insights option.
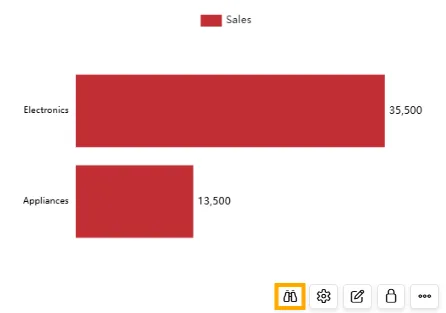
-
Initiate Analysis: Click the binoculars icon located at the bottom-right corner of the selected widget.
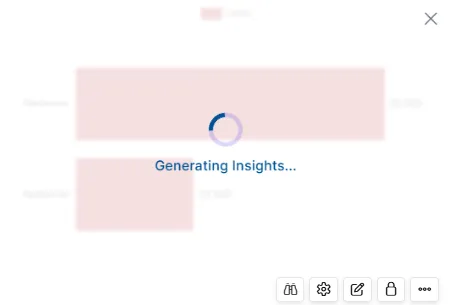
-
Processing: A dialog box appears displaying “Generating Insight…” while the AI processes the data
-
Review Results: The system presents insights organized into three sections:
-
Key Findings: Review primary discoveries and trends
-
Strategic Recommendations: Examine actionable improvement strategies
-
Data-Driven Q&A: Explore detailed answers to relevant questions
-
-
Apply Insights: Implement recommended actions based on the analysis
-
Document & Share: Copy or export insights as needed for collaboration and reporting
Business Value
-
Time Savings: Eliminates hours of manual data analysis and interpretation
-
Rapid Decision-Making: Provides immediate insights for timely business decisions
-
Automated Intelligence: Reduces dependency on specialized analytical resources
-
Pattern Recognition: Identifies hidden trends and correlations in complex datasets
-
Predictive Intelligence: Highlights emerging patterns before they become critical
-
Risk Mitigation: Flags potential issues and performance gaps proactively