Decimal values in chart tooltip
Decimal values in chart tooltip : This video contains how to add Decimal values in chart tooltip.
This is an add-on feature on the existing functionality of the series tooltip of charts.
Use Case: Need to Add Decimal places in series tooltip of chart widget.
-
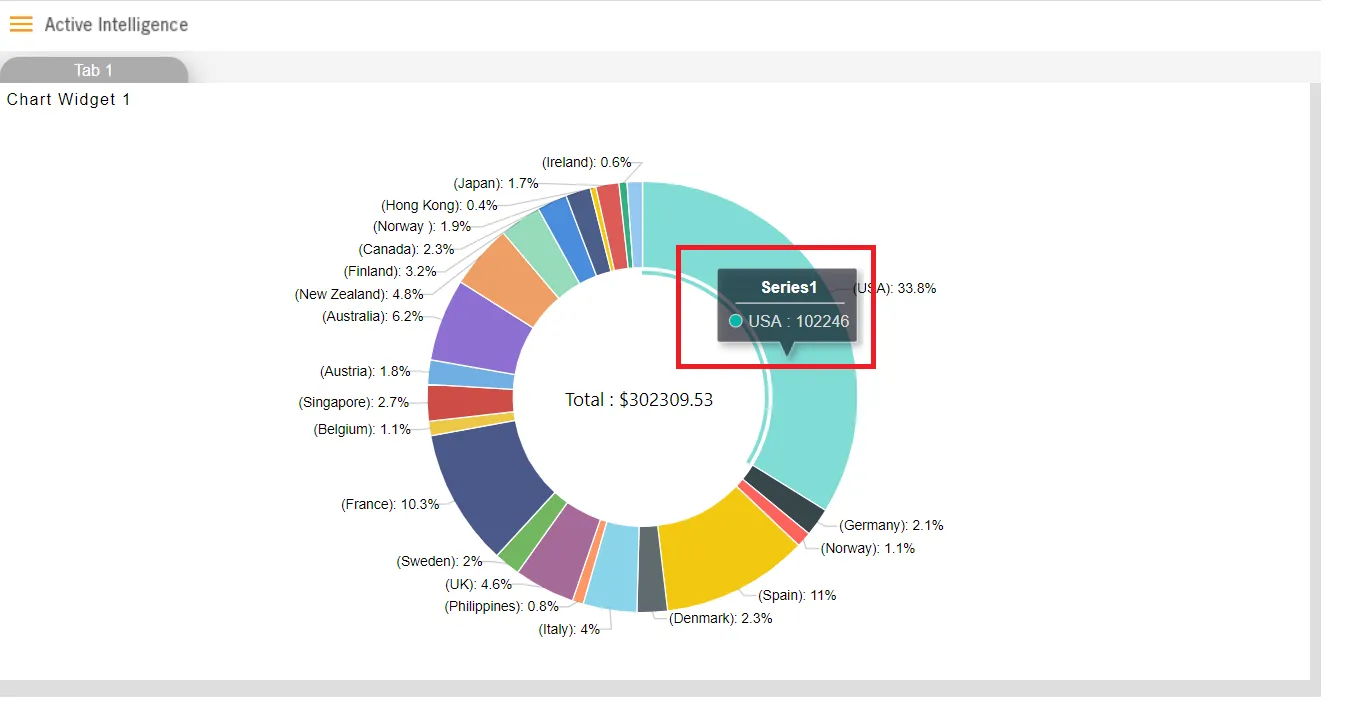
Before this setting is applied, the chart widget tooltip has no decimal places in it as shown in below image:

-
The Value displayed in tooltip has decimal places and we are getting rounded values.
-
To Display Decimal places, go to dashboard edit mode
-
Edit Chart
-
Go to formatting
-
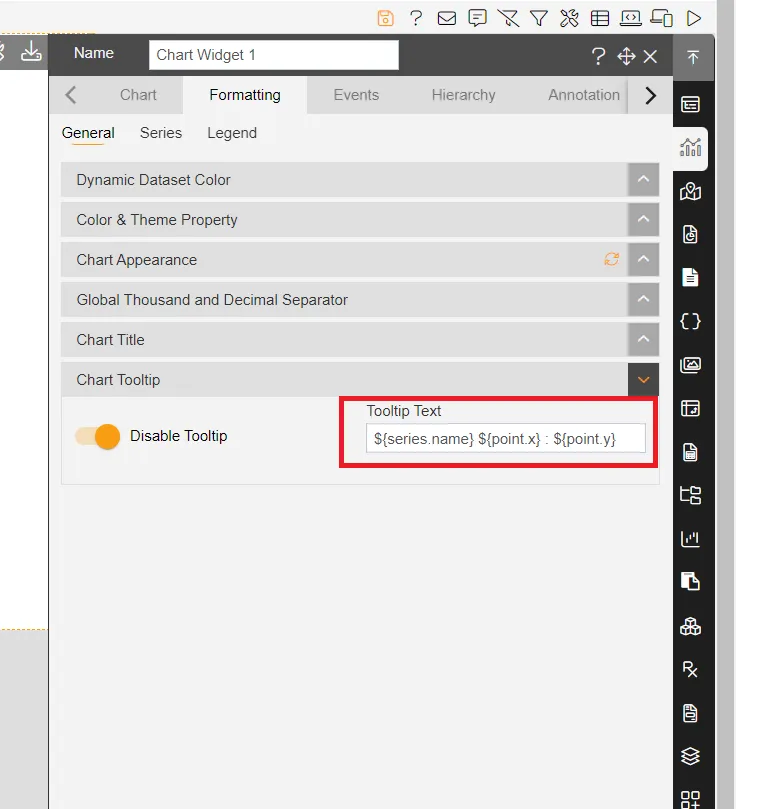
Open Chart tooltip option and you can see default expression is as below,

-
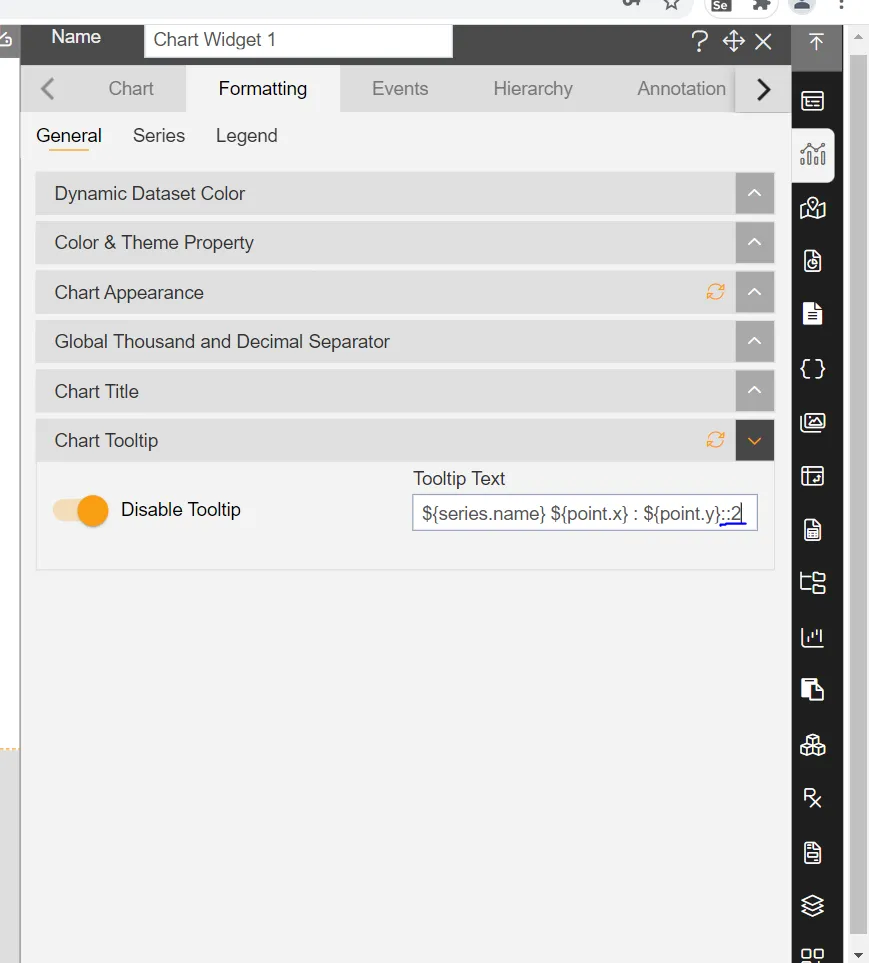
To add 2 decimal places in tooltip, write down ::2 at the right side of expression as shown in below image,

-
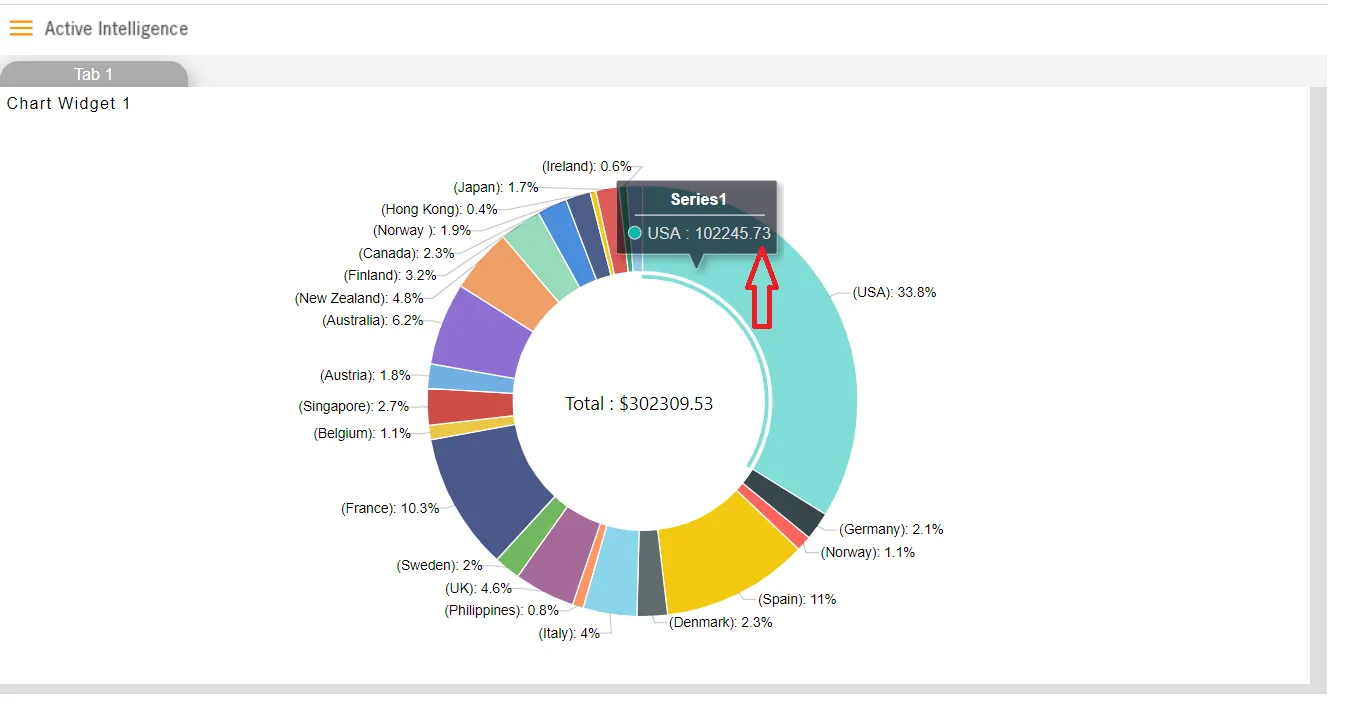
Go to preview mode and hover on slices of pie chart and you can see 2 decimal places in tooltip.

-
You can add N number of decimal places as per your requirement by modifying the tool tip expression.