Prediction in Dashboard
This document contains the information steps to get prediction data by applying the set of input data using the dataset. To get the prediction values against the dataset, one must have a prediction model ready which takes input and provide a response against each input value. Here in AIV, we send the data inputs using the dataset, add the prediction model name and another couple of values and you will get the prediction values from the model file directly in the dashboard widget.
Objective
To get Prediction Data
Use Case
In this document, we will demonstrate prediction functionality using Product purchase prediction. It is one of the prediction models we have on the server which provides the probability of a product being purchased by a person.
This example predicts the product purchase probability of a person based on input parameters like gender, age, estimated salary. This Example is based on the kNN Classification of Supervised Learning.
Prerequisite
Used kNN-1-Predict Product purchase based on social network Ad for this example.
Download dashboard.zip file from link given dashboard.zip.
After downloading the zip file, Open Prediction in Dashboard folder & upload kNN-1-Predict Product purchase based on social network Ad into Master Data -> Dataset section of AIV. To add it into AIV follow this link.
Steps to get Prediction Data
-
log in to AIV with valid credentials
-
Go to dashboard and create a new dashboard by following this link & give prediction demo name to it.
-
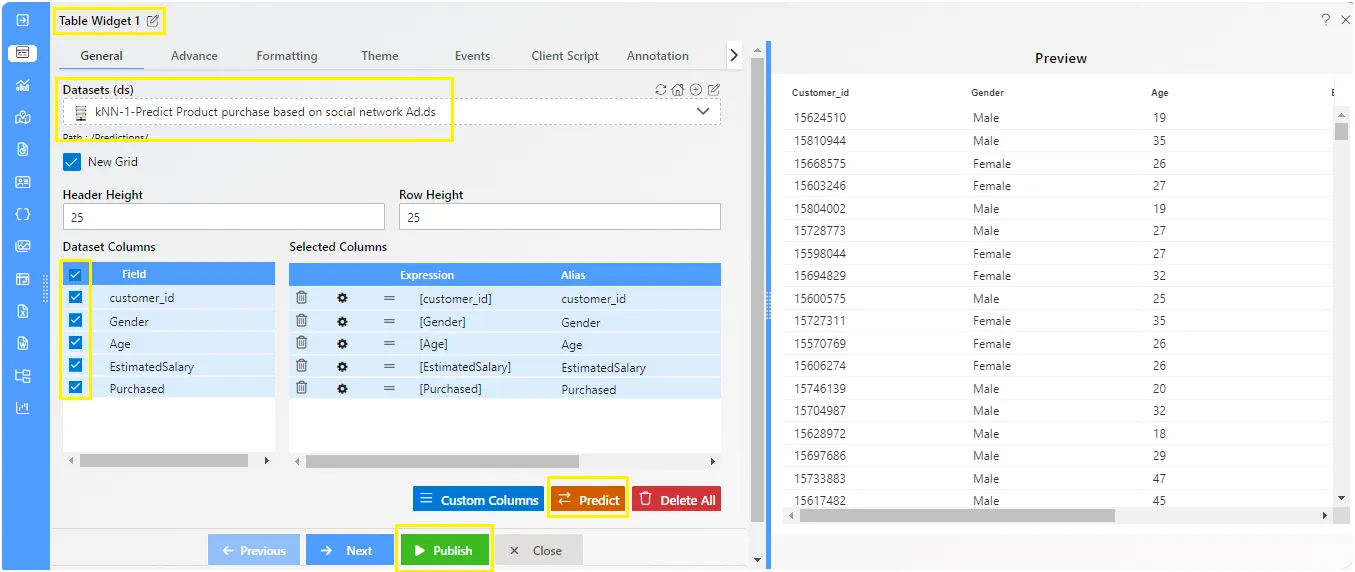
Add a table widget in the dashboard and select the dataset which has the input data for the prediction model. Note: Input data should be in a format that is supported by the prediction model. The list of columns should be the same as the prediction model supports.
-
For the Demo purpose, we have a dataset named “kNN-1-Predict Product purchase based on social network Ad”.
-
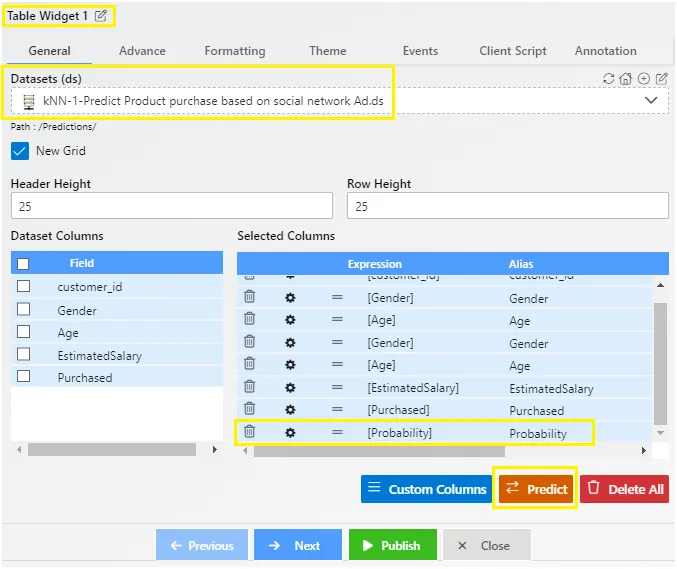
Select a relevant dataset from the dropdown and add all the columns in to table widget as shown in the below image.
-
Click on save and exit and resize the table widget at your convenience
-
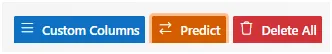
Click on the edit icon of the table widget to add prediction values and click on predict icon available just right of the custom column option as shown in the below image,
-
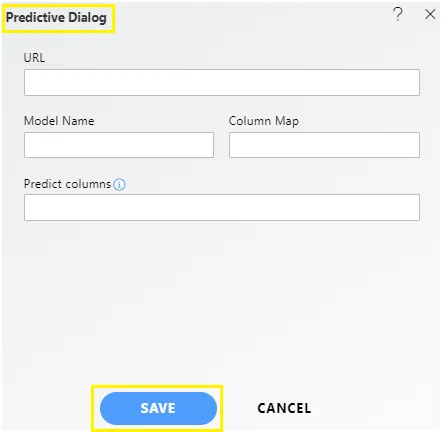
By clicking on predict option, a prediction dialog box will appear which ask for prediction details,
-
This dialog box asks 4 inputs:
-
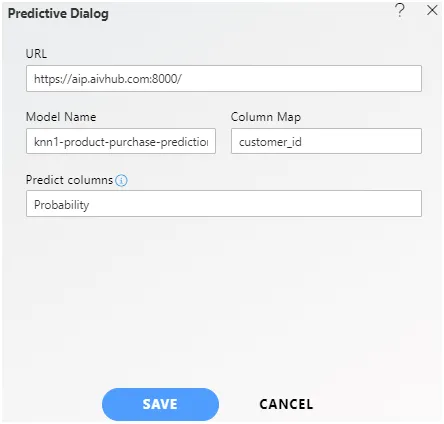
URL: provide server URL where your prediction models are available or hosted. The demo URL we are using here is “https://aip.aivhub.com:8000/”
-
Model Name: Model Name is the name of the prediction model you are using. Generally, the name is a unique identifier for the prediction model which we have to pass in the request. For this Demo, it would be
knn1-product-purchase-prediction. -
Column Map: give a name of unique value by which each row is identified, for example, serial number or customer number. In this Demo, it would be a customer ID
-
Predict columns: name of the column in which prediction model sends prediction value. In this Demo example, the prediction model provides a value in a column named “Probability”.
-
Fill in the required details as shown in the below image,
-
NOTE: column name should be the same as defined in the prediction model otherwise it will not get the column data. (For both column Map and Predict Columns)
-
Click on the save button to save the changes. After saving, again go to table edit view and scroll down to selected column list in the table and you can see a new column added named Prediction.
-
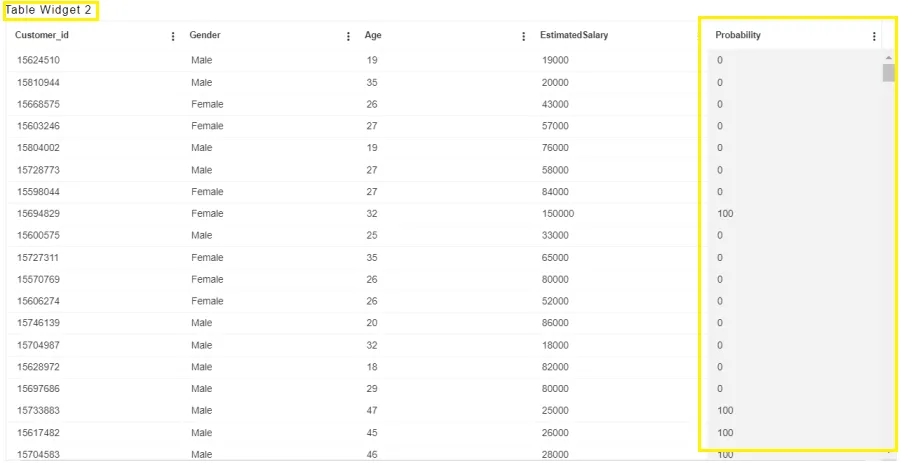
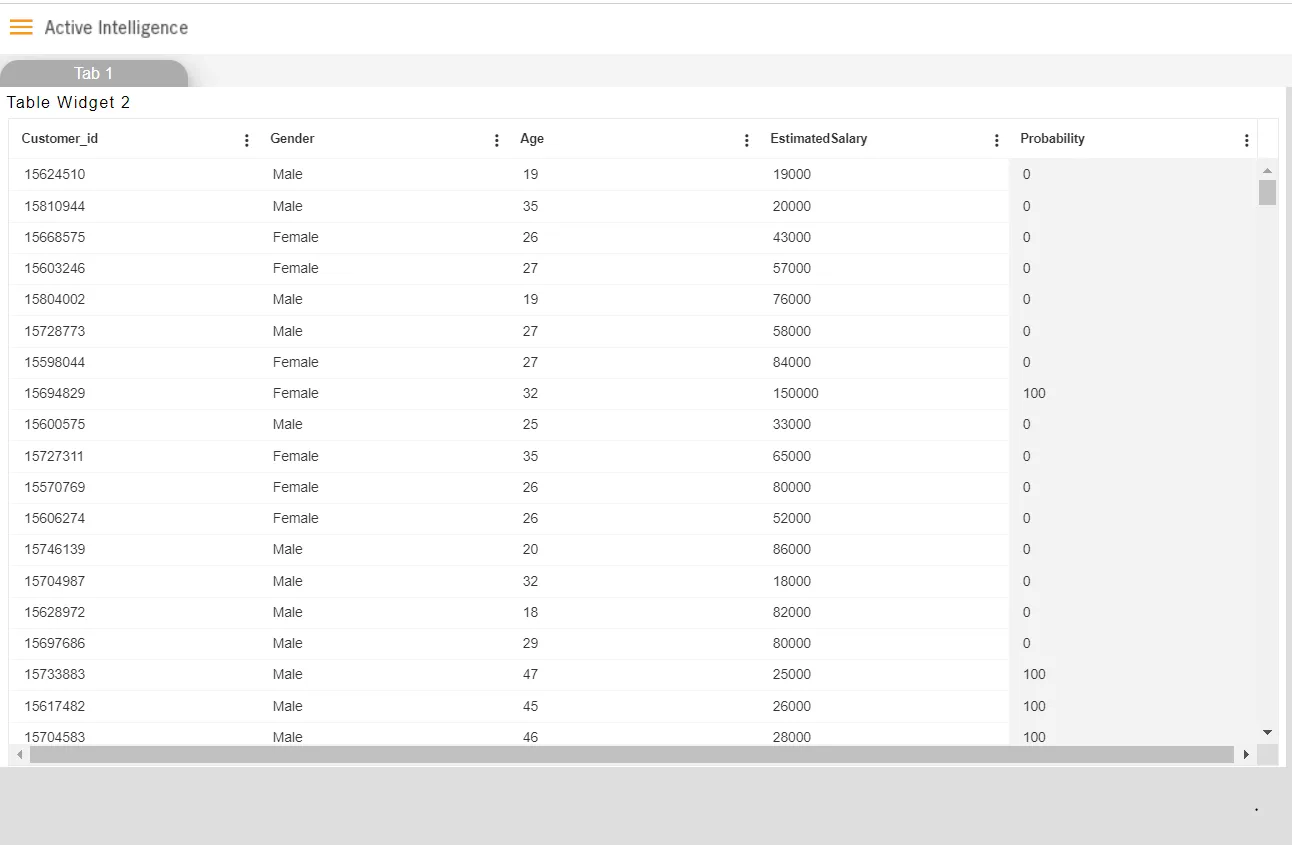
Click on save and exit and go to dashboard preview. Check this prediction column against each customer ID and you will see prediction value against each customer ID based on various input values like Gender, Age, and estimated salary.
-
Please note here, the prediction value is completely based on a prediction model, here it is showing values as 0 or 100 where 0 represents no probability and 100 represents the possibility that the customer will purchase the product.
-
Further users can use the custom column to represent this value with icons and images to make it more visually attractive.
Common features:
Audit
Clone
Copy
Move
Upload
Delete
Share
Version
Download
Property
Save as quicklink