General
Introduction
The General Properties section allows you to configure the fundamental display and behavior settings for your chart visualization. These options control aspects such as stacking, sorting, color schemes, and localization. By adjusting these properties, you gain high-level control over how data is presented and how the chart appears.
Purpose
To customize the overall presentation, data organization, and aesthetic elements of the chart.
General Properties
Click to view General Properties
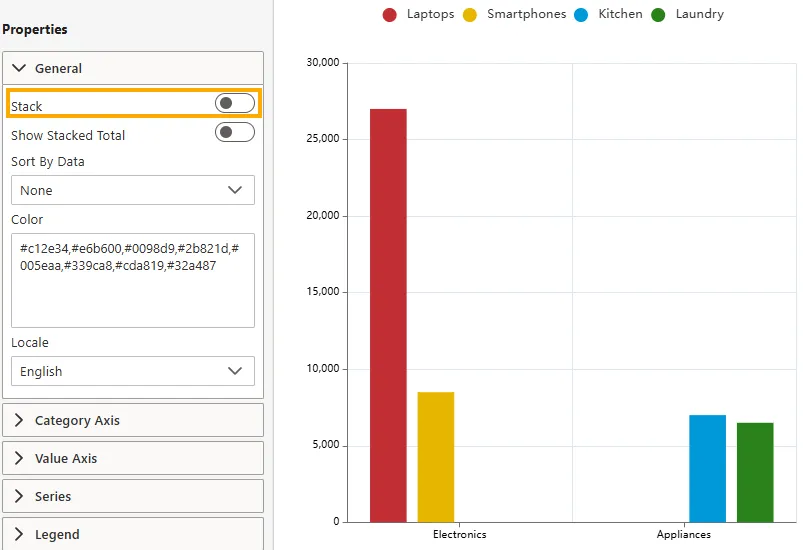
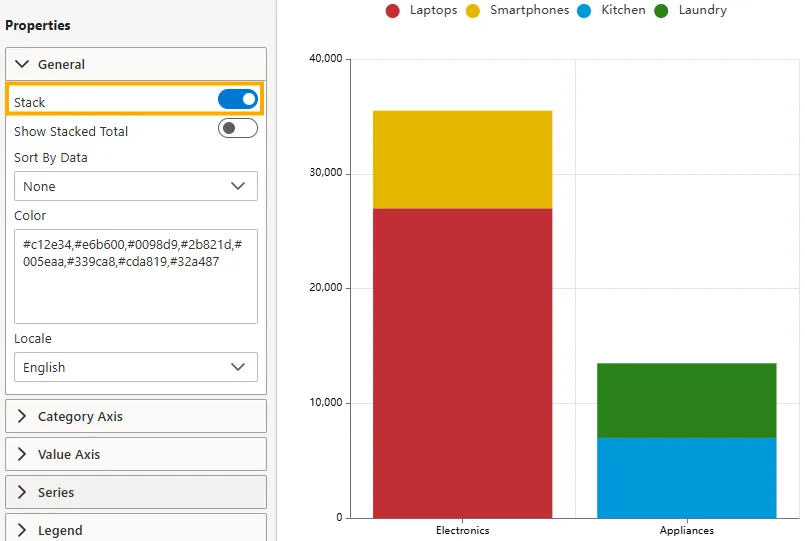
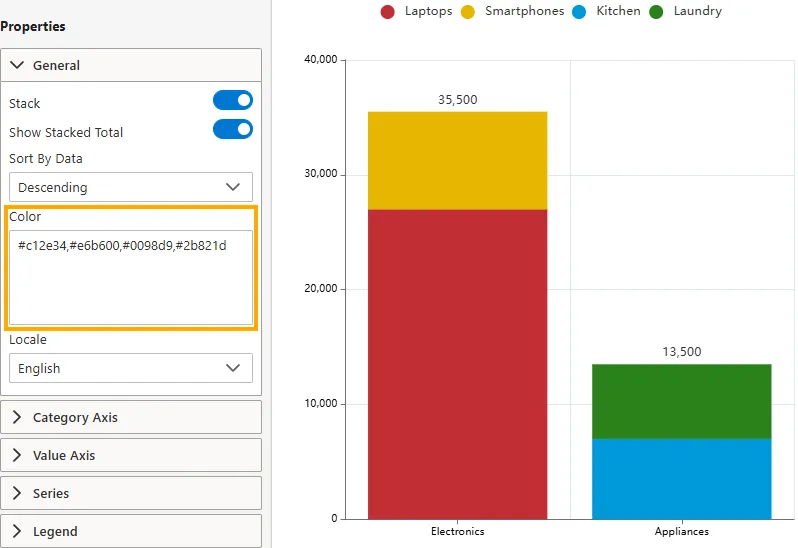
Stack
Controls whether data series are displayed as stacked segments within each category.
-
Disabled -> Series are shown side-by-side or overlapping, depending on the chart type.
-
Enabled -> Values from different series are added on top of each other, showing both the total contribution and individual component sizes.
-
Visibility: Toggle switch (On/Off).
-
Impact: Essential for visualizing parts-to-whole relationships.
-
Example: Enabled stacking shows combined bars for Electronics and Appliances.
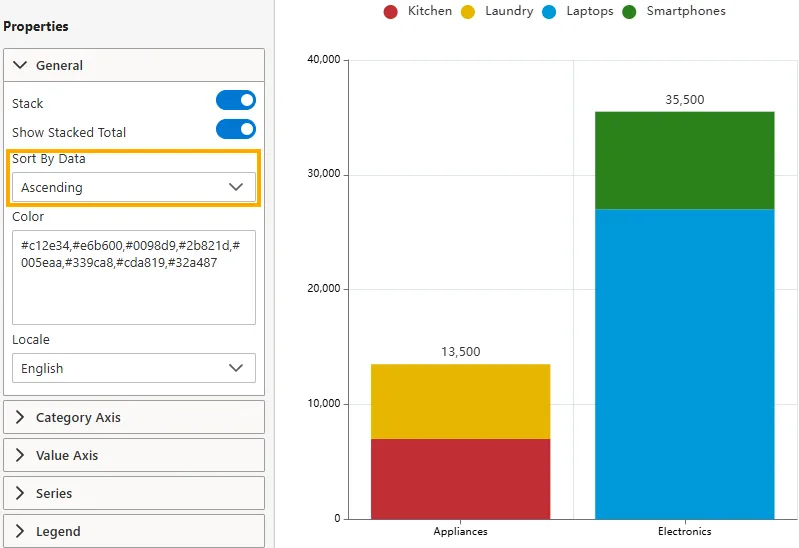
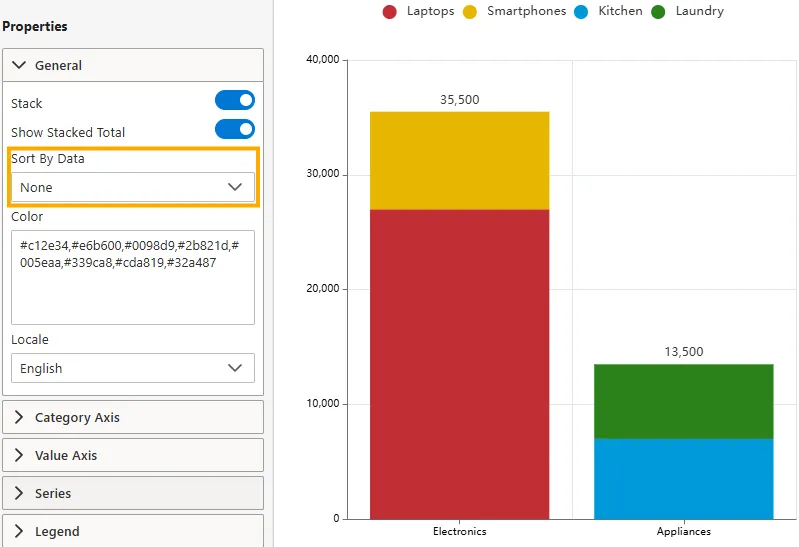
Show Stacked Total
Available only when Stack is enabled. Displays the total sum of stacked segments as a label on top of each stacked bar.

- Visibility: Toggle switch (On/Off).
- Impact: Improves readability by clearly showing aggregate values for stacked data.
- Example: Shows totals such as 35,500 for Electronics and 13,500 for Appliances.
Sort By Data
Defines the sorting order for categories or series based on their data values.
-
Ascending -> Smallest to largest value.
-
Descending -> Largest to smallest value.

-
None -> No specific sorting applied.
-
Impact: Helps quickly identify the highest or lowest performing categories/series.
-
Example: In descending order, Electronics (35,500) appears before Appliances (13,500).
-
Color
Defines the color palette for chart series or segments. Colors are typically provided as comma-separated hex codes.
-
Input Type: Text area (comma-separated hex values).
-
Example:
- Laptops (Crimson Red, #c12e34)
- Smartphones (Golden Yellow, #e6b600)
- Kitchen (Bright Azure, #0098d9)
- Laundry (Forest Green, #2b821d)
-
Impact: Enables custom branding, ensures visual distinction, and supports accessibility standards.
-
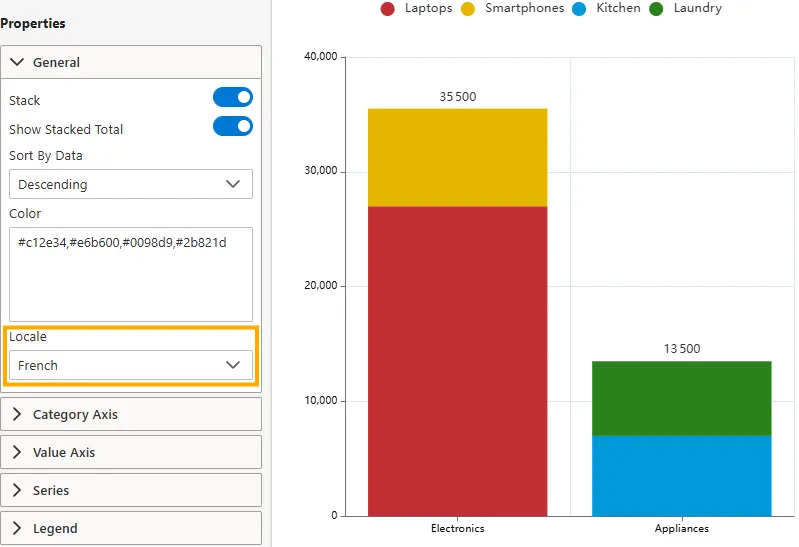
Locale
Sets the language and regional formatting conventions for chart elements such as:
-
Number formatting (decimal separators, thousands separators).
-
Date formatting.
-
Currency symbols.
-
Options: Multiple supported locales (e.g., English, Spanish, French, German, etc.).
-
Impact: Ensures that data is displayed in a culturally appropriate and easily understandable way for the intended audience.
-
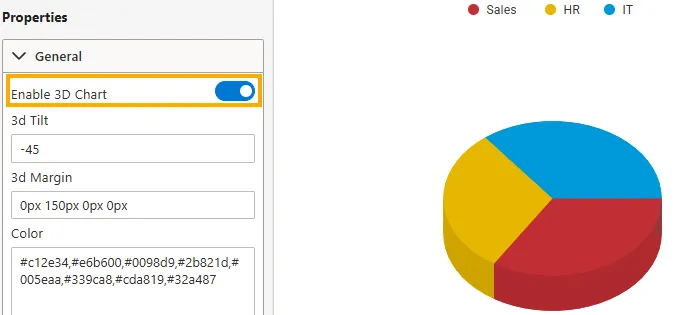
3D Chart
Enables 3D rendering.
-
Enable 3D -> Activates the 3D view, giving depth to slices. (Available only for Pie charts)
-
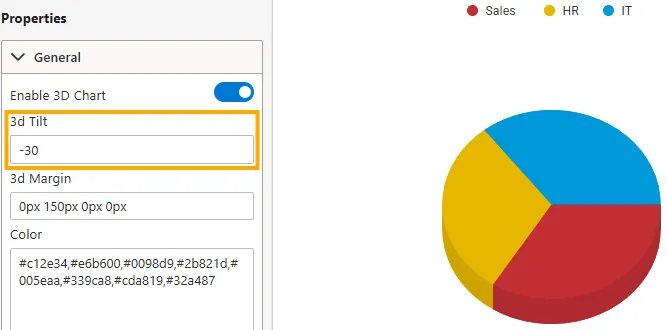
3D Tilt -> Adjusts the viewing angle of the chart for perspective. (Available only for Pie charts)
-
3D Margin -> Controls the spacing between the chart and its edges in 3D mode. (Available for Pie and Donut charts)
-
Impact: Adds visual depth and enhances presentation.
-
Example: A 3D tilted donut chart highlighting sales by region.
-
-
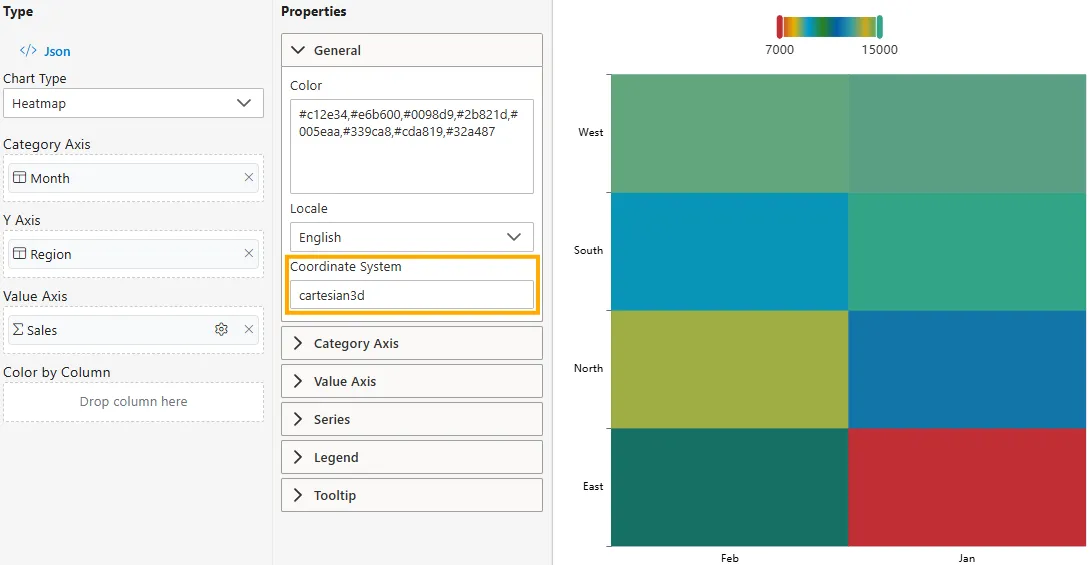
Coordinate System (Heatmap)
Defines how data is mapped to the Category Axis and Y Axis in two-dimensional space. (Available only for Heatmap charts)
-
Options: Cartesian2D (standard Category Axis and Y Axis grid).
-
Impact: Ensures proper row/column alignment where categories define the grid structure and values control the cell intensity.
-
Example:
-
Category Axis: Month
-
Y Axis: Region
-
Value Axis: Sales (controls the color intensity of each cell)
-
-
Summary
The General Properties section is a powerful way to refine both the look and feel of your chart and the clarity of data representation. By configuring stacking, totals, sorting, color, and locale, you can adapt your visualization to meet business needs, improve readability, and align with audience expectations.