Drill Down
Introduction
The Drill Down Widget in application lets you visually create and manage hierarchical structures from your dataset. This is especially useful when you need multi-level drilldowns in visualizations such as charts, pivot tables, or Vizs.
Purpose
To define a hierarchy of columns that can be used for drilldown interactions in visualizations.
Steps to create a Drill Down
-
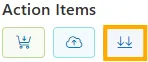
From the left vertical menu, select the Drill Down Widget icon.
-
A widget will be automatically added to the Viz canvas.
-
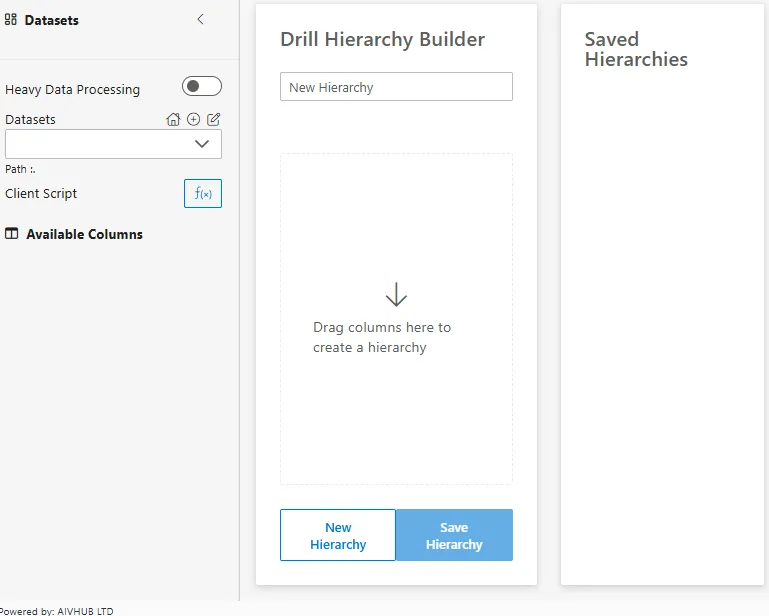
The Drill Hierarchy Builder panel appears on the left, and Saved Hierarchies panel on the right.
-
-
Select Dataset
-
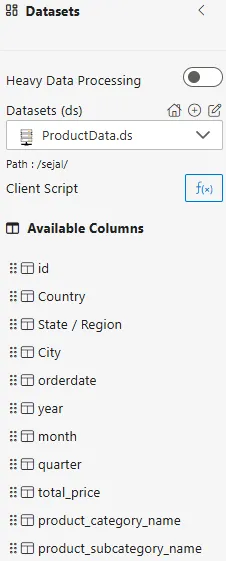
From the Datasets dropdown, choose your dataset(e.g.,
ProductData). -
Available columns will be displayed in the Available Columns panel.
-
-
Name the Hierarchy
-
In the
New Hierarchytextbox, enter a name for your hierarchy (e.g.,LocationHierarchyorProductLevels).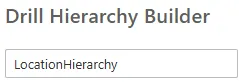
-
-
Drag & Drop Columns
-
Drag columns from the Available Columns panel into the Drill Hierarchy Builder.
-
Drop them in top-to-bottom order to define the hierarchy (e.g.,
Country -> State -> City).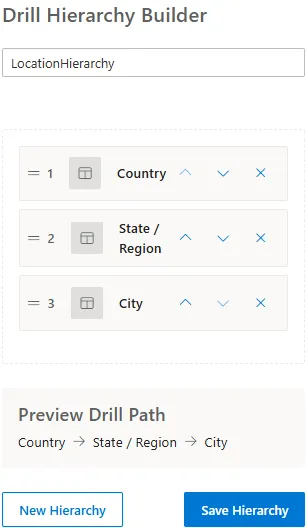
-
-
Save the Hierarchy
-
Click the Save Hierarchy button to save the structure.
-
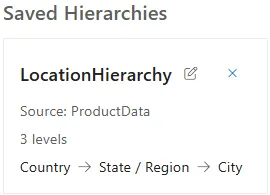
Your saved hierarchy will appear under the Saved Hierarchies panel.
-
To edit a hierarchy later, click the Edit icon and update it.
-
Use Cases
Defining hierarchies is fundamental for interactive data exploration. It allows users to start with a high-level overview and progressively uncover more granular details.
| Use Case | Hierarchy Example | Business Question it Answers |
|---|---|---|
| Geographical Analysis | Region → Country → State → City | Compare sales performance across different regions, and then drill down to identify the top-performing cities within the best country. |
| Temporal (Time-Based) Analysis | Year → Quarter → Month → Week | What were our total sales in 2023? Let’s drill down to see the quarterly trend and pinpoint the best-performing month. |
| Product Category Breakdown | Category → Sub-Category → Product Name | How is the ‘Electronics’ category performing? Drill down to see which sub-category (e.g., ‘Laptops’ vs. ‘Smartphones’) is driving growth. |
| Organizational Performance | Division → Department → Sales Manager | Which division met its sales target? Drill down to see which department and then which specific manager contributed the most. |
| Financial Reporting | Account Type → Account Group → Ledger Account | What are our total operating expenses? Drill down to see the breakdown by group (e.g., ‘Personnel’, ‘Marketing’) and then to individual ledger accounts. |
Example Scenario: Building Hierarchies for a Sales Dashboard
Objective
An analyst needs to build an interactive sales dashboard. They want to allow users to explore sales data by product category and by time period. To achieve this, they will create two separate hierarchies: ProductHierarchy and TimeHierarchy.
Sample Dataset (SaleData)
| OrderDate | Year | Quarter | Month | ProductCategory | ProductSubCategory | Sales |
|---|---|---|---|---|---|---|
| 2023-01-15 | 2023 | Q1 | Jan | Electronics | Laptops | 12000 |
| 2023-02-20 | 2023 | Q1 | Feb | Electronics | Smartphones | 8500 |
| 2023-04-10 | 2023 | Q2 | Apr | Appliances | Kitchen | 7000 |
| 2023-05-25 | 2023 | Q2 | May | Electronics | Laptops | 15000 |
| 2023-08-05 | 2023 | Q3 | Aug | Appliances | Laundry | 6500 |
Steps
This scenario involves creating two distinct hierarchies using the same widget.
Part 1: Creating the ProductHierarchy
-
Add the Widget and Select Data
-
Add the Drill Down Widget to the canvas.
-
Select the
SaleData.dsdataset from the dropdown.
-
-
Define the First Hierarchy
-
In the
New Hierarchytextbox, typeProductHierarchy. -
From the Available Columns, drag
ProductCategoryinto the Drill Hierarchy Builder. -
Next, drag
ProductSubCategoryand drop it belowProductCategory.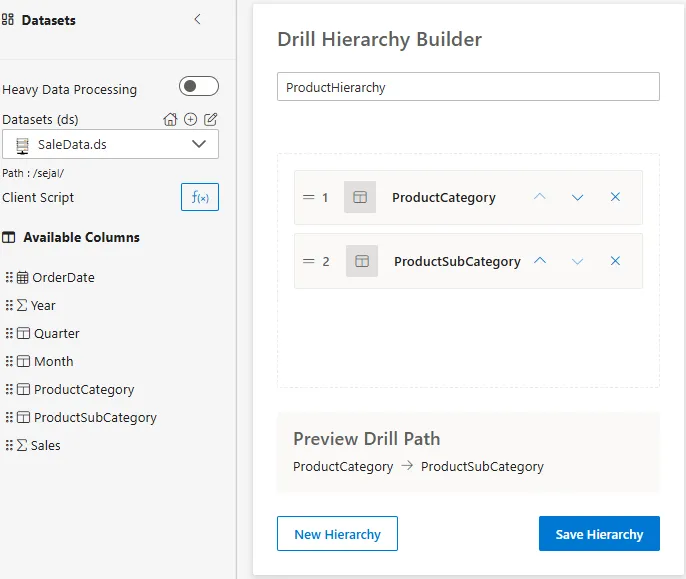
-
-
Save the Hierarchy
-
Click the Save Hierarchy button.
-
ProductHierarchywill now appear in the Saved Hierarchies panel on the right.
-
Part 2: Creating the TimeHierarchy
-
Define the Second Hierarchy
-
Click on the
New Hierarchybutton and typeTimeHierarchyin theNew Hierachytextbox. -
Drag
Yearinto the builder. -
Drag
Quarterand drop it belowYear. -
Drag
Monthand drop it belowQuarter.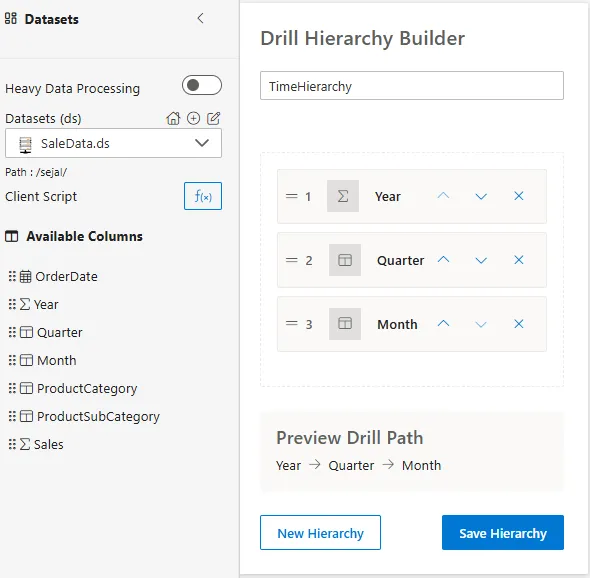
-
-
Save the Hierarchy
-
Click the Save Hierarchy button.
-
TimeHierarchywill now also appear in the Saved Hierarchies panel.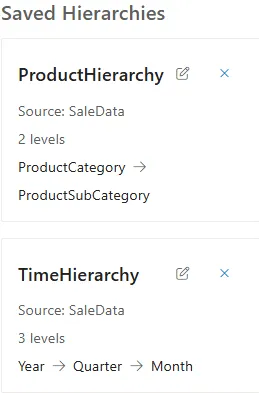
-
You have now successfully created two reusable hierarchies. The real power comes when you use them in another widget.
How to Use It
-
You would add a Chart Widget to the canvas.
-
Select your dataset from the Datasets dropdown (e.g.,
SalesData.ds). -
In the Chart Widget’s configuration, you would drag the saved
ProductHierarchyfrom the Drill Down Items list and drop it onto the Category Axis field. -
You would drag the
Salescolumn to the Value Axis.
The Interactive Result:
-
Initial View (Level 1): The chart will display two bars: one for “Electronics” and one for “Appliances”, showing the total sales for each top-level category.
-
Drill Down (Level 2): If a user clicks on the “Electronics” bar, the chart will automatically update. It will now display bars for “Laptops” and “Smartphones”, showing the sales breakdown within the Electronics category.
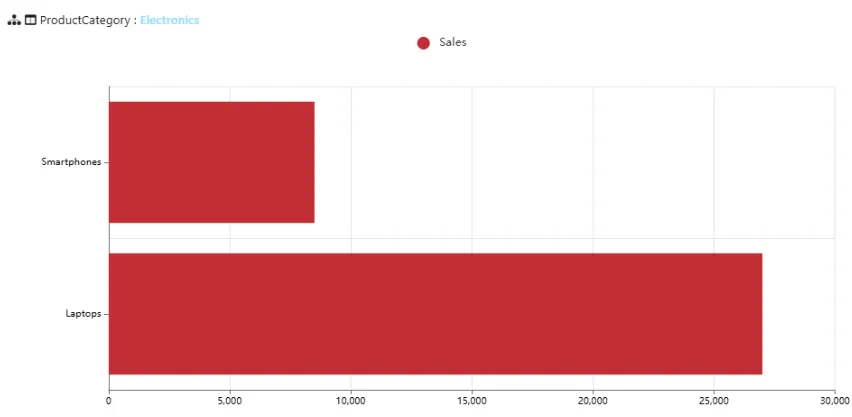
This drill-down capability, powered by the hierarchy you defined, allows for a rich, exploratory user experience without cluttering the initial view.
Summary
The Drill Down Widget provides a user-friendly way to define nested drilldown paths within your data visualizations. Whether for sales data, geographic data, or organizational structures, this tool simplifies hierarchical configuration without needing code.