Dynamic View Filter
Introduction
The Dynamic View Filter feature allows you to create interactive cross-widget filters inside your dashboard.
When a user selects an item in one widget (e.g., a Table Widget), it automatically filters the data shown in another widget (e.g., a Chart Widget).
This capability enables seamless drill-through analysis across multiple widgets.
Purpose
To dynamically filter a target widget based on the selection made in a source widget, without manually applying filters.
Example Use Case:
Clicking on Laptops in a table will instantly update the chart to show only sales data for the Laptops subcategory.
Steps to Configure a Dynamic View Filter
-
Create the Source Widget (Table)
-
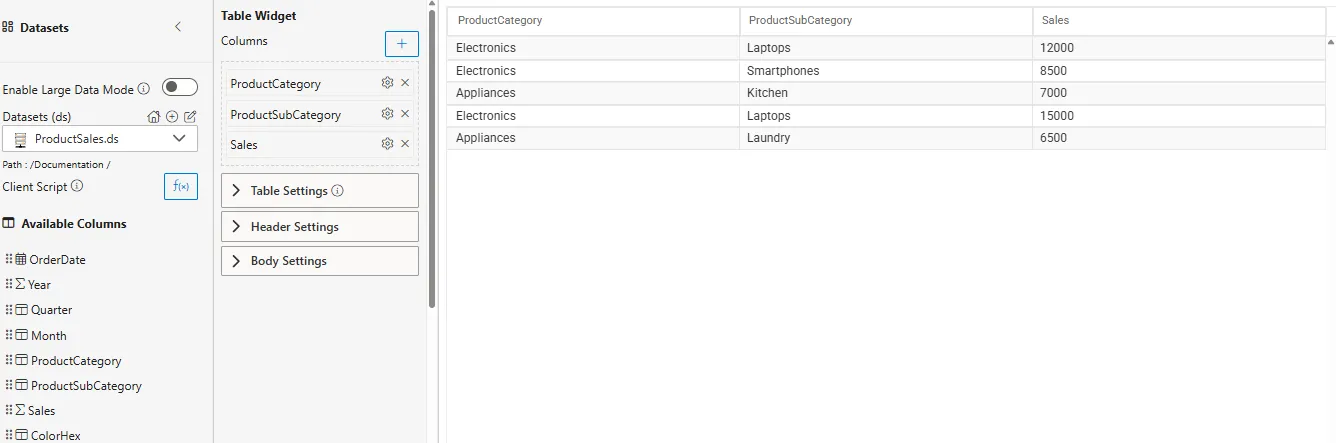
Add a Table Widget on your canvas.
-
This widget should contain the filterable column (e.g.,
ProductCategory,ProductSubCategory,Sales). -
Click here to learn how to create a Table Widget
-
-
Create the Target Widget (Chart)
-
Add a Chart Widget (e.g., Column/Bar Chart) on your canvas.
-
Configure it to use the same dataset (e.g.,
ProductCategory,ProductSubCategory,Sales). -
Click here to learn how to create a Column/Bar Chart

-
-
Open Dynamic View Filter Settings
-
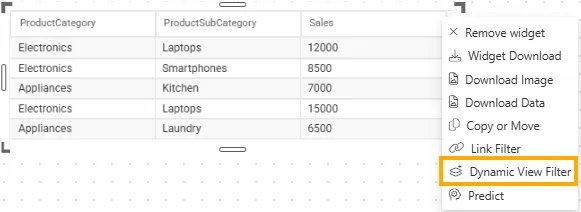
Hover over the Table Widget on your canvas.

-
Click the
 icon on the widget toolbar.
 -
From the list, select Dynamic View Filter.
-
The Dynamic View Filter panel will open.

-
-
Select the Filter Column
-
Click on Add Dynamic View Filter in the panel.
-
Enter a filter name (e.g.,
Product Category) and click Next.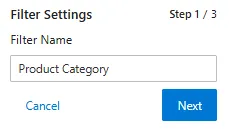
-
Again click Next to continue.

-
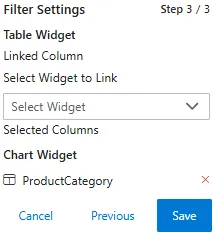
From the Select Widget dropdown, choose the target widget (e.g., Chart Widget).

-
From the Select Column dropdown, select the column you want to apply as a filter (all dataset columns will be listed, e.g.,
ProductCategory).
-
Click the
 icon next to the dropdown to add the filter.
 -
Click Save. Once saved, the Chart Widget will be hidden until you apply a filter.
-
-
Apply the Filter
-
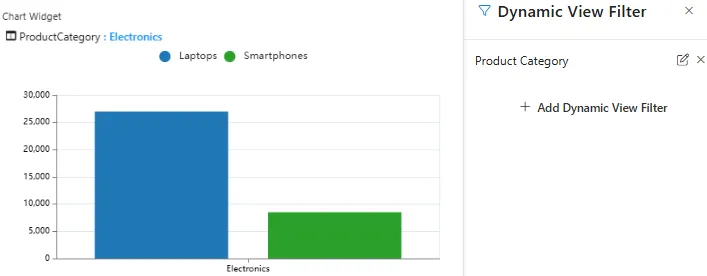
When you click on a value in the Product Category column (e.g., Electronics), the linked Chart Widget will automatically update. The chart will display only the filtered details. For example, selecting Electronics will show its sub-categories such as Laptops and Smartphones.
-
-
Go Back to All Data
-
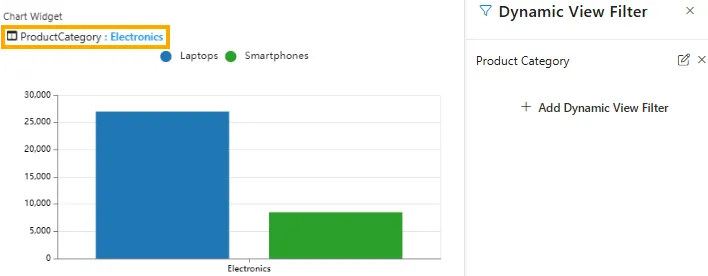
To return to the full dataset, click on the applied filter label (e.g., ProductCategory : Electronics).
-
To edit the filter, click on the
 icon.
icon. -
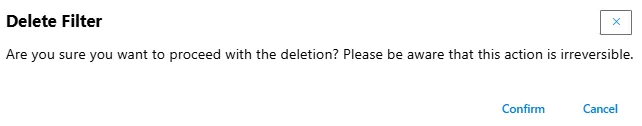
To remove the dynamic view filter, click on the
 icon. A confirmation popup will appear:
-
Click Confirm to delete.
-
Click Cancel to keep the filter.
-
-
Summary
The Dynamic View Filter adds powerful inter-widget interactions to your dashboards. It enhances the user experience by making data exploration more intuitive and context-driven. With just one click, users can drill down into the exact slice of data they need—without relying on separate filter controls.