Map Widget
Introduction
The Map Widget allows you to create interactive geographic maps using Leaflet.
Your dataset must include latitude and longitude values.
Currently, you can build cluster maps, with support for region-based visualizations planned in future updates.
Purpose
This widget is designed to plot data points on a map for geographical insights.
It enables you to:
- Visualize dataset records as markers on maps.
- Cluster markers for readability in dense regions.
- Add popups and tooltips with contextual details.
- Apply styling, sizing, and colors dynamically based on dataset values.
- Control map zoom, bounds, and tile providers.
Steps to Add a Map Widget
-
From the left-side widget panel, click the Map Widget icon.
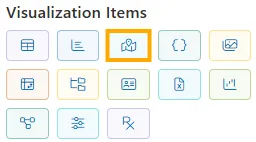
-
A new block labeled Map Widget will appear on your canvas.
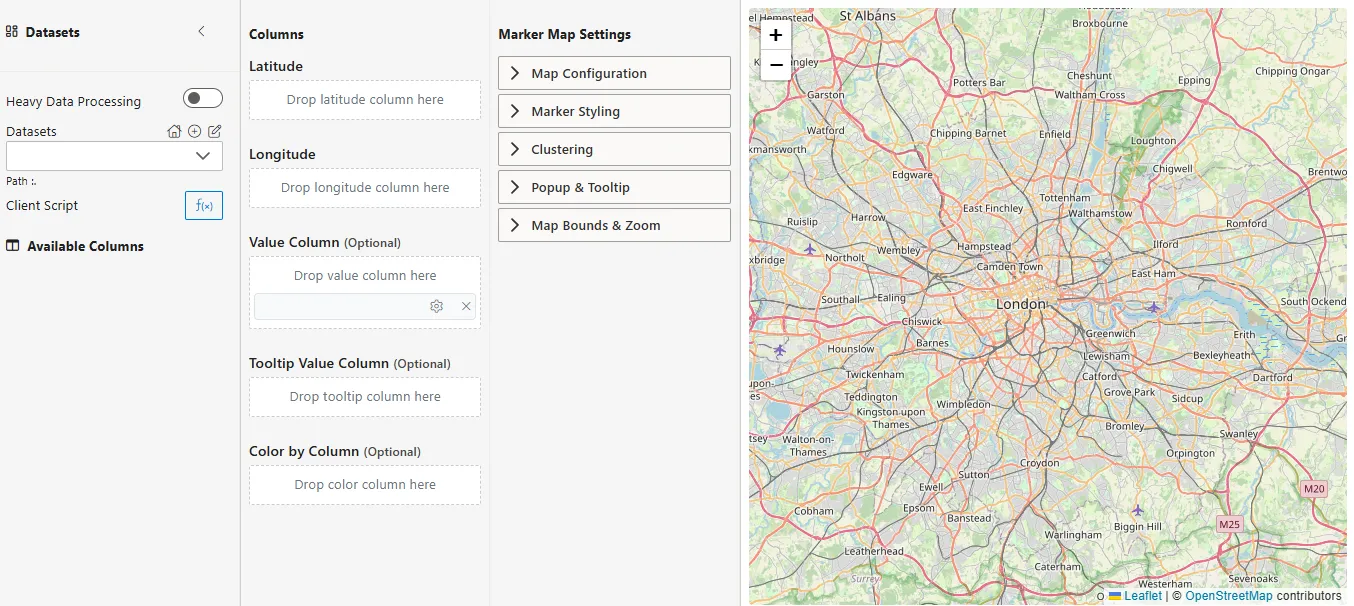
1. Datasets & Columns
Configure how your dataset connects to the map:
| Setting | Description | Example Value |
|---|---|---|
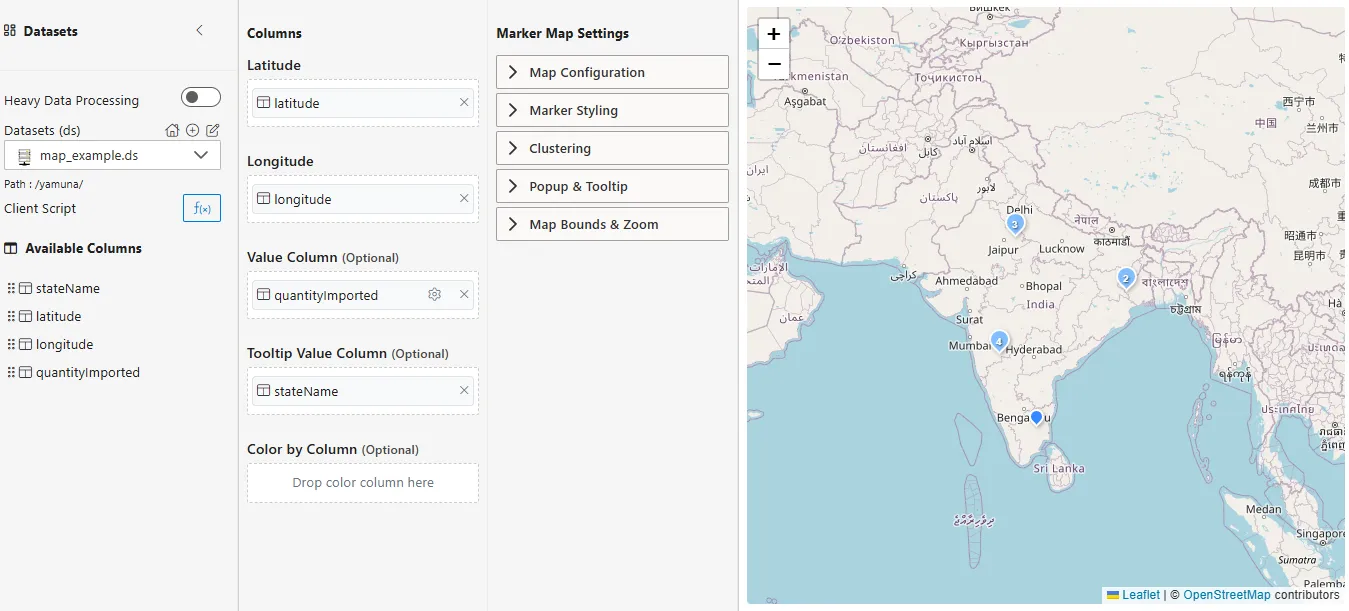
| Datasets Selector | Choose the dataset providing marker data. | map_example.ds |
| Path | Location of dataset file. | / |
| Available Columns | Lists all dataset columns. Drag-and-drop into mapping fields. | stateName, latitude, longitude, quantityImported |
| Latitude (Required) | Column with latitude values. | Latitude |
| Longitude (Required) | Column with longitude values. | Longitude |
| Value Column (Optional) | Numerical column for dynamic marker size or popups. | quantityImported |
| Tooltip Column (Optional) | Column explicitly shown in tooltip. | stateName |
| Color by Column (Optional) | Column for marker coloring. |
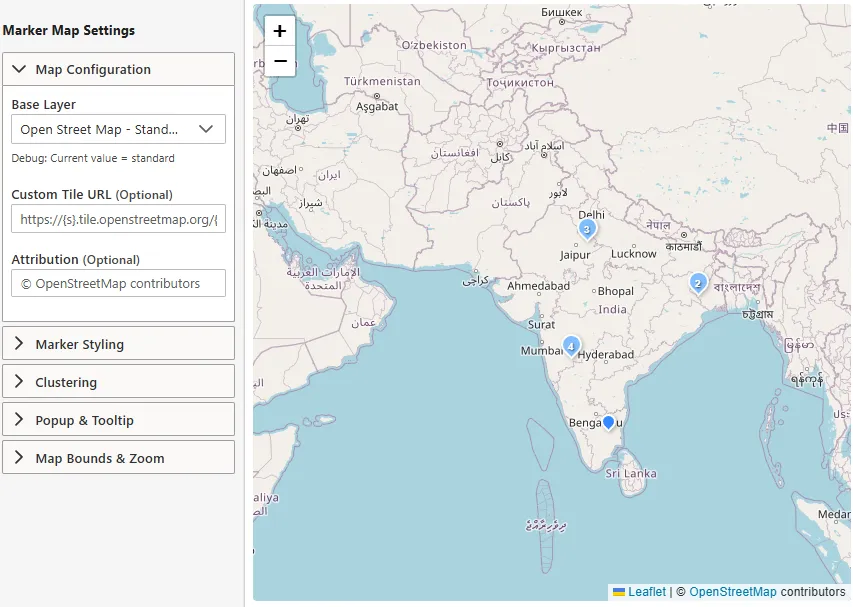
2. Map Configuration
| Setting | Description | Example Value |
|---|---|---|
| Base Layer | Map style/provider. | Open Street Map - Standard |
| Custom Tile URL | Use a different tile source. | https://{s}.tile.openstreetmap.org/ |
| Attribution | Credit to data provider. | © OpenStreetMap contributors |
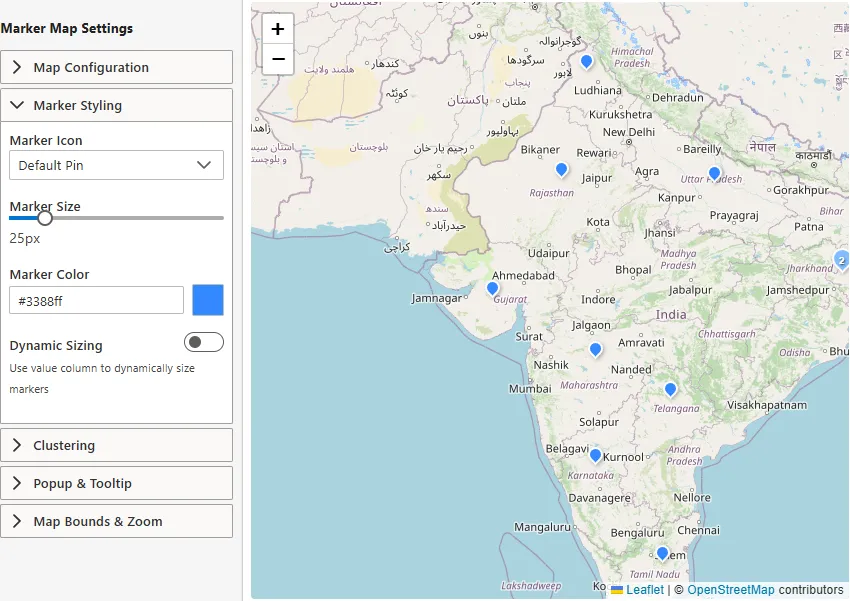
3. Marker Styling
| Setting | Description | Example Value |
|---|---|---|
| Marker Icon | Select marker icon style. | Default Pin |
| Marker Size | Size of the marker on the map. | 25px |
| Marker Color | Color used to display markers. | #3388ff |
| Dynamic Sizing | Resize markers based on Value Column. | Toggle On/Off |
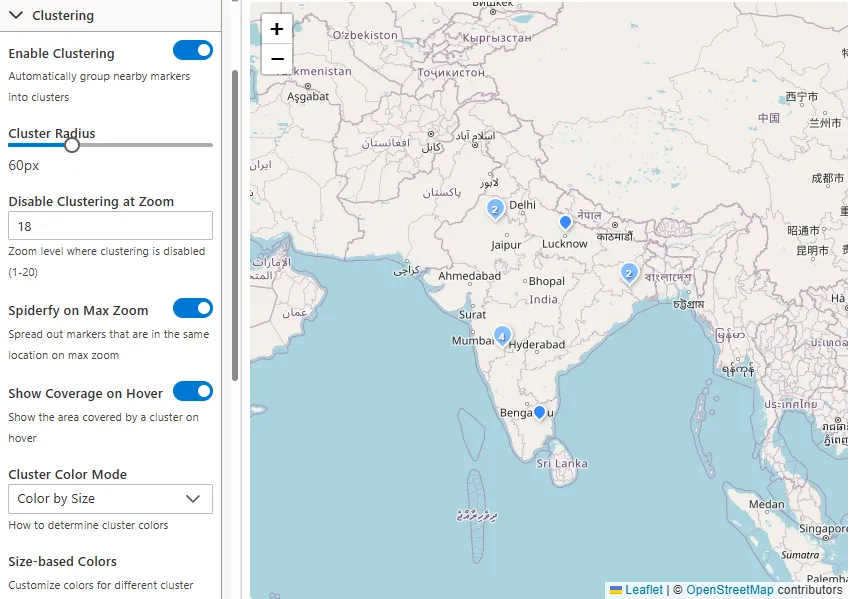
4. Clustering
| Setting | Description | Eample Value |
|---|---|---|
| Enable Clustering | Automatically group nearby markers into clusters. | On |
| Cluster Radius | Distance (in px) for grouping markers. | 80px |
| Disable Clustering at Zoom | Zoom level where clustering stops. | 18 |
| Spiderfy on Max Zoom | Spread overlapping markers at max zoom. | On |
| Show Coverage on Hover | Highlight cluster coverage area. | On |
| Cluster Color Mode | Determines cluster coloring. Options include: • Color by Size – color clusters based on marker count (Tiny, Small, Medium, Large, Huge). • Color by Value Range – color clusters based on data values (Very Low → Very High). • Single Color – all clusters use one chosen color. | Color by Size |
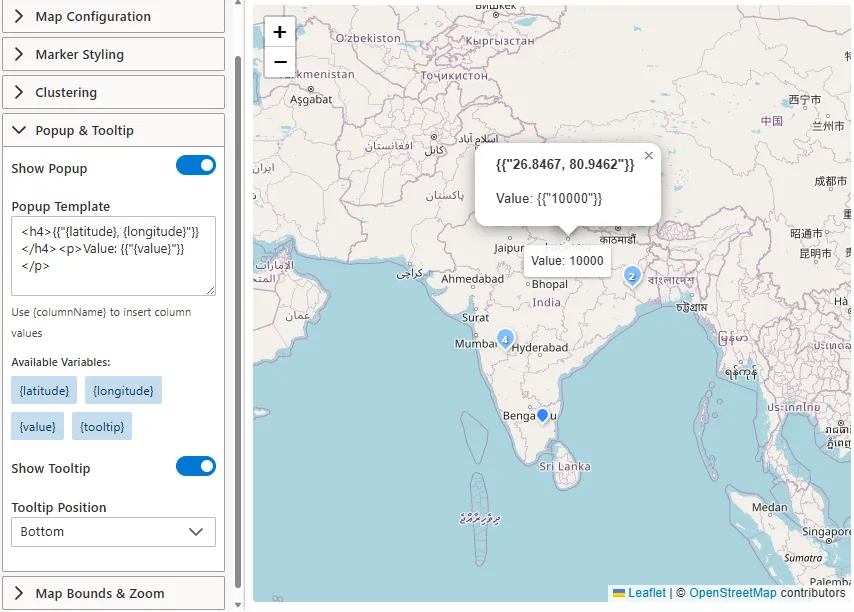
5.Popup & Tooltip
| Setting | Description | Example |
|---|---|---|
| Show Popup | Enable popups on click. | On |
| Popup Template | Define popup HTML. Use {columnName} syntax. | <h4>{latitude}, {longitude}</h4><p>Value: {value}</p> |
| Show Tooltip | Enable tooltips on hover. | On |
| Tooltip Position | Placement of tooltip. | Auto, Top, Bottom, Left, Right |
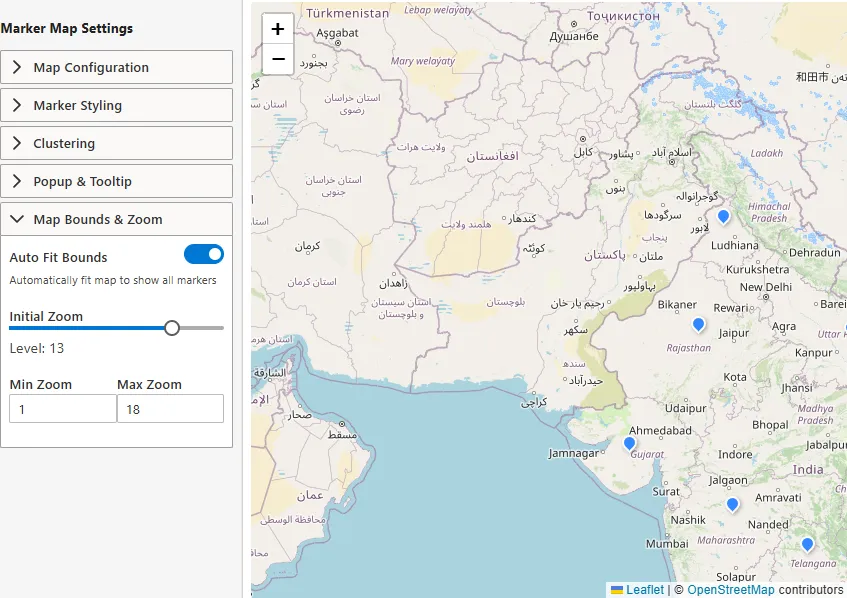
6. Map Bounds & Zoom
.| Setting | Description | Example Value |
|---|---|---|
| Auto Fit Bounds | Adjust map to fit all markers. | On |
| Initial Zoom | Default zoom level. | 10 |
| Min Zoom | Lowest zoom allowed. | 1 |
| Max Zoom | Highest zoom allowed. | 18 |