Market Place
Introduction
The Marketplace is a centralized hub for accessing ready-made widgets such as charts, tables, maps, KPIs, or custom visualizations created within the application and shared with other users. Widgets can be Free or Paid, enabling users to quickly enhance dashboards without building visualizations from scratch.
Uploading a New Widget in Marketplace
Any user can upload a widget, but admin approval is required before it becomes available in the Marketplace. To upload a widget:
-
Create the widget in the application, such as a chart, table, map, KPI, or custom visualization (e.g., a Column chart).
-
Download the widget file from the application by clicking
 and then selecting Download Widget.
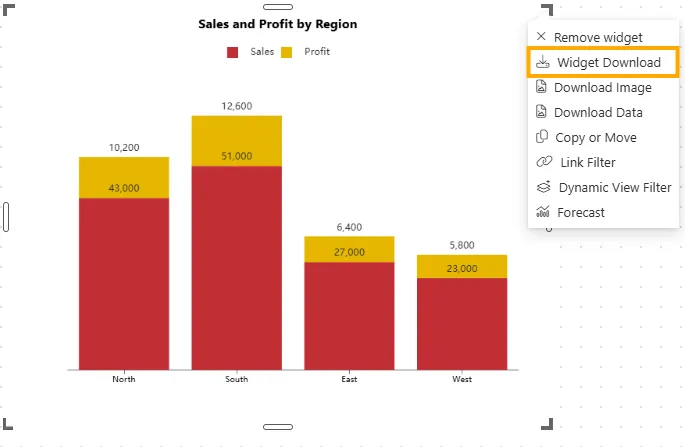
-
To upload your downloaded widget, go to the AIV Marketplace and log in.
-
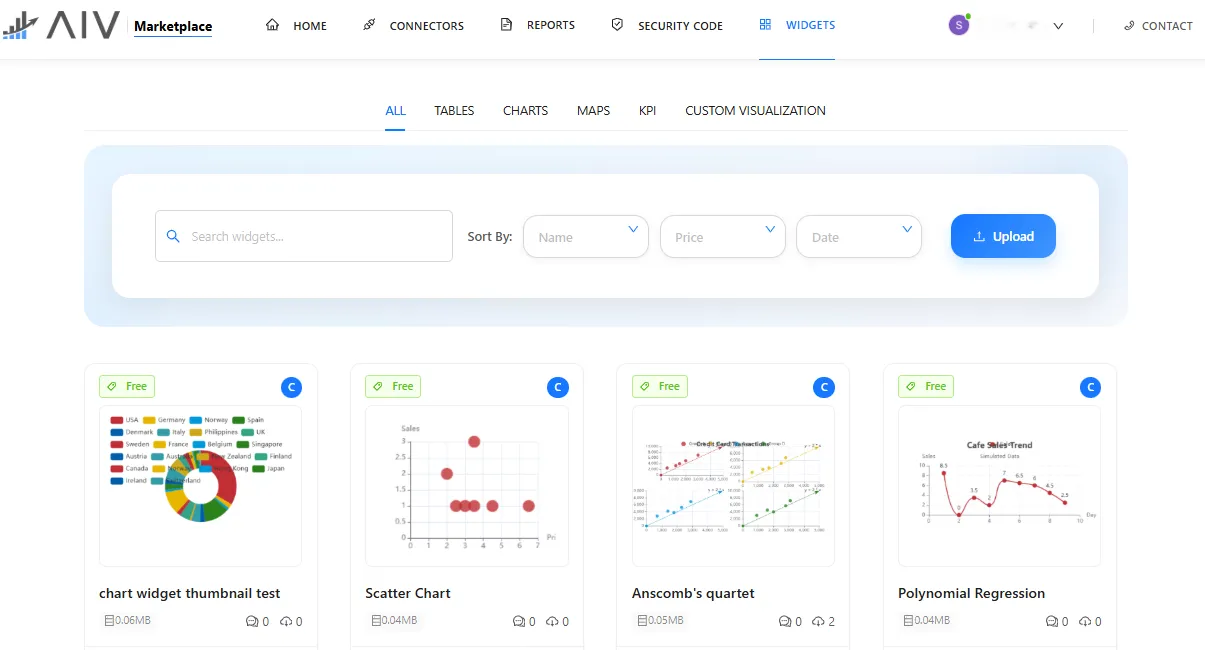
From the homepage, navigate to Widgets.
-
Use the search bar to find existing widgets if needed, and optionally sort by Name, Price, or Date.
-
Click the Upload button to start adding your widget. You will see the upload screen as shown below:
-
Fill in the widget details:
-
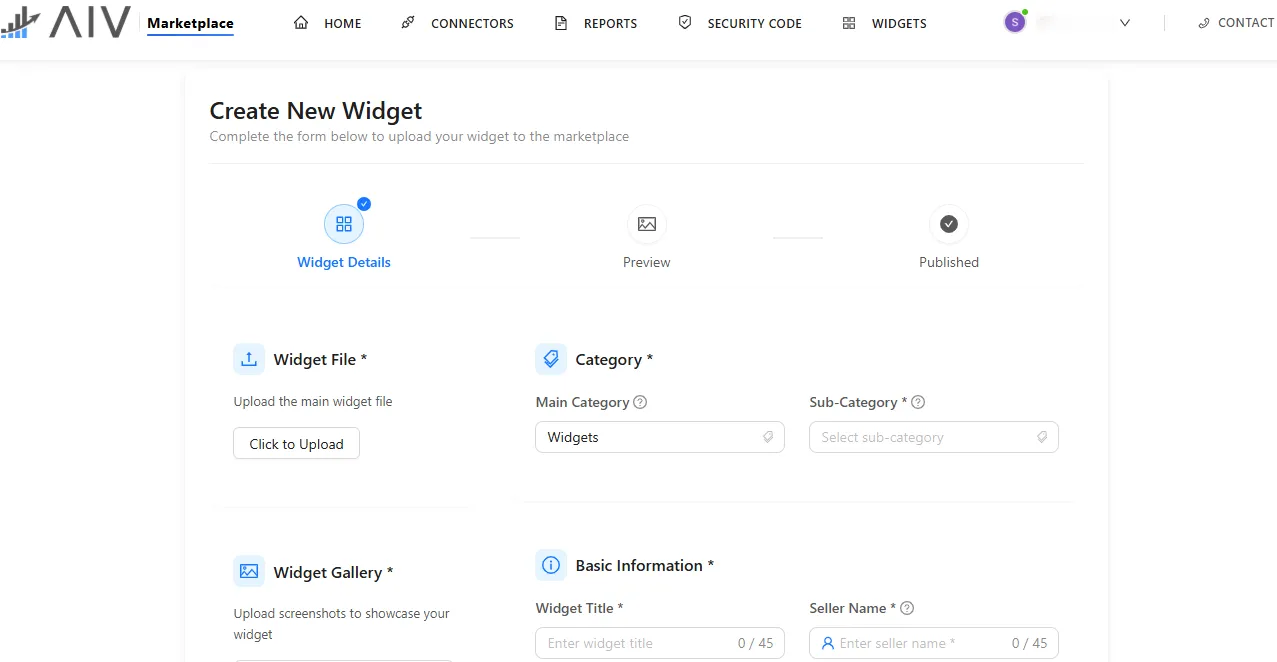
Widget File
-
Click Click to Upload and select the main widget file (
.widget) from your local system.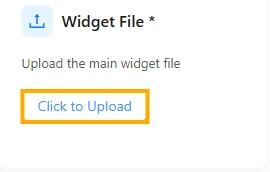
-
A popup message will appear confirming successful upload: “RegionalSalesProfit.widget uploaded successfully.”

-
-
Widget Gallery
-
The uploaded widget will appear here. You can also add multiple widget screenshots by clicking Upload Images.
-
-
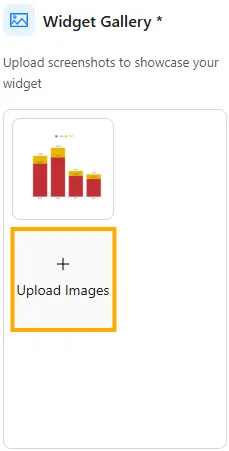
Category
-
Select the Main Category and Sub-Category for your widget from the available options.
Example: Main Category: Widgets, Sub-Category: Charts
-
-
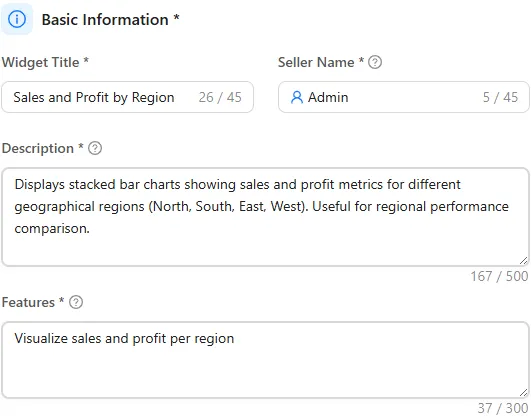
Basic Information
-
Widget Title: A short, descriptive, and clear title that allows users to immediately understand the widget’s purpose.
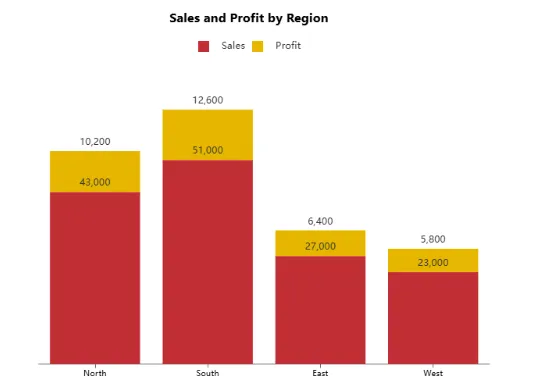
Example: Sales and Profit by Region
-
Seller Name: Indicates the creator or uploader of the widget.
Example: Admin
-
Description: Provide a detailed explanation of the widget’s purpose and use.
Example: Displays stacked bar charts showing sales and profit metrics for different geographical regions (North, South, East, West). Useful for regional performance comparison.
-
Features: List key features, one per line.
Example:
- Visualize sales and profit per region
- Stacked bar representation
- Data labels for easy reading
- Customizable color scheme
-
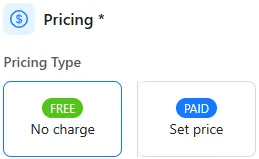
Pricing: Choose Free or Paid.
Example: Free
-
Additional Media: Optionally embed YouTube videos or other media demonstrating the widget.

-
-
-
Click on
 button to upload the widget.