Notebook Viewer Widget
Introduction
The Notebook Widget integrates machine learning or data science notebooks directly into your dashboard.
It enables execution of predictive models, selective cell display, and control over input/output visibility—making it useful for both technical and non-technical users.
Step-by-Step Guide
-
From the vertical menu, select the Notebook Widget and place it on the dashboard canvas.
-
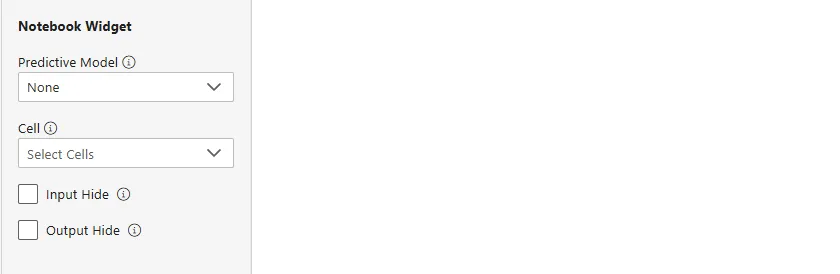
In the configuration panel, set:
-
Predictive Model → select a deployed model (e.g., forecasting, classification).
-
Cell → choose notebook cells to execute.
-
Input Hide → hide the notebook’s code input.
-
Output Hide → hide the result/output.
-
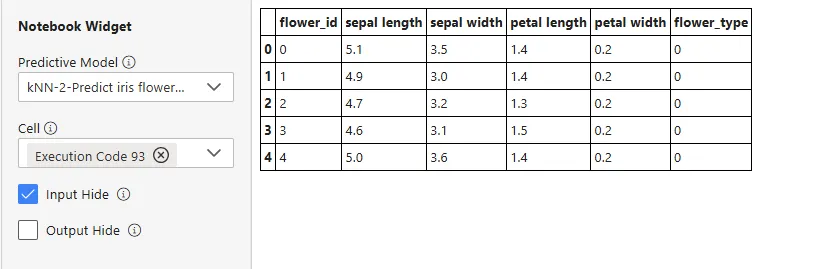
Example Scenario: Iris Flower Prediction
- Predictive Model:
kNN-2: Predict iris flower type - Notebook:
IrisPrediction.ipynbwith cells for loading data, running classification, and displaying predictions. - Configuration:
-
Predictive Model →
kNN-2: Predict iris flower type -
Cell →
Execution Code 93(classification + output table) -
Input Hide → checked
-
Output Hide → unchecked
-
Final User Experience
- The dashboard shows a clean results table with predicted flower types.
- The underlying Python code remains hidden.
Notes
- The selected cell must generate the intended output.
- Visibility toggles only affect what’s shown, not execution.
- All notebook executions are sandboxed and secure.
Summary
The Notebook Widget brings Jupyter-style analysis into dashboards by embedding model outputs directly for end users.
It supports predictive model integration while keeping technical logic hidden when needed, ensuring both usability and transparency.