Pivot Widget
Introduction
The Pivot Widget is a powerful component designed for multidimensional data analysis. It allows users to slice, dice, and summarize large datasets in an interactive pivot-table format, offering deep insights through grouping, aggregation, and custom formatting.
Overview
The Pivot Widget enables users to group data into rows and columns, apply calculations like sum or average, and customize the view with advanced layout and formatting options. It’s ideal for comparing metrics across categories and time periods.
Key Features
Data Configuration
- Drag & Drop Interface: Easily configure Rows, Columns, and Values using a simple interface
- Dynamic Grouping: Group data by any field (e.g., product line, region, time)
- Multiple Aggregation Types: Supports SUM, AVG, COUNT, DISTINCT COUNT, etc.
Value Formatting
- Decimal Places: Control the number of decimal digits displayed
- Column Width: Set custom column widths
- Value Prefix & Suffix: Add symbols like
$or%to values - Total Prefix & Suffix: Customize row and column total labels
Totals & Alignment
- Show Totals: Toggle display of row and column totals
- Prefix Row/Column Totals: Add labels like “Total” to summaries
- Column Alignment: Align values (Left, Center, Right)
Layout Options
- Compact Layout: Condensed structure to save space
- Tabular Layout: Traditional pivot layout with expanded headers
Sticky UI Elements
- Sticky First Column: Keeps first column fixed during horizontal scroll
- Sticky Header Rows: Keeps header rows fixed during vertical scroll
- Sticky Row Total: Keeps the row total visible when scrolling
- Collapse All Groups: Option to collapse all row groups by default
Layout Modes
Compact Layout
Collapses row headers into a nested format, saving horizontal space. Ideal for dashboards with limited space or when viewing on smaller screens.
Tabular Layout
Displays data in a flat, expanded format, where each group appears in a separate row. Useful for exporting and detailed data review.
How to Create a Pivot
-
Click on the Pivot Widget icon from left navigation bar.
-
You will land on the Pivot Widget Configuration screen.
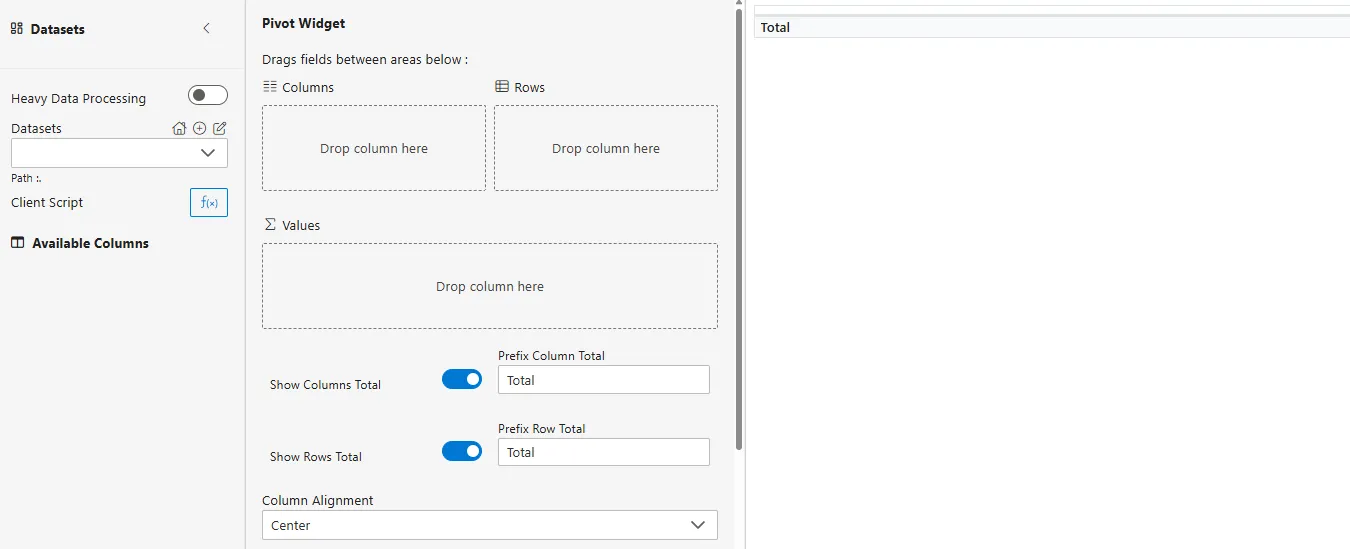
Configuring the Widget
Select Dataset
-
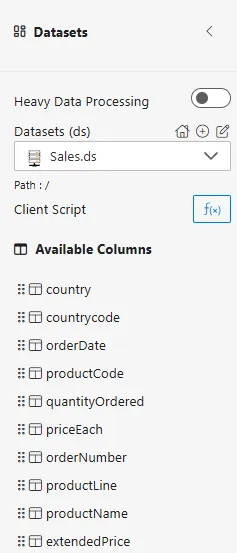
Choose a dataset from the Datasets dropdown.
-
All columns from the dataset will appear in the Available Columns panel.
Client Script (Optional)
- Add client-side logic to filter or transform data before it displays.
--- link to client script
-
Drag and drop your desired columns from the dataset into the respective sections:
-
Rows: For grouping data (e.g.,
productLine,region) -
Columns: For cross-tabulation (e.g.,
year,quarter) -
Values: For metrics and aggregations (e.g.,
extendedPrice,quantity)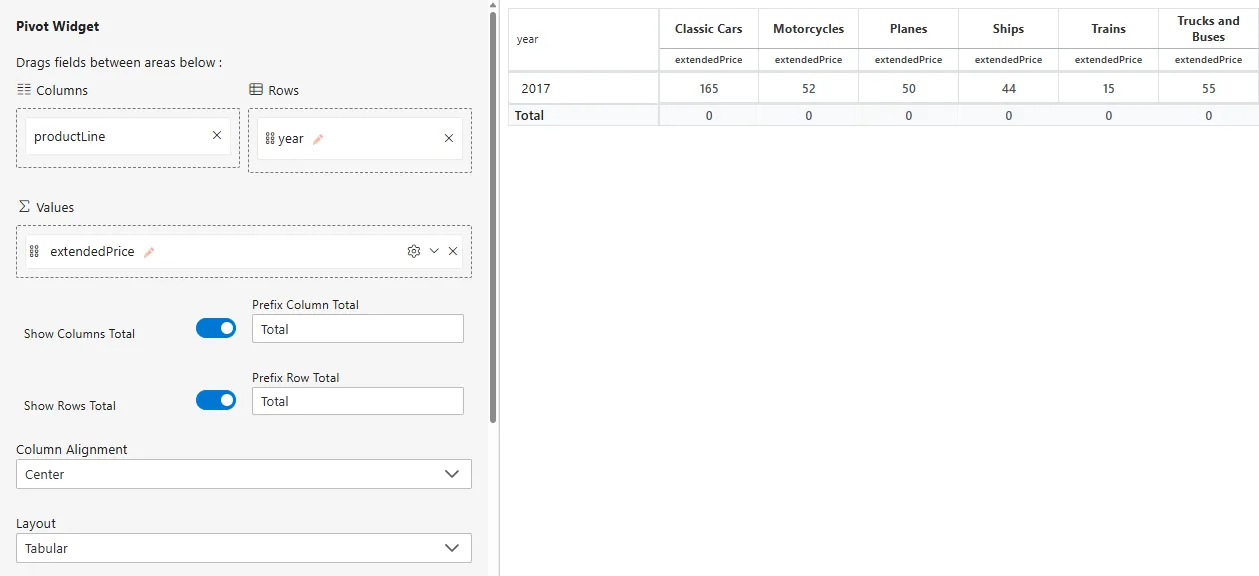
-
-
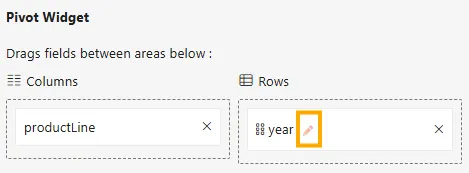
Click on the pencil icon next to each field to rename the field.
-
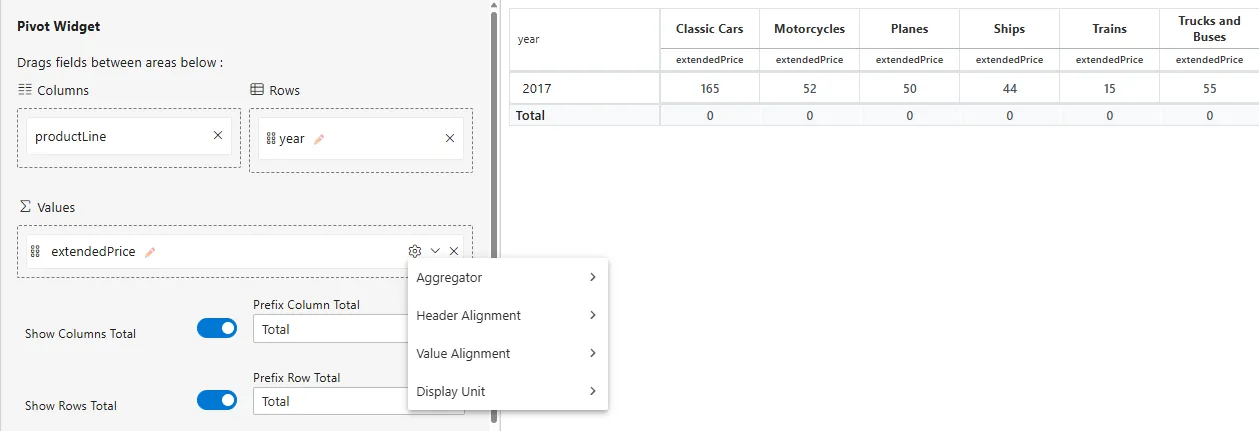
Click on the settings icon next to each Values field to:
-
Select the aggregation type: Sum, Average, Count, Distinct Count, etc.
-
Select Header Alignment: Left, Center, Right
-
Select Value Alignment: Left, Center, Right
-
Select Display Unit: To display value in different unit like Million (M), Billions (B), auto to calculate unit automatically etc.
-
-
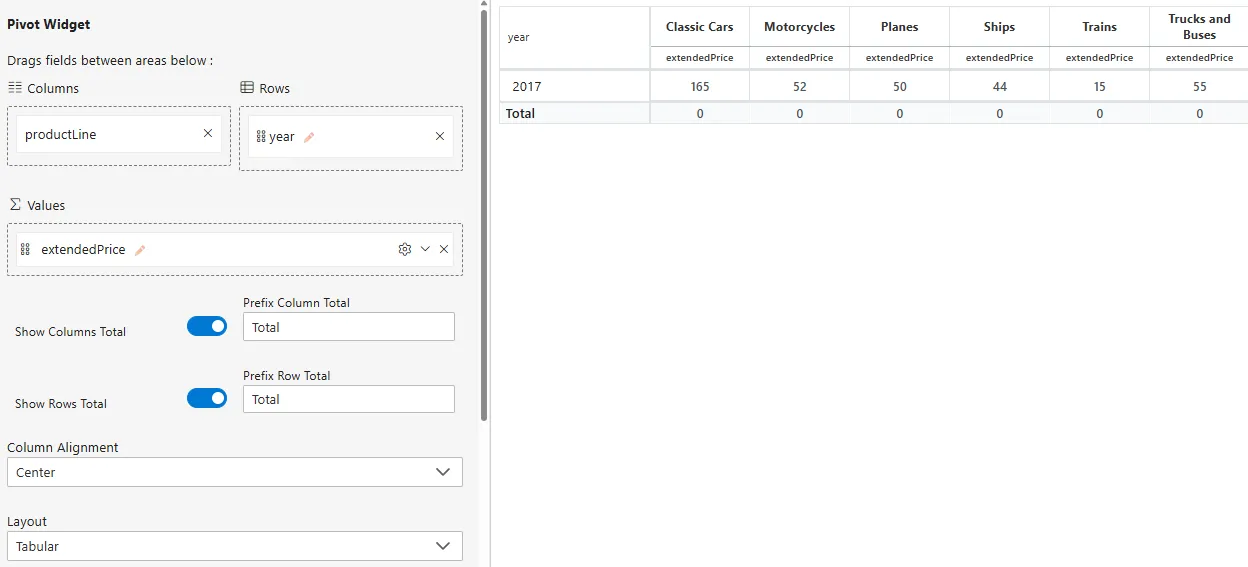
Toggle the Show Columns Total or Show Rows Total switches if you want to display grand totals.
-
Choose the layout:
-
Compact: Minimal view with nested groups
-
Tabular: Flat view with full headers
-
-
Optionally, configure layout and scrolling behavior for better usability:**
-
Sticky Settings (for improved navigation):
- Sticky First Column: Keeps the first column visible during horizontal scrolling
- Sticky Header Rows: Keeps the header rows visible during vertical scrolling
- Sticky Row Total: Keeps the total row fixed at the bottom while scrolling
-
Compact Layout Options:
- Collapse All Groups by Default: When enabled, all row groups will be initially collapsed to simplify the view
-
Tabular Layout Options:
-
Repeat Parent Values:
- When enabled, parent values are repeated in every child row
- When disabled, parent values are only shown in the first child row of each group
-
Show Subtotals:
- When enabled, subtotal rows are displayed for each group
- When disabled, child rows begin at the same level without subtotal rows
-
- Once configured, your pivot will automatically update with the defined structure and formatting.