AIV Analysis Buddy
The AIV Analyzer Buddy is an intelligent AI-powered analysis assistant that transforms natural language queries into actionable insights. It seamlessly combines natural language understanding, advanced data processing, and interactive visualizations to deliver comprehensive reports and strategic recommendations — all through simple conversational inputs.
Key Features
-
Natural Language Querying: Ask questions in plain English — no SQL or coding required. Example: “Show me the top 10 products by revenue in 2024.”
-
Intelligent Query Classification: Automatically detects whether your question refers to existing chart data or requires a new database query.
-
Smart Data Filtering: Dynamically applies filters, aggregations, and limits to fetch only relevant data for faster, more focused analysis.
-
Comprehensive Analysis Reports: Generates a detailed report (100–150 words) that highlights totals, averages, trends, and anomalies.
-
Actionable Recommendations: Provides strategic insights (100–150 words) with measurable outcomes, improvement suggestions, and risk considerations.
-
Interactive Visualizations: Automatically creates ECharts-based charts suited to your question type — such as bar, line, pie, or scatter plots.
-
Error Handling & Validation: Offers clear, user-friendly error messages for missing data, invalid fields, or ambiguous queries.
Steps to Use the AIV Analyzer Buddy
-
Hover over the widget, then click the
 icon to open the Widget Settings panel.
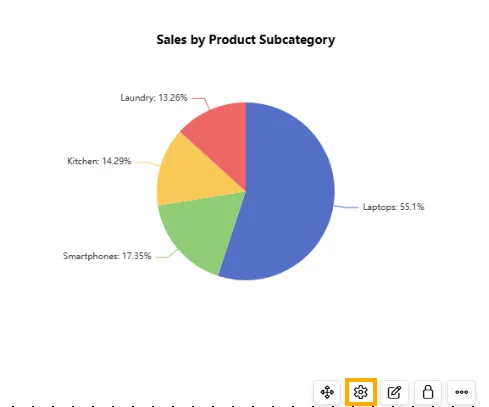
-
In General settings, disable Hide Analysis to enable the
 icon on the widget.
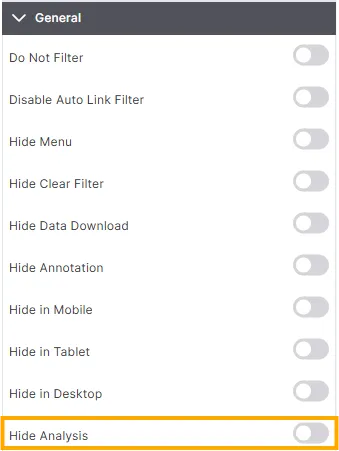
-
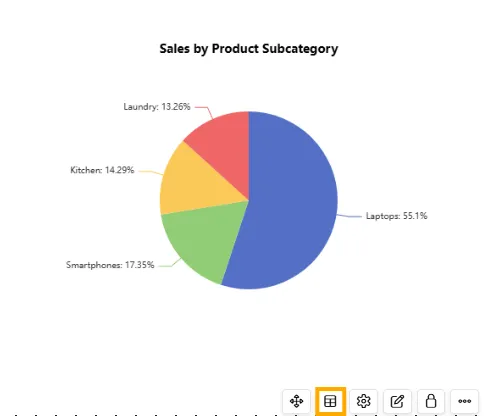
Then, click Analysis icon on the widget, to open the Analysis Hub.
-
Enter your prompt in the text box and click the
 button.
Example
-
Dataset: ProductSales.ds
-
Prompt: If Laptop sales grow by 5%, how does their revenue contribution compare to other product subcategories?
-
-
The system will process your query, modify the sheet accordingly, and generate two sections:
-
Analysis Report — Detailed interpretation and insights based on your prompt.
-
Suggestions — Actionable recommendations derived from the analysis.
Prompt Actions
-
Copy Prompt: Click the
 icon to copy the prompt you entered. A pop-up message confirms: “Prompt copied to clipboard!”
-
Edit Prompt: Click the
 icon to modify your existing prompt.
 -
Share Charts: The Share Charts feature allows you to share analysis results either by downloading a file or sending it directly via email.
-
Click the
 icon. The Share Chart dialog box appears, providing options to Download PDF or Share via Email.
a. Download PDF
-
Purpose: Allows you to save the analysis as a PDF file.
-
Use case: Download the file to your device and share it manually through any external platform (email, messaging apps, or document repositories).
-
Click on the Download PDF button. After a successful download, a confirmation pop-up message appears stating:“Successfully downloaded 2 charts in a single PDF!”

b. Share via Email
-
Purpose: Enables you to send the analysis directly from the system without downloading files separately.
-
Use case: Quickly share insights with stakeholders via email.
-
Email Fields
-
To: Specifies the primary recipient(s) of the email.
-
Cc: Sends a copy of the email to additional recipients for visibility. All recipients can see who is included in the Cc list.
-
Bcc: Sends a copy of the email to recipients without revealing their email addresses to other recipients.
-
Subject: The email subject line.
-
Default value: Shared Analysis for: Sheet_1. This indicates which sheet’s analysis is being shared.
-
Upload Files (2): Automatically attaches the following files:
-
original_sheet.pdf — The PDF version of the original, unmodified dataset.
-
modified_sheet_1.pdf — The PDF version of the dataset after applying the analysis or prompt-based changes.
-
-
-
-
Common Error Messages
| Error Message | Cause | Solution |
|---|---|---|
| The requested field doesn’t exist in the dataset | Column name mismatch | Verify available columns in dataset |
| No data found matching your query criteria | Filters returned no results | Adjust filters or time range |
| Date format issue detected | Invalid date string format | Use standard date format |
| Unable to understand the query structure | Query too vague | Rephrase with specific details |
| Missing required ‘uri’ parameter | Missing dataset source | Provide valid data source URL |
| API key is required | Missing authentication | Include valid API key in request |
Summary
The AIV Analyzer Buddy revolutionizes data analysis by enabling anyone to interact with their data conversationally. It automatically interprets questions, generates optimized queries, analyzes data patterns, and visualizes insights — all in one seamless process. By combining intelligence, automation, and visualization, it empowers users to make faster, smarter, and more confident data-driven decisions.