Embed Link Filter with Pivot
It is a way to incorporate a document into an existing file. Once a document is embedded into another file, they start to exist as a single file.
In this Document you will learn to Create a dashboard and add a Pivot chart widget and Table widget. You will learn create embed link and how to connect embed link with one dashboard to another dashboard and filter detail dashboard with global filter parameters.
Use Case:
You have a summary dashboard that contains aggregated data, and you prefer not to display detailed data within this dashboard. Instead, you have a separate “Detailed Dashboard” for that purpose. When you click on summarized data in the summary dashboard, it should redirect you to the detailed dashboard, with the appropriate filter values applied based on the summary dashboard.
This document demonstrates how to achieve this. The summary dashboard uses a pivot table to display grouped data, while the detailed dashboard includes a table widget that shows detailed data. The detailed dashboard is filtered by two parameters: 1.Country, and 2.Product Line.
In this scenario, we will utilize a pivot table. Clicking on any number in the pivot table will redirect you to the detailed dashboard, passing along the corresponding row and column values.
-
Create the Summary Dashboard:
- Click the hamburger icon.
- Click the
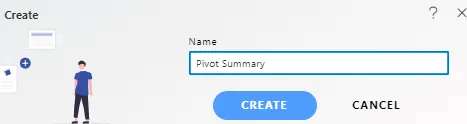
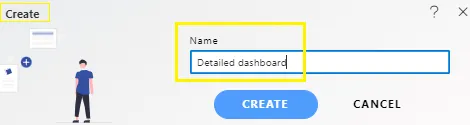
+icon under the Dashboard tab. - The “Create Dashboard” dialog box will appear. Enter a name for the dashboard, as shown in the figure below, and click Create.
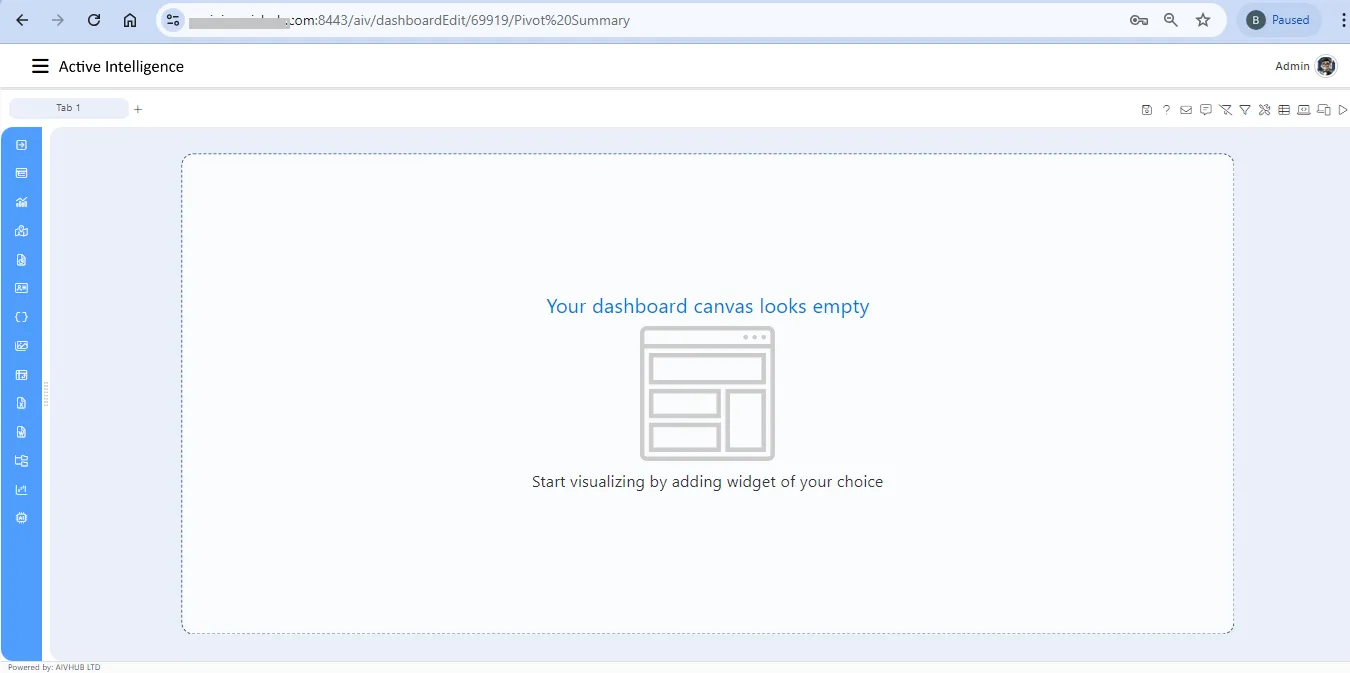
- An empty dashboard will be displayed.
- Click the hamburger icon.
-
Add a Pivot Table to the Summary Dashboard:
- Select the Pivot Widget icon from the left vertical menu.
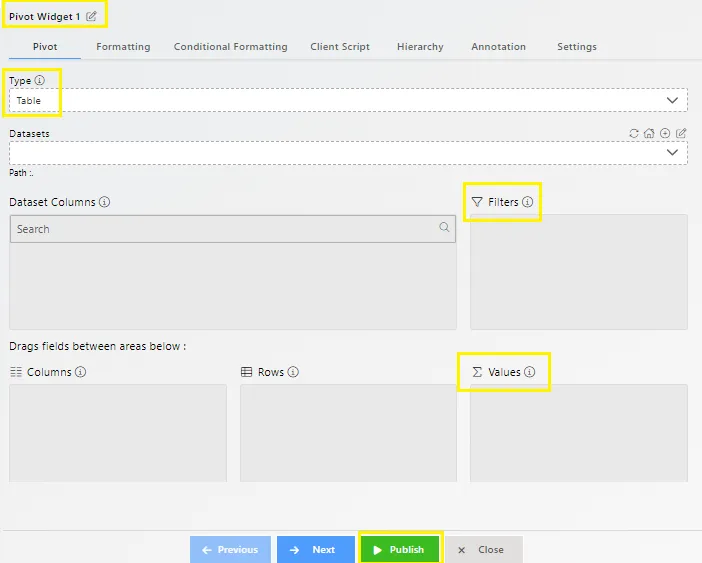
- The edit menu box appears as you click on the Pivot chart widget icon, and a widget is automatically added to the dashboard.
- In the Pivot settings:
- Type:
Table - Dataset:
Sales.ds
- Type:
- Drag and drop
Countryinto the rows andProduct Lineinto the columns. - Fill in the details as shown below:
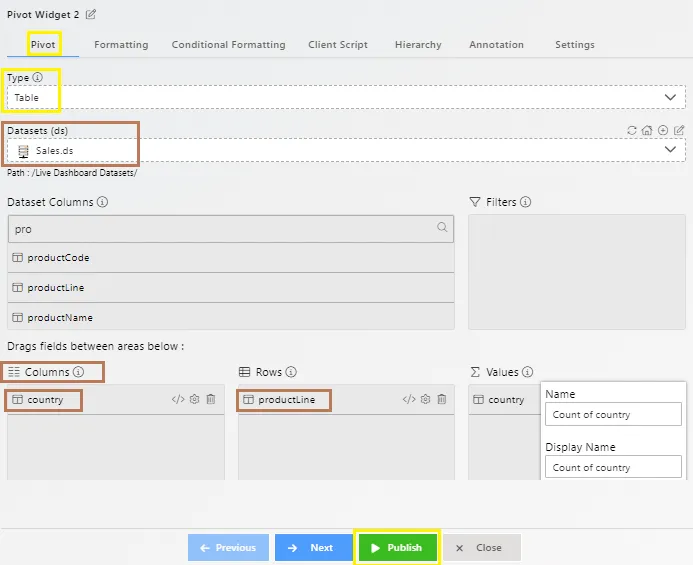
- Click Save and Exit.
- Select the Pivot Widget icon from the left vertical menu.
-
Create the Detailed Dashboard:
- Create a new dashboard and name it “Detailed Data,” as shown in the figure below.
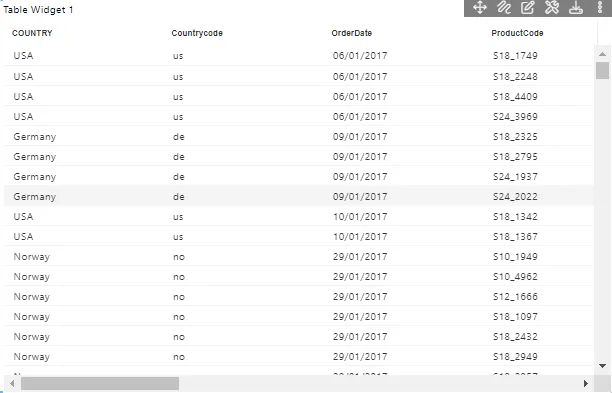
- Select the Table Widget icon from the left vertical menu.
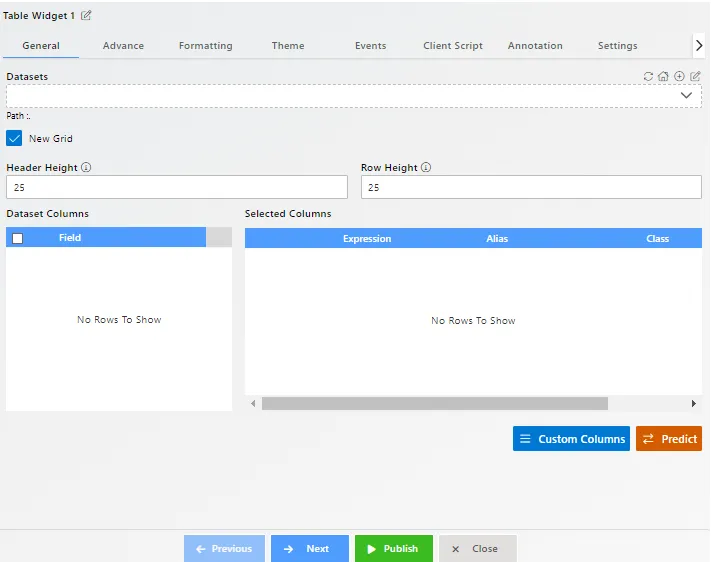
- The edit menu box appears as you click on the Table Widget icon, and a widget is automatically added to the dashboard.
- In the General Property settings:
- Dataset:
Parameter Sales DS.ds - In the Dataset Column, select all the fields.
- Dataset:
- Fill in the details as shown below:
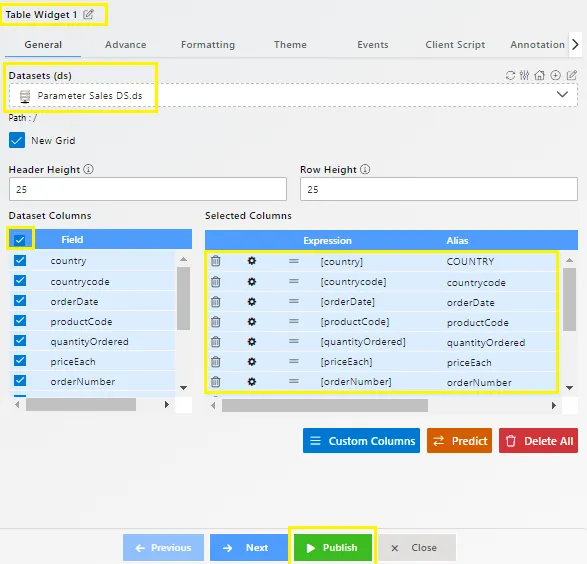
- Click Publish.
- Create a new dashboard and name it “Detailed Data,” as shown in the figure below.
-
Embed the Detailed Dashboard:
- Click the Embed icon on the Detailed Data Dashboard.
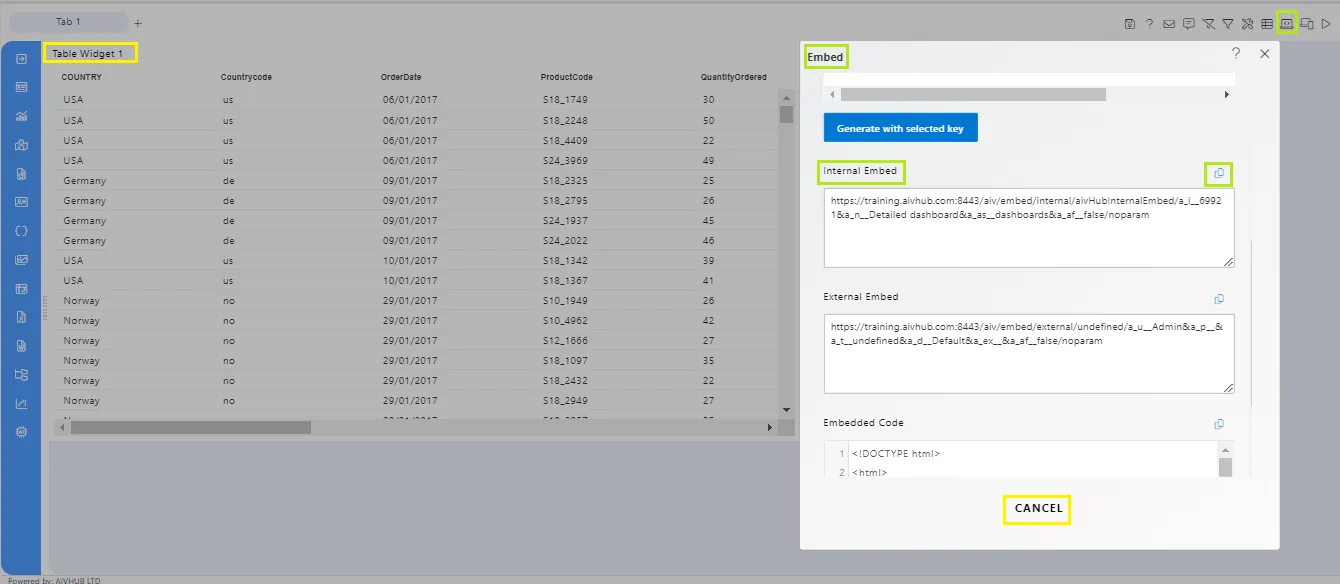
- Copy the link for the internal embed.
- Click Cancel.
- Click the Embed icon on the Detailed Data Dashboard.
-
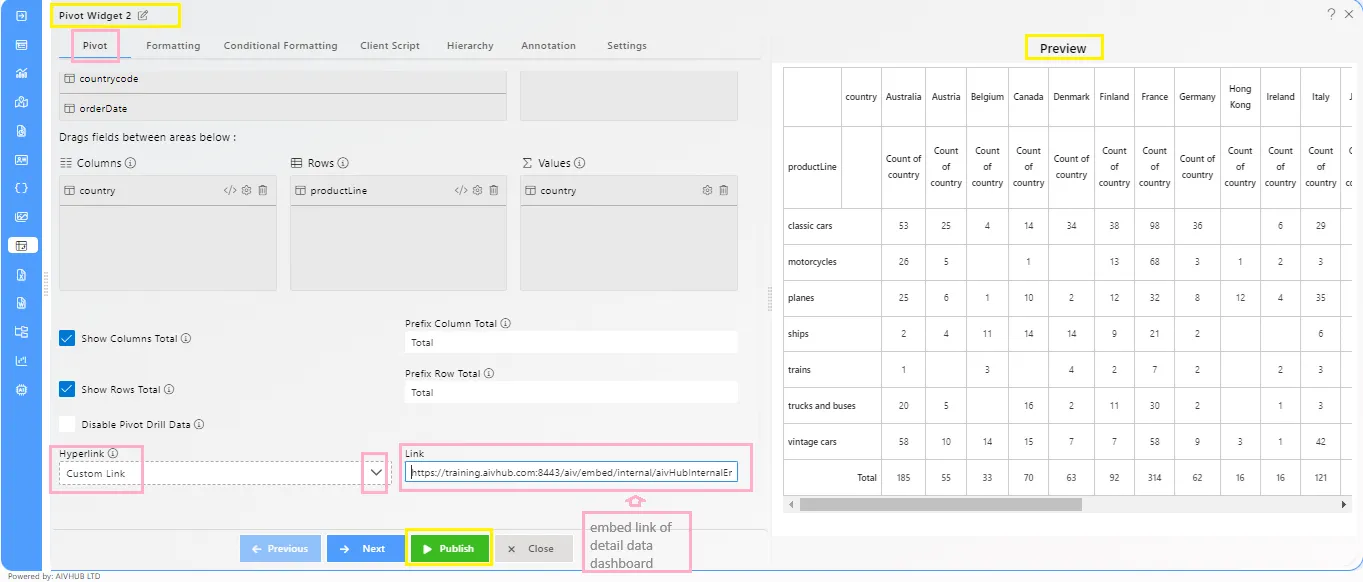
Link the Dashboards:
- Open the Pivot Summary Dashboard in edit mode.
- In the Pivot Property settings, enter the following details:
- Hyperlink: Custom Link > Link:
https://training.aivhub.com:8443/aiv/embed/internal/aivHubInternalEmbed/a_i__69916&a_n__Detailed dashboard&a_as__dashboards&a_af__true/aivg_country___{{country}}&aivg_productline___{{productLine}}
- Hyperlink: Custom Link > Link:
- Fill in the details as shown below:
-
Finalize and Test:
- Click Save and Exit.
- Enter Preview mode.
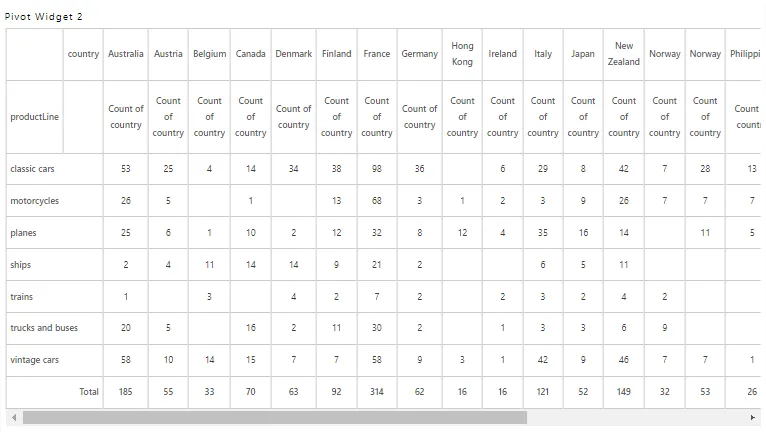
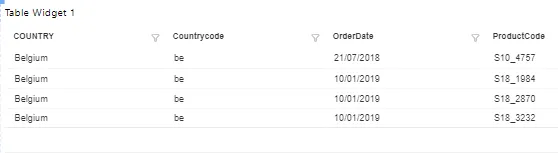
- For example, if Belgium has 4 counts of Classic Cars, clicking on the “4” will take the row value as “Belgium” and the column value as “Classic Cars” in the embed URL.
- You will be redirected to the Detailed Data Dashboard, where the data will be filtered by Country (Belgium) and Product Line (Classic Cars), as shown below:
The following topics will be covered under this section:-